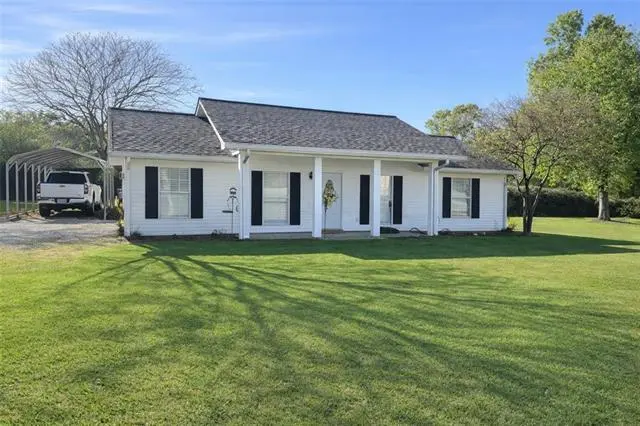
178 Maria Dr · Hessmer, LA
Flood risk 1/10 · Minimal
- FEMA flood zone
- X
- Chance of flooding over 30 yrs
- 0.0%
- Est. flood insurance / yr
- $507 – $1,088
Fire risk 3/10 · Minor
- Est. fire insurance / yr
- $1,269 – $2,357
Heat risk 8/10 · Major
- Hot days now (above 112°F)
- 7 days/yr
- Hot days in 30 yrs
- 19 days/yr
Wind risk 8/10 · Major
- Chance of severe wind over 30 yrs
- 99.0%
Air-quality risk 1/10 · Minimal
- Unhealthy air days now
- 0 days/yr
- Unhealthy air days in 30 yrs
- 0 days/yr
Risk factors via First Street. Map © Google.
Why this score? — see what drove the D grade
The composite is a weighted blend of 9 inputs, each scored 0–100. Each bar is that input's sub-score; the figure is the points it added to the 100-point composite (weight × sub-score).
- Cash flow +11.4/30.0
- ARV discount +7.5/15.0
- Appreciation +6.6/10.0
- DSCR +3.3/10.0
- Livability +2.8/5.0
- Rent growth +2.5/5.0
- Condition / age +2.5/5.0
- 1% rule +2.2/10.0
- Schools +2.1/10.0
$180,000
🖨 Deal sheet (PDF) 📄 Offer letter ✓ Due diligence
Listing remarks
This 4 bedroom, 2 bath home is located in a great neighborhood. A master bedroom was added years ago and a master suit with an oversized tub and walk in shower. Home has a privacy fence around the back yard and the central air and heat is less than 9 years old. Must see to appreciate.
Key facts
- Master suite
- Central air and heat
- Privacy fence
Tags
Property features AI
Exterior
- Parking: Carport
- Home design: Single family residence
- Construction: Vinyl siding and frame construction; Composition roof
- Exterior features: Wood and other fencing; Composition roof; Vinyl siding; Frame construction
Interior
- Kitchen: Kitchen
- Bedrooms: Bedroom 1; Bedroom 2; Bedroom 3
- Bathrooms: 2 full bathrooms
- Heating & cooling: Central heating; Central air conditioning
- Interior features: Includes bedrooms and kitchen
Neighborhood map
What this means for you Summary
Snapshot
- This is a 4-bed/2.0-bath single-family listed at $180k.
Deal economics
- At list price, monthly cash flow is $-63 ($-753/yr) — negative.
- To cash-flow at today's rent, offer at most $169k (6.2% below list).
- To meet the 1% rule (rent ≥ 1% of price), the offer needs to be $130k (27.5% below list).
- Recommended offer: $130k (27.5% below list) — sets the bar for 1% rule.
Location & tenants
- Location reads 56/100 on livability (#350 in LA) — a working-class tenant base; expect higher turnover. Strengths: cost of living A+, housing B+; Watch: health & safety C-, employment D, crime F.
- Avoyelles Parish (rural): math 22% / reading 30% proficiency, ranked #56 of 98 in LA (top 57%) — low school quality limits family demand, transient renter base, plan for 1-2y turnover; 75% free/reduced lunch — lower-income household profile, screen leases tightly.
- Zoned schools: Bunkie Elementary School (math 22% / reading 27%, grade F, #384 of 646 statewide, top 62%, 356 students, 77% FRL); Bunkie Magnet High School (math 23% / reading 28%, grade F, #149 of 265 statewide, top 56%, 702 students, 52% FRL).
- Market conditions: 11 active listings in the ZIP; 15 units permitted in Avoyelles Parish in 2024 (0 in 5+ unit buildings).
Forward outlook
- In year one you build about $7k of equity ($1k loan paydown + $6k appreciation (3.2% local appreciation)).
- Avoyelles County population projected at -18% by 2050 — secular population decline; favor cash flow + early exit over multi-decade hold.
- At projected returns (3.2% appreciation + 3.0% rent growth), your $50k cash investment doubles in ~7 years — after that, you're playing with house money.
- By year 5, paydown + projected appreciation supports a ~$30k cash-out refi (75% LTV) — recoverable capital for the next deal without selling this one.
Negotiation context
- It's been on market 42 days — a 3% lower offer ($175k) is reasonable based on typical stale-listing flexibility.
- 4 sale attempts since 8y ago with the ask held roughly flat each time — persistent listings suggest the price (not the market) is what's stuck; bring a comps-based counter.
- Current owner paid $142k; 27% above their basis — modest negotiation headroom, anchor on the comps not their cost.
Risks & watch-outs
- Climate carrying-cost: severe wind risk, 99% chance of damaging wind over 30y; extreme-heat days projected 7→19/yr by 2055 (HVAC capex compounding) — expect insurance premiums to compound above CPI over the hold.
Questions for the listing agent
- What do current leases actually rent for vs. the listed asking? Can we see a recent rent roll and the last 12 months of T-12 income?
- It's been on market 42 days. Have you received any prior offers? Is the seller open to a 28% concession, seller financing, or rate buy-down credit?
- Is there a deadline driving the sale (1031 exchange, divorce, estate, relocation)? That informs how much negotiation room exists.
- Schools are F-rated, which usually means shorter tenancies and higher turnover. Who's the typical renter profile here, and what's been the actual vacancy rate?
- Crime grade is F in this area — have there been break-ins, vandalism, or insurance claims at this property in the last 3 years? What carrier currently insures it and at what premium?
- The area grade is low — what's the realistic commute time and amenity access for the typical tenant pool here? Any planned neighborhood developments (good or bad) we should know about?
- What's the average days-on-market for RENTAL listings here right now (not sales)? A rising rental-DOM trend means longer vacancies and softer asking-rent achievability than the comps imply.
- What's the recent tenant-quality profile in this submarket — average credit score on applications, eviction rate, late-payment / NSF rate, and stable-employment percentage? A property-management company in the area should have these aggregated.
- How much new for-sale + rental construction is in the pipeline within 1–3 miles? Heavy new supply typically softens prices + rents 12–24 months out; constrained supply supports both.
Investment metrics
- 1% rule
- 0.72% ✗
- Cap rate
- 5.87%
- Cash-on-cash
- -1.49%
- DSCR
- 0.93
- GRM
- 11.5
CMA / ARV
No comps found within radius.
Projected returns pro-forma
3.17% appreciation · 3.0% rent growth · sell at horizon
- IRR
- 6.6%
- Equity multiple
- 1.38×
- Total profit
- $19,207
- Equity at exit
- $82,630
- IRR
- 9.3%
- Equity multiple
- 2.43×
- Total profit
- $71,942
- Equity at exit
- $128,675
Cash invested: $50,400 (down + closing). Projections, not guarantees.
Landlord ↔ Tenant lean methodology
- Overall (STATE)
- 90 Strongly Landlord-Friendly
- State Louisiana
- 90 Strongly Landlord-Friendly · R+12
- County
- — inherits STATE
- City
- — inherits STATE
ZIP-level market 71341
- Home prices YoY
- 2.9%
- Active inventory
- 11
- Price-to-rent
- 11.5×
Monthly cashflow live
- Estimated rent
- $1,304 medium interval (Pro) →
- Mortgage (P&I)
- −$944
- Tax from tax record
- −$74 /mo · $891/yr
- Insurance
- −$75
- HOA
- −$0
- Vacancy / Maint / Mgmt
- −$274
- Net cashflow
- $-63
Break-even live
Sensitivity live
| Price | -10% $39 | -5% $-12 | +0% $-63 | +5% $-114 | +10% $-165 |
|---|---|---|---|---|---|
| Rent | -10% $-166 | -5% $-114 | +0% $-63 | +5% $-11 | +10% $40 |
| Rate | -1.0pp $28 | -0.5pp $-17 | base $-63 | +0.5pp $-109 | +1.0pp $-157 |
UW: 25.0% down · 7.5% · 30yr · 1.5% tax · 5.0% vac · 8.0% maint · 8.0% mgmt
Financing live
Cash to close
- Down payment
- $45,000
- Closing costs
- $5,400
- Reserves months
- —
- Total cash needed
- —
Loan-product check · same deal, 3 products live
Conventional
25% down · 7.5% · 30yr
- Down + closing
- —
- Monthly P&I
- —
- Monthly cashflow
- —
- DSCR
- —
- Eligible?
- —
Personal DTI + credit; lowest rate.
DSCR
20% down · 8.5% · 30yr
- Down + closing
- —
- Monthly P&I
- —
- Monthly cashflow
- —
- DSCR
- —
- Eligible?
- —
No personal income docs; deal must DSCR.
Hard money
10% down · 12.0% · 12mo
- Down + closing
- —
- Monthly P&I
- —
- Monthly cashflow
- —
- DSCR
- —
- Eligible?
- —
Short-term bridge; refi at stabilization.
Listing history 21 events
-
2026-06-15status $180,000 Pending 42 DOM
-
2026-06-15days on market $180,000 Active 42 DOM
-
2026-06-14days on market $180,000 Active 40 DOM
-
2026-06-13days on market $180,000 Active 39 DOM
-
2026-06-10days on market $180,000 Active 37 DOM
-
2026-06-09days on market $180,000 Active 36 DOM
-
2026-06-08days on market $180,000 Active 35 DOM
-
2026-06-07days on market $180,000 Active 34 DOM
-
2026-06-03days on market $180,000 Active 30 DOM
-
2026-06-02days on market $180,000 Active 29 DOM
-
2026-06-01days on market $180,000 Active 28 DOM
-
2026-05-31days on market $180,000 Active 27 DOM
-
2026-05-30days on market $180,000 Active 26 DOM
-
2026-05-14status Active
-
2026-04-02status Pending
-
2026-03-23$180,000 Active
-
2019-03-11soldstatus $142,250
-
2018-11-06$139,500
-
2018-10-16$140,000
-
2010-04-28soldstatus $100,000
-
2005-07-14soldstatus
ⓘ Source: listings_history table (triggers on properties + properties_extension) + one-shot
backfill from property_details.listing_events for pre-trigger history.
Tax reassessment forecast LA · Resets to sale price
- Current annual tax
- $891 · $74/mo
- Projected year-2 tax
- $990 · $82/mo
- Expected delta
- +$99/yr (+$8/mo · 11.1%)
ⓘ Screening estimate from a state-policy table — verify with the county assessor before closing.
Climate risk First Street
- Flood 1/10 Low FEMA zone X · 0% chance over 30 yrs
- Wildfire 3/10 Moderate
- Heat 8/10 Severe 7 d/yr ≥112°F today · 19 d/yr by 30 yrs out
- Wind 8/10 Severe 99% chance of damaging wind over 30 yrs
- Air quality 1/10 Low 0 unhealthy d/yr today · 0 by 30 yrs out
Nearby sold comps map
Loading sold comps map…
Walkable amenities ~0.75 mi
Loading nearby amenities…
Taxation est. · year 1
- Rental income
- $15,652
- − Mortgage interest
- −$10,083
- − Property taxes
- −$891
- − Insurance
- −$900
- − Repairs & maintenance
- −$1,252
- − Management
- −$1,252
- − Depreciation
- −$5,236
- Taxable loss
- −$3,962
- Est. tax savings @ 24.0%
- +$951
- After-tax cash flow
- $198/yr
For passive investors: Depreciation is non-cash, so a rental often shows a tax loss while cash-flowing — sheltering income. Rental losses are passive: they offset passive income freely, and up to $25,000/yr can offset ordinary (W-2) income if you actively participate and your MAGI is under $100k (phasing out to $0 by $150k); unused losses carry forward. On sale, claimed depreciation is recaptured at up to 25%, and gains may owe capital-gains tax (a 1031 exchange can defer both). Figures are a year-1 estimate at your 24.0% rate — not tax advice; consult a CPA.
Schools (NCES district)
- District
- Avoyelles Parish
- NCES district ID
- 2200150
- Math proficiency
- 22% ▼ -32.00%
- Reading proficiency
- 30% ▼ -29.00%
- Median HH income
- $33,891
- Composite
- 21.32/100
- National rank
- #8378
- State rank
- #56 of 98 in LA
Livability — Hessmer
- Score
- 56/100
- State rank
- #350
- US rank
- #22995
Category grades
Schools grade is shown separately in the Schools card above.
Census & demographics
- Population (ZIP)
- 2,901
Population outlook (Avoyelles County) Hauer SSP2
- Today (2025)
- 39,084 people
- By 2030
- 37,784 · -3.3%
- By 2040
- 35,049 · -10.3%
- By 2050
- 32,225 · -17.5%
- By 2075
- 25,695 · -34.3%
- By 2100
- 18,985 · -51.4%
Race, ethnicity, and origin ACS 2023
- Neighborhood character
- Predominantly White (71%)
- Race & ethnicity
- White 71% Black 19% Hispanic / Latino 6% Two or more races 5%
- Hispanic origin (detail)
- Mexican 6%
- Common ancestry
- Lithuanian 26% Iranian 1% Russian 1%
- Foreign-born
- 1% · Canada
- Languages at home
- 82% English-only · French/Haitian/Cajun 14% Spanish 2% Arabic 1%
Political lean MEDSL · Avoyelles
- 2024 margin
- Solid R (+43.1) · D 27.8% · R 71.0% · Other 1.2%
- 2008→2024 swing
- -20.1pp toward R · 2008: -23.1pp · 2024: -43.1pp
- All cycles
- 2024: R+43.1 2020: R+40.8 2016: R+37.0 2012: R+27.0 2008: R+23.1
Not yet ingested
- Civics
- —
Market trends
- HPI YoY
- ▲ 3.17%
- Current HPI
- 113.6662
- Rent YoY
- —
- Metro
- —
- State GDP YoY
- ▲ 3.29%
- F500 in state
- 10
Industry mix (Fortune 500 HQ in LA)
| Industry | F500 HQs | Revenue |
|---|---|---|
| Telecommunications | 2 | $23B |
|
||
| Utilities | 1 | $12B |
|
||
| Wholesale / Distribution | 1 | $5B |
|
||
| Advertising | 1 | $2B |
|
||
Price history
+80.0% since first listed8 events — show timeline
- 2026-05-14 Relisted — AcadianaMLS
- 2026-04-02 Pending — AcadianaMLS
- 2026-03-23 Listed $180,000 AcadianaMLS
- 2019-03-11 Sold (Public Records) $142,250 Public Records
- 2018-11-06 Listed $139,500 AcadianaMLS
- 2018-10-16 Listed $140,000 AcadianaMLS
- 2010-04-28 Sold (Public Records) $100,000 Public Records
- 2005-07-14 Sold (Public Records) — Public Records
Property tax history
+4.8%/yrLatest (2025): $891 · +0.0% YoY. Source: county tax records.
Cash-flow waterfall
monthlySold comps — $/sqft
last 12 mo · ≤1 miLoading sold comps…