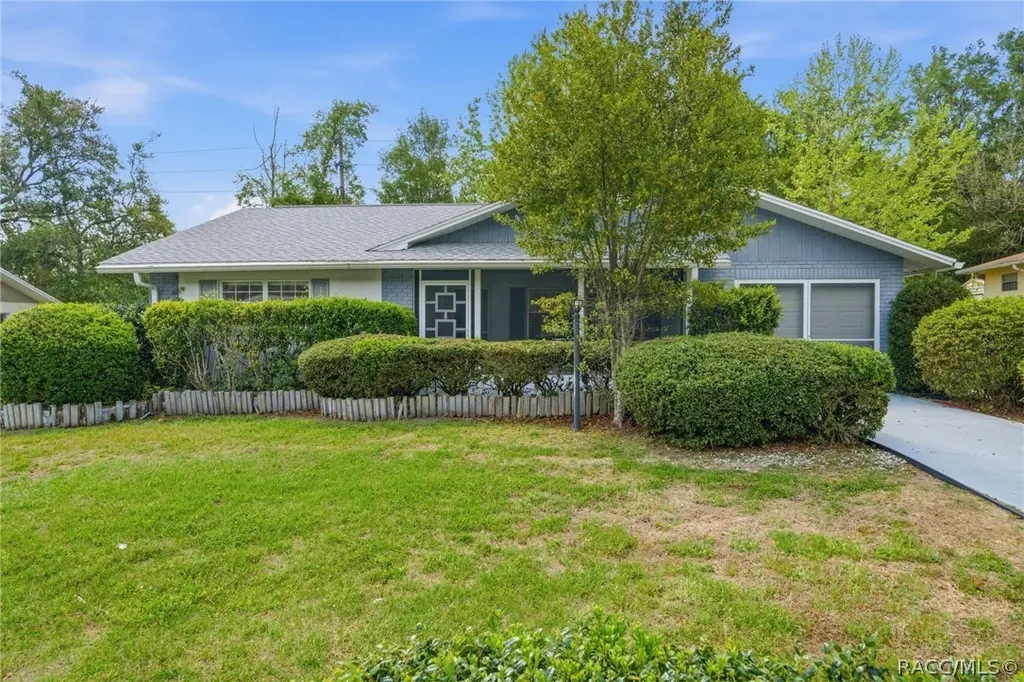
388 W Sugarmaple Ln · Pine Ridge, FL
Flood risk 10/10 · Severe
- FEMA flood zone
- X (unshaded)
- Chance of flooding over 30 yrs
- 0.99%
- Est. flood insurance / yr
- $507 – $1,088
Fire risk 5/10 · Moderate
- Est. fire insurance / yr
- $947 – $1,759
Heat risk 9/10 · Severe
- Hot days now (above 108°F)
- 7 days/yr
- Hot days in 30 yrs
- 24 days/yr
Wind risk 9/10 · Severe
- Chance of severe wind over 30 yrs
- 99.0%
Air-quality risk 1/10 · Minimal
- Unhealthy air days now
- 0 days/yr
- Unhealthy air days in 30 yrs
- 0 days/yr
Risk factors via First Street. Map © Google.
Why this score? — see what drove the D+ grade
The composite is a weighted blend of 9 inputs, each scored 0–100. Each bar is that input's sub-score; the figure is the points it added to the 100-point composite (weight × sub-score).
- Cash flow +14.3/30.0
- ARV discount +10.6/15.0
- DSCR +4.4/10.0
- Schools +4.1/10.0
- 1% rule +3.4/10.0
- Livability +3.4/5.0
- Rent growth +2.5/5.0
- Condition / age +2.5/5.0
- Appreciation +0.0/10.0
$199,000
🖨 Deal sheet (PDF) 📄 Offer letter ✓ Due diligence
Listing remarks MLS
What A Beauty!!! Look at all the updates in this lovely 2/2/1 charmer. new carpet, new windows, new garage door, new hot water heater, new frig, new washer/dryer, new duct work, new front screened porch, new 14 x 13 slab and 11 x12 Screened lanai out back. This owner has taken pride in the house to make it a home. Move in ready. Grab your things and move right in. Close to school and shopping, Private back yard. So call today for your private viewing and come see your new home.
Key facts
- Thoughtful upgrades
- No hoa
- A/c replaced
Tags
Property features AI
Finance
- HOA & community: Community park
Exterior
- Parking: Attached garage with 1 garage space; Driveway; Concrete surfaces; Garage door opener
- Security: Smoke detectors
- Utilities: Public water; Public sewer; Underground utilities
- Home design: Single-family residence; One story; Home faces north
- Construction: Stucco exterior; Asphalt shingle roof; Block and slab foundation; Built on one level
- Exterior features: Rain gutters; Sliding doors; Landscaped yard; Level lot; Wooded; Paved road frontage on a county road; Park nearby (community feature)
Interior
- Kitchen: Electric range; Electric oven; Refrigerator; Pantry
- Bedrooms: Total rooms: 11
- Flooring: Carpet; Vinyl
- Bathrooms: 2 full bathrooms
- Heating & cooling: Heat pump; Central electric air conditioning
- Interior features: Eat-in kitchen; Laminate countertops; Open floorplan; Pantry; High-speed internet; Blinds and window treatments; Double pane windows
- Laundry & utility: Washer; Dryer; Water heater
Neighborhood map
What this means for you Summary
Snapshot
- This is a 2-bed/2.0-bath single-family listed at $199k.
Deal economics
- At list price, monthly cash flow is $-28 ($-341/yr) — negative.
- To cash-flow at today's rent, offer at most $194k (2.5% below list).
- To meet the 1% rule (rent ≥ 1% of price), the offer needs to be $168k (15.7% below list).
- Recommended offer: $168k (15.7% below list) — sets the bar for 1% rule.
- Cap rate 6.5% vs local median 3.4% in Pine Ridge — top-decile yield for the area; either an underpriced asset or a hidden risk that comps aren't pricing in. Stress-test before assuming the spread holds.
Location & tenants
- Location reads 67/100 on livability (#565 in FL) — a middle-class / working-renter tenant base. Strengths: crime A+, housing A+, cost of living A-; Watch: health & safety C-, amenities F, commute F.
- Citrus (rural): math 49% / reading 50% proficiency, ranked #44 of 73 in FL (top 60%) — families likely to look elsewhere, expect single-tenant / working-renter base with shorter leases.
- Zoned schools: Forest Ridge Elementary School (math 55% / reading 59%, grade C+, #781 of 2,144 statewide, top 38%, 708 students, 67% FRL); Citrus Springs Middle School (math 55% / reading 54%, grade B-, #183 of 571 statewide, top 34%, 821 students, 59% FRL); Lecanto High School (math 46% / reading 53%, grade D, #179 of 667 statewide, top 29%, 1,630 students, 46% FRL) — zoned schools at 57% FRL track the district average.
- Market conditions: 401 active listings in the ZIP; 19 comparable units currently listed for rent nearby; rentals at typical pace (median 23d on market — plan ~3-4 weeks tenant-placement turnaround); 2,443 units permitted in Citrus County in 2024 (0 in 5+ unit buildings).
- This rent runs 37% of the median local income ($55k/yr) — at the standard rent-burdened threshold; future hikes will face affordability resistance.
Forward outlook
- Local home prices are declining (-3.0%/yr); year-one equity from $1k of loan paydown is wiped out by about $6k of value loss. Plan a longer hold.
- Citrus County population projected to shrink 10% by 2050 — rents likely to lag national; underwrite the cash flow, not the appreciation.
Negotiation context
- It's been on market 35 days — a 3% lower offer ($193k) is reasonable based on typical stale-listing flexibility.
- 3 sale attempts since 14y ago; this cycle's ask has dropped $20k (9%) from the opening price — seller is motivated, your offer sets the floor, not the list.
- Current owner paid $65k; list at $199k implies a 206% gain — meaningful room to come down on a strong offer.
Risks & watch-outs
- Watch-outs: flood insurance adds $66/mo.
- Climate carrying-cost: severe flood risk; severe wind risk, 99% chance of damaging wind over 30y; moderate wildfire risk; extreme-heat days projected 7→24/yr by 2055 (HVAC capex compounding) — expect insurance premiums to compound above CPI over the hold.
Questions for the listing agent
- What do current leases actually rent for vs. the listed asking? Can we see a recent rent roll and the last 12 months of T-12 income?
- It's been on market 35 days. Have you received any prior offers? Is the seller open to a 16% concession, seller financing, or rate buy-down credit?
- What's the actual annual flood-insurance premium (NFIP or private), and is the property in a SFHA with mandatory coverage?
- Is there a deadline driving the sale (1031 exchange, divorce, estate, relocation)? That informs how much negotiation room exists.
- Schools are F-rated, which usually means shorter tenancies and higher turnover. Who's the typical renter profile here, and what's been the actual vacancy rate?
- The area grade is low — what's the realistic commute time and amenity access for the typical tenant pool here? Any planned neighborhood developments (good or bad) we should know about?
- What's the average days-on-market for RENTAL listings here right now (not sales)? A rising rental-DOM trend means longer vacancies and softer asking-rent achievability than the comps imply.
- What's the recent tenant-quality profile in this submarket — average credit score on applications, eviction rate, late-payment / NSF rate, and stable-employment percentage? A property-management company in the area should have these aggregated.
- How much new for-sale + rental construction is in the pipeline within 1–3 miles? Heavy new supply typically softens prices + rents 12–24 months out; constrained supply supports both.
Investment metrics
- 1% rule
- 0.84% ✗
- Cap rate
- 6.52%
- Cash-on-cash
- 0.82%
- DSCR
- 1.04
- GRM
- 9.9
CMA / ARV
- ARV (on-the-fly)
- $213,856
- Comps found
- 12
Show comp detail 12 sales within ~0.75 mi
| Address | Dist | Beds/Ba | Sqft | Sold | Price | $/sf | Match |
|---|---|---|---|---|---|---|---|
| 388 W Sugarmaple Ln | 0.00mi | 2/2.0 | 1,304 (0%) | 1mo | $192,000 | $147 | 99 |
| 785 W Toucan Loop | 0.40mi | 2/2.0 | 1,250 (-4%) | 4mo | $225,000 | $180 | 71 |
| 605 W Buttonbush Dr | 0.24mi | 2/1.5 | 1,184 (-9%) | 1mo | $132,000 | $111 | 71 |
| 241 W Valerian Pl | 0.60mi | 2/2.0 | 1,344 (+3%) | 2mo | $219,999 | $164 | 65 |
| 3635 N Honeylocust Dr | 0.70mi | 2/2.0 | 1,326 (+2%) | 1mo | $233,000 | $176 | 64 |
| 146 W Seymeria Dr | 0.27mi | 2/1.5 | 1,170 (-10%) | 6mo | $219,000 | $187 | 63 |
| 3585 N Willowtree Pt | 0.58mi | 2/2.0 | 1,327 (+2%) | 9mo | $150,000 | $113 | 63 |
| 3526 N Tamarisk Ave | 0.62mi | 2/2.0 | 1,329 (+2%) | 9mo | $215,000 | $162 | 61 |
| 876 W Cockatiel Loop | 0.49mi | 2/2.0 | 1,212 (-7%) | 8mo | $225,000 | $186 | 58 |
| 3525 N Burroughs Path | 0.52mi | 3/2.0 (+1) | 1,388 (+6%) | 3mo | $223,500 | $161 | 58 |
| 246 W Valerian Pl | 0.57mi | 2/2.0 | 1,480 (+14%) | 8mo | $230,000 | $155 | 44 |
| 3579 N Tamarisk Ave | 0.67mi | 3/2.0 (+1) | 1,476 (+13%) | 2mo | $284,400 | $193 | 40 |
Match score weights: distance 35% · size 25% · config 20% · recency 20%. Top-matched comps best support the ARV.
Projected returns pro-forma
-3.0% appreciation · 3.0% rent growth · sell at horizon
- IRR
- -17.3%
- Equity multiple
- 0.39×
- Total profit
- $-34,045
- Equity at exit
- $29,672
- IRR
- -9.3%
- Equity multiple
- 0.43×
- Total profit
- $-31,930
- Equity at exit
- $17,206
Cash invested: $55,720 (down + closing). Projections, not guarantees.
Landlord ↔ Tenant lean methodology
- Overall (STATE)
- 87 Strongly Landlord-Friendly
- State Florida
- 87 Strongly Landlord-Friendly · R+3
- County
- — inherits STATE
- City
- — inherits STATE
ZIP-level market 34465
- Home prices YoY
- -33.1%
- Active inventory
- 401
- Price-to-rent
- 9.9×
Monthly cashflow live
- Estimated rent
- $1,677 high interval (Pro) →
- Mortgage (P&I)
- −$1,044
- Tax from tax record
- −$160 /mo · $1,921/yr
- Insurance
- −$83
- Flood insurance flood zone
- −$66 /mo · $798/yr
- HOA
- −$0
- Vacancy / Maint / Mgmt
- −$352
- Net cashflow
- $-28
Break-even live
Sensitivity live
| Price | -10% $84 | -5% $28 | +0% $-28 | +5% $-85 | +10% $-141 |
|---|---|---|---|---|---|
| Rent | -10% $-161 | -5% $-95 | +0% $-28 | +5% $38 | +10% $104 |
| Rate | -1.0pp $72 | -0.5pp $22 | base $-28 | +0.5pp $-80 | +1.0pp $-132 |
UW: 25.0% down · 7.5% · 30yr · 1.5% tax · 5.0% vac · 8.0% maint · 8.0% mgmt
Financing live
Cash to close
- Down payment
- $49,750
- Closing costs
- $5,970
- Reserves months
- —
- Total cash needed
- —
Loan-product check · same deal, 3 products live
Conventional
25% down · 7.5% · 30yr
- Down + closing
- —
- Monthly P&I
- —
- Monthly cashflow
- —
- DSCR
- —
- Eligible?
- —
Personal DTI + credit; lowest rate.
DSCR
20% down · 8.5% · 30yr
- Down + closing
- —
- Monthly P&I
- —
- Monthly cashflow
- —
- DSCR
- —
- Eligible?
- —
No personal income docs; deal must DSCR.
Hard money
10% down · 12.0% · 12mo
- Down + closing
- —
- Monthly P&I
- —
- Monthly cashflow
- —
- DSCR
- —
- Eligible?
- —
Short-term bridge; refi at stabilization.
Rent comps 19 comps
| Address | Beds | Baths | Sqft | Rent | $/sqft | DOM | Units | Dist |
|---|---|---|---|---|---|---|---|---|
| 144 W Sugarmaple Ln Beverly Hills, FL | 3.0 | 2.0 | 1600 | $1,700 | $1.06 | 22d | 1 | 0.24mi |
| 229 W Casurina Pl Beverly Hills, FL | 3.0 | 2.0 | 1604 | $1,399 | $0.87 | 22d | 1 | 0.30mi |
| 703 W Sunbird Path Hernando, FL | 2.0 | 2.0 | 1298 | $1,700 | $1.31 | 22d | 1 | 0.34mi |
| 3442 N Tamarisk Ave Unit NA Beverly Hills, FL | 3.0 | 2.0 | 1530 | $1,800 | $1.18 | 22d | 1 | 0.49mi |
| 3660 N Laurelwood Loop Beverly Hills, FL | 2.0 | 2.5 | 1543 | $1,800 | $1.17 | 22d | 1 | 0.63mi |
| 3263 N Maidencane Dr Beverly Hills, FL | 2.0 | 1.0 | 1380 | $1,350 | $0.98 | 22d | 1 | 0.71mi |
| 877 W Silver Meadow Loop Hernando, FL | 3.0 | 2.0 | 1637 | $2,500 | $1.53 | 22d | 1 | 0.90mi |
| 95 S Desoto St Beverly Hills, FL | 2.0 | 2.0 | 1152 | $1,435 | $1.25 | 22d | 1 | 1.00mi |
| 2280 N Hardee Pt Hernando, FL | 2.0 | 2.0 | 1118 | $1,700 | $1.52 | 22d | 1 | 1.08mi |
| 17 N Davis St Beverly Hills, FL | 2.0 | 1.0 | 1108 | $1,000 | $0.90 | 22d | 1 | 1.08mi |
| 1240 W Diamond Shore Loop Hernando, FL | 2.0 | 2.0 | 1770 | $2,900 | $1.64 | 22d | 1 | 1.11mi |
| 23 N Lee St Beverly Hills, FL | 2.0 | 1.0 | 1416 | $1,350 | $0.95 | 22d | 1 | 1.15mi |
| 1281 W Diamond Shore Loop Hernando, FL | 2.0 | 2.0 | 1686 | $3,000 | $1.78 | 22d | 1 | 1.15mi |
| 95 S Fillmore St Beverly Hills, FL | 2.0 | 1.0 | 1056 | $1,300 | $1.23 | 22d | 1 | 1.21mi |
| 42 Roosevelt Blvd Unit 1 Beverly Hills, FL | 3.0 | 1.5 | 1612 | $1,449 | $0.90 | 22d | 1 | 1.22mi |
| 45 S Jackson St Beverly Hills, FL | 2.0 | 1.0 | 1108 | $1,275 | $1.15 | 22d | 1 | 1.31mi |
| 209 S Tyler St Beverly Hills, FL | 2.0 | 2.0 | 1604 | $1,500 | $0.94 | 22d | 1 | 1.33mi |
| 41 S Monroe St Beverly Hills, FL | 2.0 | 1.0 | 932 | $1,300 | $1.39 | 22d | 1 | 1.37mi |
| 1559 N Killebrew Pt Unit NA Hernando, FL | 3.0 | 2.0 | 1771 | $2,900 | $1.64 | 22d | 1 | 1.49mi |
Listing history 9 events
-
2026-05-09status Pending
-
2026-05-05price $199,000
-
2026-04-04$219,000 Active
-
2013-12-31soldstatus $65,000
-
2013-12-19soldstatus $65,000 483-char remark
Show marketing remark (483 chars)
What A Beauty!!! Look at all the updates in this lovely 2/2/1 charmer. new carpet, new windows, new garage door, new hot water heater, new frig, new washer/dryer, new duct work, new front screened porch, new 14 x 13 slab and 11 x12 Screened lanai out back. This owner has taken pride in the house to make it a home. Move in ready. Grab your things and move right in. Close to school and shopping, Private back yard. So call today for your private viewing and come see your new home.
-
2013-08-23$69,900 483-char remark
Show marketing remark (483 chars)
What A Beauty!!! Look at all the updates in this lovely 2/2/1 charmer. new carpet, new windows, new garage door, new hot water heater, new frig, new washer/dryer, new duct work, new front screened porch, new 14 x 13 slab and 11 x12 Screened lanai out back. This owner has taken pride in the house to make it a home. Move in ready. Grab your things and move right in. Close to school and shopping, Private back yard. So call today for your private viewing and come see your new home.
-
2012-07-25soldstatus $60,000 521-char remark
Show marketing remark (521 chars)
Great location for this freshly updated home. Sitting on a beautifully landscaped lot with nothing behind it but land and trees you. Enjoy privacy while still being close to all the amenities. Close to the library, Twisted Oaks Golf Course, shopping, schools and Terra Vista. This charming home has a large living room, kitchen with breakfast nook and a pass through to the family room. Bedrooms are over sized and feature loads of storage and closet space. Come take a look at this one, it's easy to see and shows great.
-
2012-06-04$64,900 521-char remark
Show marketing remark (521 chars)
Great location for this freshly updated home. Sitting on a beautifully landscaped lot with nothing behind it but land and trees you. Enjoy privacy while still being close to all the amenities. Close to the library, Twisted Oaks Golf Course, shopping, schools and Terra Vista. This charming home has a large living room, kitchen with breakfast nook and a pass through to the family room. Bedrooms are over sized and feature loads of storage and closet space. Come take a look at this one, it's easy to see and shows great.
-
1987-02-01soldstatus $70,300
ⓘ Source: listings_history table (triggers on properties + properties_extension) + one-shot
backfill from property_details.listing_events for pre-trigger history.
Tax reassessment forecast FL · Resets to sale price
- Current annual tax
- $1,921 · $160/mo
- Projected year-2 tax
- $1,921 · $160/mo
- Expected delta
- $0/yr ($0/mo · 0.0%)
ⓘ Screening estimate from a state-policy table — verify with the county assessor before closing.
Climate risk First Street
- Flood 10/10 Extreme FEMA zone X (unshaded) · 99% chance over 30 yrs
- Wildfire 5/10 Major
- Heat 9/10 Extreme 7 d/yr ≥108°F today · 24 d/yr by 30 yrs out
- Wind 9/10 Extreme 99% chance of damaging wind over 30 yrs
- Air quality 1/10 Low 0 unhealthy d/yr today · 0 by 30 yrs out
Nearby sold comps map
Loading sold comps map…
Walkable amenities ~0.75 mi
Loading nearby amenities…
Taxation est. · year 1
- Rental income
- $20,121
- − Mortgage interest
- −$11,147
- − Property taxes
- −$1,921
- − Insurance
- −$1,792
- − Repairs & maintenance
- −$1,610
- − Management
- −$1,610
- − Depreciation
- −$5,789
- Taxable loss
- −$3,748
- Est. tax savings @ 24.0%
- +$900
- After-tax cash flow
- $558/yr
For passive investors: Depreciation is non-cash, so a rental often shows a tax loss while cash-flowing — sheltering income. Rental losses are passive: they offset passive income freely, and up to $25,000/yr can offset ordinary (W-2) income if you actively participate and your MAGI is under $100k (phasing out to $0 by $150k); unused losses carry forward. On sale, claimed depreciation is recaptured at up to 25%, and gains may owe capital-gains tax (a 1031 exchange can defer both). Figures are a year-1 estimate at your 24.0% rate — not tax advice; consult a CPA.
Schools (NCES district)
- District
- Citrus
- NCES district ID
- 1200270
- Math proficiency
- 49% ▼ -10.00%
- Reading proficiency
- 50% ▼ -6.00%
- Median HH income
- $38,618
- Composite
- 41.28/100
- National rank
- #3519
- State rank
- #44 of 73 in FL
Livability — Pine Ridge
- Score
- 67/100
- State rank
- #565
- US rank
- #10798
Category grades
Schools grade is shown separately in the Schools card above.
Census & demographics
- Census place
- Pine Ridge, FL
- County
- Citrus County · 111,314 people
- City population
- 18,514
- Metro
- Homosassa Springs, FL
- Population (ZIP)
- 18,879
- Household income
- $54,869
- Rent vs Own
- Severe rent burden
- 334.0
Population outlook (Citrus County) Hauer SSP2
- Today (2025)
- 138,622 people
- By 2030
- 136,886 · -1.3%
- By 2040
- 132,009 · -4.8%
- By 2050
- 125,196 · -9.7%
- By 2075
- 108,570 · -21.7%
- By 2100
- 84,454 · -39.1%
Race, ethnicity, and origin ACS 2023
- Neighborhood character
- Predominantly White (82%)
- Race & ethnicity
- White 82% Hispanic / Latino 8% Black 4% Two or more races 3% Asian 2%
- Hispanic origin (detail)
- Mexican 1% Puerto Rican 3%
- Common ancestry
- Romanian 4% Lithuanian 3% Slovak 2%
- Foreign-born
- 8% · Canada, Vietnam, Dominican Republic
- Languages at home
- 93% English-only · Spanish 4% French/Haitian/Cajun 1% Other Asian/Pacific 1%
Political lean MEDSL · Citrus
- 2024 margin
- Solid R (+45.9) · D 26.8% · R 72.6%
- 2008→2024 swing
- -29.8pp toward R · 2008: -16.1pp · 2024: -45.9pp
- All cycles
- 2024: R+45.9 2020: R+41.0 2016: R+39.7 2012: R+21.9 2008: R+16.1
Not yet ingested
- Civics
- —
Market trends
- HPI YoY
- ▼ -138.62%
- Current HPI
- 279.7183
- Rent YoY
- —
- Metro
- Homosassa Springs, FL
- State GDP YoY
- ▲ 3.28%
- F500 in state
- 36
Industry mix (Fortune 500 HQ in FL)
| Industry | F500 HQs | Revenue |
|---|---|---|
| Industrial Technology | 2 | $29B |
|
||
| Insurance | 2 | $17B |
|
||
| Retail | 1 | $60B |
|
||
| Technology Distribution | 1 | $58B |
|
||
| Homebuilding | 1 | $35B |
|
||
| Technology Manufacturing | 1 | $35B |
|
||
Price history
+183.1% since first listed9 events — show timeline
- 2026-05-09 Pending — RACC
- 2026-05-05 Price Changed $199,000 RACC
- 2026-04-04 Listed $219,000 RACC
- 2013-12-31 Sold (Public Records) $65,000 Public Records
- 2013-12-19 Sold (MLS) $65,000 RACC
- 2013-08-23 Listed $69,900 RACC
- 2012-07-25 Sold (MLS) $60,000 RACC
- 2012-06-04 Listed $64,900 RACC
- 1987-02-01 Sold (Public Records) $70,300 Public Records
Property tax history
+7.0%/yrLatest (2025): $1,921 · +5.5% YoY. Source: county tax records.
Cash-flow waterfall
monthlySold comps — $/sqft
last 12 mo · ≤1 miLoading sold comps…