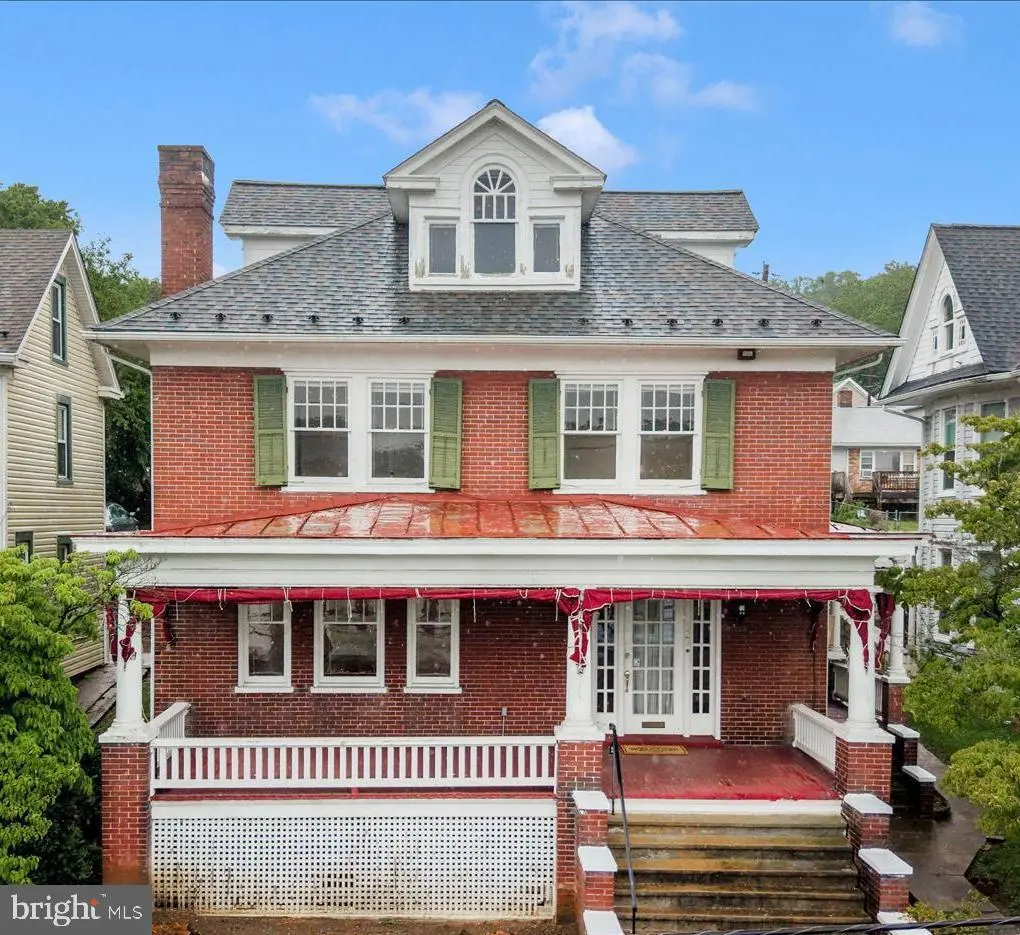
523 W Potomac St · Brunswick, MD
Flood risk 1/10 · Minimal
- FEMA flood zone
- X (unshaded)
- Chance of flooding over 30 yrs
- 0.0%
- Est. flood insurance / yr
- $473 – $860
Fire risk 2/10 · Minimal
- Est. fire insurance / yr
- $755 – $1,403
Heat risk 6/10 · Moderate
- Hot days now (above 103°F)
- 7 days/yr
- Hot days in 30 yrs
- 17 days/yr
Wind risk 3/10 · Minor
- Chance of severe wind over 30 yrs
- 5.0%
Air-quality risk 2/10 · Minimal
- Unhealthy air days now
- 1 days/yr
- Unhealthy air days in 30 yrs
- 2 days/yr
Risk factors via First Street. Map © Google.
Why this score? — see what drove the B- grade
The composite is a weighted blend of 9 inputs, each scored 0–100. Each bar is that input's sub-score; the figure is the points it added to the 100-point composite (weight × sub-score).
- Cash flow +24.7/30.0
- ARV discount +15.0/15.0
- DSCR +8.0/10.0
- 1% rule +6.3/10.0
- Livability +4.0/5.0
- Schools +3.4/10.0
- Rent growth +2.5/5.0
- Condition / age +2.5/5.0
- Appreciation +0.0/10.0
$287,900
🖨 Deal sheet (PDF) 📄 Offer letter ✓ Due diligence
Listing remarks
Don't miss your opportunity to restore this one-of-a-kind all-brick Brunswick Masterpiece back to it's former glory! Experience the majestic feel of this home with its large rooms and high ceilings throughout. Enjoy the hometown feel as you spend cool evenings on the massive front porch 29 x 10 1/2. Enter through the front door to a spacious foyer and hardwood floors throughout. The living room and dining room have large windows that brighten the space. The kitchen comes with a custom breakfast nook, pantry, and its own broom closet. The kitchen walks out to a large rear flagstone patio that allows plenty of space for outdoor dining and grilling. This home features four oversized bedrooms
Key facts
- 5,700 sq ft lot
- 2 parking spots
- Built 1920
Property features AI
Exterior
- Parking: Two driveway parking spaces; On-street parking available; Total of two garage/parking spaces
- Utilities: Public water; Public sewer
- Home design: Detached home; Above-grade and below-grade living areas
- Construction: Brick construction; Concrete perimeter foundation; Built (year sourced from assessor)
- Exterior features: Property is in city limits; No tidal water
Interior
- Kitchen: Kitchen
- Bedrooms: Four bedrooms on the upper level; Bedroom 1; Bedroom 2; Bedroom 3; Bedroom 4
- Bathrooms: One full bathroom (upper level); One half bathroom (main level)
- Heating & cooling: Radiator heating; Oil-fired heating; Electric hot water
- Interior features: Living room; Dining room; Foyer; Breakfast room; Attic; Basement with connecting stairway; One fireplace
- Laundry & utility: Laundry area
Neighborhood map
What this means for you Summary
Snapshot
- This is a 4-bed/1.5-bath single-family listed at $288k.
Deal economics
- At list price, monthly cash flow is $601 ($7k/yr) — positive.
- The deal already cash-flows at list — no discount required.
- Meets the 1% rule at list price ($3k rent vs $288k).
- Recommended offer: $284k (1.5% below list) — sets the bar for market timing.
- Cap rate 8.8% vs local median 3.2% in Brunswick — top-decile yield for the area; either an underpriced asset or a hidden risk that comps aren't pricing in. Stress-test before assuming the spread holds.
Location & tenants
- Location reads 80/100 on livability (#52 in MD, #1,963 nationally) — a professional / high-income tenant draw. Strengths: crime A+, employment A+, housing A+; Watch: amenities C-, commute F.
- Frederick County Public Schools (other): math 27% / reading 43% proficiency, ranked #4 of 24 in MD (top 17%) — families likely to look elsewhere, expect single-tenant / working-renter base with shorter leases.
- Zoned schools: Brunswick Elementary (math 19% / reading 27%, grade F, #289 of 860 statewide, top 34%, 752 students, 28% FRL); Brunswick Middle (math 13% / reading 46%, grade F, #67 of 225 statewide, top 32%, 656 students, 26% FRL); Brunswick High (math 62% / reading 82%, grade B+, #34 of 222 statewide, top 15%, 862 students, 24% FRL).
- Market conditions: 55 active listings in the ZIP; 1 comparable units currently listed for rent nearby; 1,562 units permitted in Frederick County in 2024 (374 in 5+ unit buildings).
Forward outlook
- Local home prices are declining (-3.0%/yr); year-one equity from $2k of loan paydown is wiped out by about $9k of value loss. Plan a longer hold.
- Frederick County population projected at +15% by 2050 — long-run rental-demand tailwind backs the buy-and-hold thesis.
Negotiation context
- It's been on market 23 days — a 2% lower offer ($284k) is reasonable based on typical stale-listing flexibility.
Risks & watch-outs
- Watch-outs: built in 1920 — expect roof / HVAC / electrical / plumbing capex.
- Climate carrying-cost: extreme-heat days projected 7→17/yr by 2055 (HVAC capex compounding) — expect insurance premiums to compound above CPI over the hold.
Questions for the listing agent
- Built in 1920 — when were the roof, HVAC, electrical panel, plumbing, and water heater last replaced?
- Is there a deadline driving the sale (1031 exchange, divorce, estate, relocation)? That informs how much negotiation room exists.
- What's the average days-on-market for RENTAL listings here right now (not sales)? A rising rental-DOM trend means longer vacancies and softer asking-rent achievability than the comps imply.
- What's the recent tenant-quality profile in this submarket — average credit score on applications, eviction rate, late-payment / NSF rate, and stable-employment percentage? A property-management company in the area should have these aggregated.
- How much new for-sale + rental construction is in the pipeline within 1–3 miles? Heavy new supply typically softens prices + rents 12–24 months out; constrained supply supports both.
Investment metrics
- 1% rule
- 1.13% ✓
- Cap rate
- 8.80%
- Cash-on-cash
- 8.94%
- DSCR
- 1.40
- GRM
- 7.4
CMA / ARV
- ARV (on-the-fly)
- $409,530
- Comps found
- 12
Show comp detail 12 sales within ~0.75 mi
| Address | Dist | Beds/Ba | Sqft | Sold | Price | $/sf | Match |
|---|---|---|---|---|---|---|---|
| 22 Virginia Ave | 0.28mi | 3/1.5 (-1) | 1,932 (-12%) | 2mo | $340,000 | $176 | 60 |
| 111 4th Ave | 0.69mi | 3/1.5 (-1) | 2,198 (+0%) | 8mo | $315,000 | $143 | 55 |
| 300 N Delaware Ave | 0.27mi | 4/2.5 | 1,970 (-10%) | 14mo | $489,500 | $248 | 55 |
| 44 E B St | 0.53mi | 3/2.0 (-1) | 2,014 (-8%) | 1mo | $181,250 | $90 | 54 |
| 25 E A St E | 0.46mi | 3/2.5 (-1) | 1,956 (-11%) | 0mo | $355,000 | $181 | 51 |
| 303 W B St | 0.20mi | 3/3.0 (-1) | 1,900 (-13%) | 9mo | $365,000 | $192 | 50 |
| 810 Knoxville Rd | 0.57mi | 3/2.0 (-1) | 1,980 (-10%) | 4mo | $217,000 | $110 | 47 |
| 202 E F St E | 0.74mi | 3/2.5 (-1) | 2,206 (+1%) | 12mo | $390,000 | $177 | 46 |
| 17 Terrace Ave | 0.62mi | 3/3.5 (-1) | 2,056 (-6%) | 10mo | $385,000 | $187 | 40 |
| 31 E B St | 0.51mi | 3/2.5 (-1) | 1,868 (-15%) | 16mo | $370,000 | $198 | 29 |
| 307 E Potomac St | 0.65mi | 4/2.0 | 1,868 (-15%) | 17mo | $355,000 | $190 | 29 |
| 50 E F St | 0.67mi | 3/3.5 (-1) | 2,430 (+11%) | 17mo | $515,000 | $212 | 23 |
Match score weights: distance 35% · size 25% · config 20% · recency 20%. Top-matched comps best support the ARV.
Projected returns pro-forma
-3.0% appreciation · 3.0% rent growth · sell at horizon
- IRR
- -2.8%
- Equity multiple
- 0.90×
- Total profit
- $-8,361
- Equity at exit
- $42,927
- IRR
- 7.0%
- Equity multiple
- 1.52×
- Total profit
- $42,123
- Equity at exit
- $24,892
Cash invested: $80,612 (down + closing). Projections, not guarantees.
Landlord ↔ Tenant lean methodology
- Overall (STATE)
- 27 Tenant-Leaning
- State Maryland
- 27 Tenant-Leaning · D+14
- County
- — inherits STATE
- City
- — inherits STATE
ZIP-level market 21716
- Home prices YoY
- -20.2%
- Active inventory
- 55
- Price-to-rent
- 7.4×
Monthly cashflow live
- Estimated rent
- $3,250 medium interval (Pro) →
- Mortgage (P&I)
- −$1,510
- Tax from tax record
- −$337 /mo · $4,045/yr
- Insurance
- −$120
- HOA
- −$0
- Vacancy / Maint / Mgmt
- −$682
- Net cashflow
- $601
Break-even live
Sensitivity live
| Price | -10% $764 | -5% $682 | +0% $601 | +5% $519 | +10% $438 |
|---|---|---|---|---|---|
| Rent | -10% $344 | -5% $472 | +0% $601 | +5% $729 | +10% $857 |
| Rate | -1.0pp $746 | -0.5pp $674 | base $601 | +0.5pp $526 | +1.0pp $450 |
UW: 25.0% down · 7.5% · 30yr · 1.5% tax · 5.0% vac · 8.0% maint · 8.0% mgmt
Financing live
Cash to close
- Down payment
- $71,975
- Closing costs
- $8,637
- Reserves months
- —
- Total cash needed
- —
Loan-product check · same deal, 3 products live
Conventional
25% down · 7.5% · 30yr
- Down + closing
- —
- Monthly P&I
- —
- Monthly cashflow
- —
- DSCR
- —
- Eligible?
- —
Personal DTI + credit; lowest rate.
DSCR
20% down · 8.5% · 30yr
- Down + closing
- —
- Monthly P&I
- —
- Monthly cashflow
- —
- DSCR
- —
- Eligible?
- —
No personal income docs; deal must DSCR.
Hard money
10% down · 12.0% · 12mo
- Down + closing
- —
- Monthly P&I
- —
- Monthly cashflow
- —
- DSCR
- —
- Eligible?
- —
Short-term bridge; refi at stabilization.
Rent comps 1 comps
| Address | Beds | Baths | Sqft | Rent | $/sqft | DOM | Units | Dist |
|---|---|---|---|---|---|---|---|---|
| 1303 Potomac View Pkwy Brunswick, MD | 3.0 | 3.5 | 2340 | $3,250 | $1.39 | 45d | 1 | 1.21mi |
Listing history 12 events
-
2026-06-21days on market $287,900 Active 23 DOM
-
2026-06-18days on market $287,900 Active 20 DOM
-
2026-06-17days on market $287,900 Active 19 DOM
-
2026-06-16days on market $287,900 Active 18 DOM
-
2026-06-15days on market $287,900 Active 17 DOM
-
2026-06-13days on market $287,900 Active 15 DOM
-
2026-06-13pricedays on market $287,900 Active 14 DOM
-
2026-06-09days on market $339,900 Active 11 DOM
-
2026-06-08days on market $339,900 Active 10 DOM
-
2026-06-07statusdays on market $339,900 Active 9 DOM
-
2026-05-22$339,900 Active
-
2026-05-19historical $339,900
ⓘ Source: listings_history table (triggers on properties + properties_extension) + one-shot
backfill from property_details.listing_events for pre-trigger history.
Tax reassessment forecast MD · Partial reset (capped growth)
- Current annual tax
- $4,045 · $337/mo
- Projected year-2 tax
- $4,045 · $337/mo
- Expected delta
- $0/yr ($0/mo · 0.0%)
ⓘ Screening estimate from a state-policy table — verify with the county assessor before closing.
Climate risk First Street
- Flood 1/10 Low FEMA zone X (unshaded) · 0% chance over 30 yrs
- Wildfire 2/10 Low
- Heat 6/10 Major 7 d/yr ≥103°F today · 17 d/yr by 30 yrs out
- Wind 3/10 Moderate 5% chance of damaging wind over 30 yrs
- Air quality 2/10 Low 1 unhealthy d/yr today · 2 by 30 yrs out
Nearby sold comps map
Loading sold comps map…
Walkable amenities ~0.75 mi
Loading nearby amenities…
Taxation est. · year 1
- Rental income
- $39,000
- − Mortgage interest
- −$16,127
- − Property taxes
- −$4,045
- − Insurance
- −$1,440
- − Repairs & maintenance
- −$3,120
- − Management
- −$3,120
- − Depreciation
- −$8,375
- Taxable income
- $2,773
- Est. tax owed @ 24.0%
- −$666
- After-tax cash flow
- $6,542/yr
For passive investors: Depreciation is non-cash, so a rental often shows a tax loss while cash-flowing — sheltering income. Rental losses are passive: they offset passive income freely, and up to $25,000/yr can offset ordinary (W-2) income if you actively participate and your MAGI is under $100k (phasing out to $0 by $150k); unused losses carry forward. On sale, claimed depreciation is recaptured at up to 25%, and gains may owe capital-gains tax (a 1031 exchange can defer both). Figures are a year-1 estimate at your 24.0% rate — not tax advice; consult a CPA.
Schools (NCES district)
- District
- Frederick County Public Schools
- NCES district ID
- 2400330
- Math proficiency
- 27% ▼ -23.00%
- Reading proficiency
- 43% ▼ -15.00%
- Median HH income
- $84,020
- Composite
- 33.54/100
- National rank
- #5429
- State rank
- #4 of 24 in MD
Livability — Brunswick
- Score
- 80/100
- State rank
- #52
- US rank
- #1963
Category grades
Schools grade is shown separately in the Schools card above.
Census & demographics
- Census place
- Brunswick, MD
- City population
- 6,757
- Population (ZIP)
- 6,757
Population outlook (Frederick County) Hauer SSP2
- Today (2025)
- 269,438 people
- By 2030
- 280,160 · +4.0%
- By 2040
- 298,408 · +10.8%
- By 2050
- 311,062 · +15.4%
- By 2075
- 342,819 · +27.2%
- By 2100
- 351,361 · +30.4%
Race, ethnicity, and origin ACS 2023
- Neighborhood character
- Predominantly White (74%)
- Race & ethnicity
- White 74% Two or more races 14% Hispanic / Latino 10% Black 6% Asian 2%
- Hispanic origin (detail)
- Mexican 2% Puerto Rican 2%
- Common ancestry
- Romanian 3% Italian 2% Serbian 1%
- Foreign-born
- 7% · Canada, South Korea
- Languages at home
- 89% English-only · Spanish 7% Other Indo-European 1% French/Haitian/Cajun 1%
Political lean MEDSL · Frederick
- 2024 margin
- Lean D (+8.8) · D 53.2% · R 44.4% · Other 2.5%
- 2008→2024 swing
- +9.9pp toward D · 2008: -1.0pp · 2024: 8.8pp
- All cycles
- 2024: D+8.8 2020: D+9.6 2016: R+4.0 2012: R+3.9 2008: R+1.0
Not yet ingested
- Civics
- —
Market trends
- HPI YoY
- ▼ -68.83%
- Current HPI
- 271.583
- Rent YoY
- —
- Metro
- —
- State GDP YoY
- ▲ 2.97%
- F500 in state
- 12
Industry mix (Fortune 500 HQ in MD)
| Industry | F500 HQs | Revenue |
|---|---|---|
| Aerospace / Defense | 1 | $71B |
|
||
| Utilities | 1 | $25B |
|
||
| Hotels | 1 | $24B |
|
||
| Consumer Goods | 1 | $7B |
|
||
| Real Estate | 1 | $6B |
|
||
| Chemicals | 1 | $2B |
|
||
Price history
+0.0% since first listed2 events — show timeline
- 2026-05-22 Listed $339,900 BRIGHT MLS
- 2026-05-19 Coming Soon $339,900 BRIGHT MLS
Property tax history
+3.0%/yrLatest (2025): $4,045 · +6.6% YoY. Source: county tax records.
Cash-flow waterfall
monthlySold comps — $/sqft
last 12 mo · ≤1 miLoading sold comps…