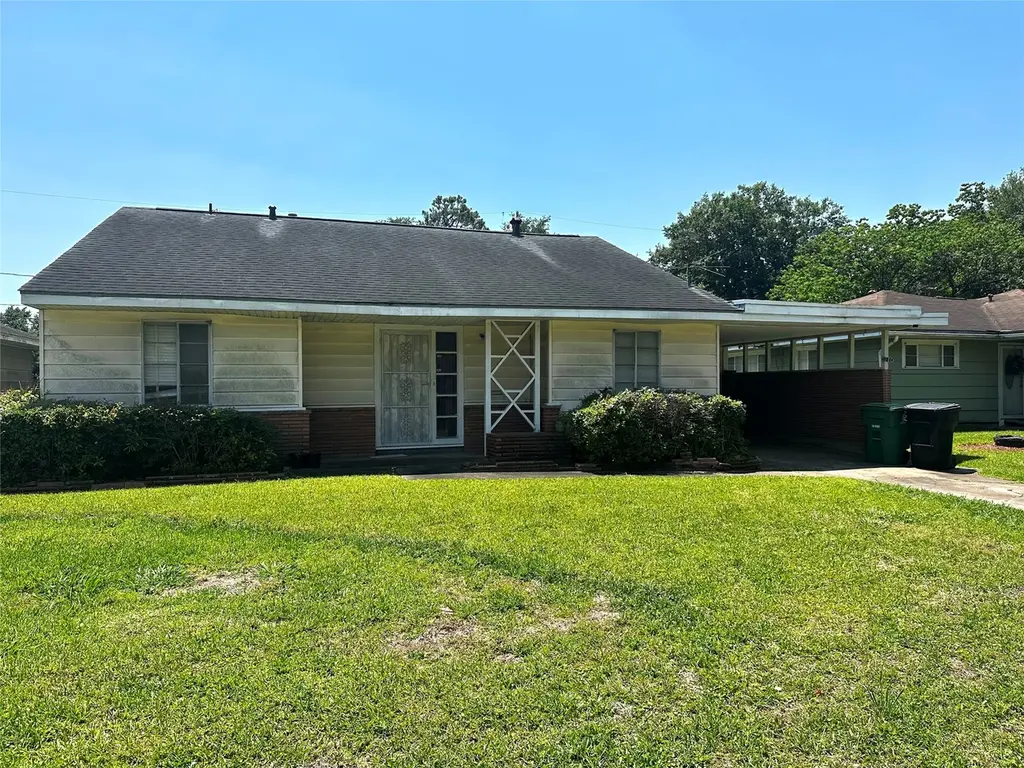
5210 Stuyvesant Ln · Houston, TX
Flood risk 6/10 · Moderate
- FEMA flood zone
- X (unshaded)
- Chance of flooding over 30 yrs
- 0.74%
- Est. flood insurance / yr
- $507 – $1,088
Fire risk 1/10 · Minimal
- Est. fire insurance / yr
- $1,222 – $2,270
Heat risk 9/10 · Severe
- Hot days now (above 109°F)
- 7 days/yr
- Hot days in 30 yrs
- 24 days/yr
Wind risk 9/10 · Severe
- Chance of severe wind over 30 yrs
- 99.0%
Air-quality risk 2/10 · Minimal
- Unhealthy air days now
- 2 days/yr
- Unhealthy air days in 30 yrs
- 2 days/yr
Risk factors via First Street. Map © Google.
Why this score? — see what drove the D- grade
The composite is a weighted blend of 9 inputs, each scored 0–100. Each bar is that input's sub-score; the figure is the points it added to the 100-point composite (weight × sub-score).
- ARV discount +15.0/15.0
- Cash flow +7.1/30.0
- Livability +3.7/5.0
- Rent growth +3.0/5.0
- Schools +2.7/10.0
- 1% rule +2.5/10.0
- Condition / age +2.5/5.0
- DSCR +1.3/10.0
- Appreciation +0.0/10.0
$180,000
🖨 Deal sheet 📄 Offer letter ✓ Due diligence
Key facts
- 8,102 sq ft lot
- Garage
- Community pool
Neighborhood map
What this means for you Summary
Snapshot
- This is a 2-bed/2.0-bath single-family listed at $180k.
Deal economics
- At list price, monthly cash flow is $-256 ($-3k/yr) — negative.
- To cash-flow at today's rent, offer at most $135k (25.1% below list).
- To meet the 1% rule (rent ≥ 1% of price), the offer needs to be $134k (25.4% below list).
- Recommended offer: $134k (25.4% below list) — sets the bar for 1% rule.
- Cap rate 4.6% vs local median 3.2% in Houston — top-decile yield for the area; either an underpriced asset or a hidden risk that comps aren't pricing in. Stress-test before assuming the spread holds.
Location & tenants
- Location reads 74/100 on livability (#184 in TX, #4,771 nationally) — a middle-class / working-renter tenant base. Strengths: amenities A+, cost of living A+, housing A+; Watch: schools D, crime F.
- Houston ISD (urban): math 27% / reading 35% proficiency, ranked #593 of 826 in TX (top 72%) — families likely to look elsewhere, expect single-tenant / working-renter base with shorter leases; 71% free/reduced lunch — lower-income household profile, screen leases tightly.
- Market conditions: Rents rising (+2.2%/yr); 467 active listings in the ZIP; 40 comparable units currently listed for rent nearby; rentals leasing fast (median 14d on market — plan ~1-2 weeks tenant-placement turnaround); 29,883 units permitted in Harris County in 2024 (8,621 in 5+ unit buildings).
- This rent runs 35% of the median local income ($46k/yr) — at the standard rent-burdened threshold; future hikes will face affordability resistance.
Forward outlook
- Local home prices are declining (-3.0%/yr); year-one equity from $1k of loan paydown is wiped out by about $5k of value loss. Plan a longer hold.
- Harris County population projected at +47% by 2050 — long-run rental-demand tailwind backs the buy-and-hold thesis.
Negotiation context
- It's been on market 66 days — a 6% lower offer ($169k) is reasonable based on typical stale-listing flexibility.
- 3 sale attempts with the ask held roughly flat each time — persistent listings suggest the price (not the market) is what's stuck; bring a comps-based counter.
Risks & watch-outs
- Watch-outs: built in 1950 — expect roof / HVAC / electrical / plumbing capex.
- Climate carrying-cost: major flood risk; severe wind risk, 99% chance of damaging wind over 30y; extreme-heat days projected 7→24/yr by 2055 (HVAC capex compounding) — expect insurance premiums to compound above CPI over the hold.
Questions for the listing agent
- What do current leases actually rent for vs. the listed asking? Can we see a recent rent roll and the last 12 months of T-12 income?
- It's been on market 66 days. Have you received any prior offers? Is the seller open to a 25% concession, seller financing, or rate buy-down credit?
- Built in 1950 — when were the roof, HVAC, electrical panel, plumbing, and water heater last replaced?
- Why hasn't it sold? Are there any deal-killer items the seller is aware of (foundation, flood, title, zoning, code violations)?
- Is there a deadline driving the sale (1031 exchange, divorce, estate, relocation)? That informs how much negotiation room exists.
- Schools are D-rated, which usually means shorter tenancies and higher turnover. Who's the typical renter profile here, and what's been the actual vacancy rate?
- Crime grade is F in this area — have there been break-ins, vandalism, or insurance claims at this property in the last 3 years? What carrier currently insures it and at what premium?
- The area grade is low — what's the realistic commute time and amenity access for the typical tenant pool here? Any planned neighborhood developments (good or bad) we should know about?
- What's the average days-on-market for RENTAL listings here right now (not sales)? A rising rental-DOM trend means longer vacancies and softer asking-rent achievability than the comps imply.
- What's the recent tenant-quality profile in this submarket — average credit score on applications, eviction rate, late-payment / NSF rate, and stable-employment percentage? A property-management company in the area should have these aggregated.
- How much new for-sale + rental construction is in the pipeline within 1–3 miles? Heavy new supply typically softens prices + rents 12–24 months out; constrained supply supports both.
Investment metrics
- 1% rule
- 0.75% ✗
- Cap rate
- 4.59%
- Cash-on-cash
- -6.10%
- DSCR
- 0.73
- GRM
- 11.2
CMA / ARV
- ARV (median comp)
- $275,921
- List price
- $180,000
- Delta
- -34.76%
- Verdict
- UNDERPRICED
- Comps
- 20 within 1.0 mi
Show comp detail 12 sales within ~0.75 mi
| Address | Dist | Beds/Ba | Sqft | Sold | Price | $/sf | Match |
|---|---|---|---|---|---|---|---|
| 5118 Cortelyou Ln | 0.14mi | 3/2.0 (+1) | 1,607 (+8%) | 0mo | $169,900 | $106 | 75 |
| 4902 Winfree Dr | 0.55mi | 3/2.0 (+1) | 1,511 (+1%) | 2mo | $169,500 | $112 | 66 |
| 5007 Elizabeth City St | 0.25mi | 3/2.5 (+1) | 1,643 (+10%) | 2mo | $253,510 | $154 | 63 |
| 5003 Elizabeth City St | 0.26mi | 3/2.5 (+1) | 1,643 (+10%) | 1mo | $268,388 | $163 | 63 |
| 5005 Elizabeth City St | 0.25mi | 3/2.5 (+1) | 1,643 (+10%) | 2mo | $253,510 | $154 | 62 |
| 5002 Elizabeth City St | 0.25mi | 3/2.5 (+1) | 1,643 (+10%) | 2mo | $277,884 | $169 | 62 |
| 4826 Culmore Dr | 0.63mi | 3/2.0 (+1) | 1,501 (+1%) | 3mo | $279,000 | $186 | 62 |
| 5003 Yesenia Palm St | 0.28mi | 3/2.5 (+1) | 1,643 (+10%) | 3mo | $282,882 | $172 | 61 |
| 4826 Ventura Ln | 0.49mi | 3/2.0 (+1) | 1,268 (-15%) | 2mo | $259,900 | $205 | 46 |
| 4755 Marietta Ln | 0.62mi | 3/1.0 (+1) | 1,628 (+9%) | 3mo | $150,000 | $92 | 45 |
| 2950 Pitzlin St | 0.70mi | 3/3.0 (+1) | 1,671 (+12%) | 0mo | $339,900 | $203 | 38 |
| 2948 Pitzlin St | 0.70mi | 3/3.0 (+1) | 1,671 (+12%) | 2mo | $329,000 | $197 | 37 |
Match score weights: distance 35% · size 25% · config 20% · recency 20%. Top-matched comps best support the ARV.
Projected returns pro-forma
-3.0% appreciation · 2.17% rent growth · sell at horizon
- IRR
- -27.7%
- Equity multiple
- 0.08×
- Total profit
- $-46,528
- Equity at exit
- $26,839
- IRR
- -29.6%
- Equity multiple
- -0.30×
- Total profit
- $-65,744
- Equity at exit
- $15,563
Cash invested: $50,400 (down + closing). Projections, not guarantees.
Landlord ↔ Tenant lean methodology
- Overall (STATE)
- 87 Strongly Landlord-Friendly
- State Texas
- 87 Strongly Landlord-Friendly · R+5
- County
- — inherits STATE
- City
- — inherits STATE
ZIP-level market 77021
- Home prices YoY
- -23.6%
- Rents YoY
- 2.2%
- Active inventory
- 467
- Price-to-rent
- 11.2×
Monthly cashflow live
- Estimated rent
- $1,342 high interval (Pro) →
- Mortgage (P&I)
- −$944
- Tax from tax record
- −$297 /mo · $3,570/yr
- Insurance
- −$75
- HOA
- −$0
- Vacancy / Maint / Mgmt
- −$282
- Net cashflow
- $-256
Break-even live
UW: 25.0% down · 7.5% · 30yr · 1.5% tax · 5.0% vac · 8.0% maint · 8.0% mgmt
Financing live
Cash to close
- Down payment
- $45,000
- Closing costs
- $5,400
- Reserves months
- —
- Total cash needed
- —
Loan-product check · same deal, 3 products live
Conventional
25% down · 7.5% · 30yr
- Down + closing
- —
- Monthly P&I
- —
- Monthly cashflow
- —
- DSCR
- —
- Eligible?
- —
Personal DTI + credit; lowest rate.
DSCR
20% down · 8.5% · 30yr
- Down + closing
- —
- Monthly P&I
- —
- Monthly cashflow
- —
- DSCR
- —
- Eligible?
- —
No personal income docs; deal must DSCR.
Hard money
10% down · 12.0% · 12mo
- Down + closing
- —
- Monthly P&I
- —
- Monthly cashflow
- —
- DSCR
- —
- Eligible?
- —
Short-term bridge; refi at stabilization.
Rent comps 40 comps
| Address | Beds | Baths | Sqft | Rent | $/sqft | DOM | Units | Dist |
|---|---|---|---|---|---|---|---|---|
| 5610 Royal Palms St Houston, TX | 2.0 | 1.0 | 900 | $950 | $1.06 | 24d | 1 | 0.24mi |
| 5101 Martin Luther King Blvd Unit MO54 Houston, TX | 2.0 | 2.0 | 1322 | $1,210 | $0.92 | 12d | 1 | 0.30mi |
| 5154 Griggs Rd Unit CAVE Houston, TX | 2.0 | 2.0 | 1322 | $1,420 | $1.07 | 3d | 1 | 0.36mi |
| 5116 Griggs Rd Houston, TX | 3.0 | 2.0 | 1131 | $1,316 | $1.16 | 43d | 1 | 0.40mi |
| 5520 Griggs Rd Houston, TX | 2.0 | 2.0 | 1322 | $1,241 | $0.94 | 22d | 1 | 0.41mi |
| 5520 Griggs Rd Houston, TX | 1.0 | 1.0 | 1003 | $1,030 | $1.03 | 24d | 1 | 0.41mi |
| 5520 Griggs Rd Houston, TX | 2.0 | 2.0 | 1322 | $1,241 | $0.94 | 43d | 1 | 0.41mi |
| 5514 Griggs Rd Unit 1047 Houston, TX | 1.0 | 1.0 | 1003 | $1,005 | $1.00 | 11d | 1 | 0.42mi |
| 5514 Griggs Rd Unit 2047 Houston, TX | 2.0 | 2.0 | 1322 | $1,225 | $0.93 | 11d | 1 | 0.42mi |
| 5514 Griggs Rd Unit 2047 Houston, TX | 2.0 | 2.0 | 1322 | $1,214 | $0.92 | 3d | 1 | 0.42mi |
| 4943 Culmore Dr Houston, TX | 1.0 | 1.0 | 1700 | $651 | $0.38 | 5d | 1 | 0.46mi |
| 5514 Griggs Rd Houston, TX | 2.0 | 2.0 | 1322 | $1,210 | $0.92 | 43d | 1 | 0.48mi |
| 5514 Griggs Rd Houston, TX | 1.0 | 1.0 | 1003 | $935 | $0.93 | 13d | 1 | 0.48mi |
| 5514 Griggs Rd Unit 324 Houston, TX | 1.0 | 1.0 | 1003 | $965 | $0.96 | 7d | 1 | 0.49mi |
| 5514 Griggs Rd Unit 422 Houston, TX | 2.0 | 2.0 | 1322 | $1,190 | $0.90 | 7d | 1 | 0.49mi |
| 5514 Griggs Rd Unit 2162 Houston, TX | 2.0 | 2.0 | 1322 | $1,190 | $0.90 | 5d | 1 | 0.49mi |
| 5514 Griggs Rd Unit 1162 Houston, TX | 1.0 | 1.0 | 1003 | $965 | $0.96 | 5d | 1 | 0.49mi |
| 5514 Griggs Rd Unit 5565 Houston, TX | 1.0 | 1.0 | 1003 | $935 | $0.93 | 43d | 1 | 0.49mi |
| 5514 Griggs Rd Unit 5571 Houston, TX | 2.0 | 2.0 | 1322 | $1,214 | $0.92 | 10d | 1 | 0.49mi |
| 5514 Griggs Rd Unit 5535 Houston, TX | 1.0 | 1.0 | 1003 | $1,004 | $1.00 | 10d | 1 | 0.49mi |
| 5514 Griggs Rd Unit 5535 Houston, TX | 1.0 | 1.0 | 1003 | $940 | $0.94 | 13d | 1 | 0.49mi |
| 5514 Griggs Rd Unit 2187 Houston, TX | 2.0 | 2.0 | 1322 | $1,182 | $0.89 | 2d | 1 | 0.49mi |
| 5514 Griggs Rd Unit 1165 Houston, TX | 1.0 | 1.0 | 1003 | $962 | $0.96 | 2d | 1 | 0.49mi |
| 4907 Marietta Ln Unit 1494902P Houston, TX | 3.0 | 2.0 | 1593 | $3,278 | $2.06 | 13d | 1 | 0.50mi |
| 5924 Schroeder Rd Houston, TX | 2.0 | 1.0 | 900 | $895 | $0.99 | 43d | 1 | 0.64mi |
| 5924 Schroeder Rd Houston, TX | 2.0 | 1.0 | 900 | $895 | $0.99 | 22d | 1 | 0.64mi |
| 5918 Schroeder Rd Houston, TX | 1.0–2.0 | 1.0 | 850 | $1,000 | $1.18 | 43d | 1 | 0.64mi |
| 4722 Old Spanish Trl Unit B301 Houston, TX | 2.0 | 2.0 | 1027 | $1,695 | $1.65 | 44d | 1 | 0.73mi |
| 5835 Southmont St Houston, TX | 3.0 | 2.0 | 1200 | $1,700 | $1.42 | 43d | 1 | 1.00mi |
| 4515 Dewberry St Houston, TX | 1.0 | 1.0 | 1400 | $664 | $0.47 | 20d | 1 | 1.07mi |
| 6528 Weston St Unit A Houston, TX | 3.0 | 3.0 | 1484 | $2,200 | $1.48 | 43d | 1 | 1.09mi |
| 6532 Weston St Unit A Houston, TX | 3.0 | 3.0 | 1484 | $2,200 | $1.48 | 18d | 1 | 1.10mi |
| 5537 Bataan Rd Houston, TX | 2.0 | 1.0 | 880 | $1,300 | $1.48 | 43d | 1 | 1.12mi |
| 5813 England St Unit A Houston, TX | 3.0 | 2.5 | 1473 | $2,195 | $1.49 | 4d | 1 | 1.23mi |
| 3852 Telephone Rd Houston, TX | 1.0–3.0 | 1.0–2.0 | 911 | $1,308 | $1.43 | 1d | 19 | 1.26mi |
| 5317 Chennault Rd Unit A Houston, TX | 3.0 | 2.5 | 1608 | $1,999 | $1.24 | 43d | 1 | 1.30mi |
| 3810 Weslow St Unit B Houston, TX | 2.0 | 1.0 | 924 | $1,149 | $1.24 | 7d | 1 | 1.35mi |
| 3810 Weslow St Houston, TX | 2.0 | 1.0 | 924 | $1,449 | $1.57 | 43d | 1 | 1.35mi |
| 3810 Weslow St Unit A Houston, TX | 3.0 | 2.0 | 1517 | $1,399 | $0.92 | 2d | 1 | 1.35mi |
| 4705 Idaho St Houston, TX | 3.0 | 2.5 | 1664 | $2,500 | $1.50 | 17d | 1 | 1.47mi |
Listing history 18 events
-
2026-06-18days on market $180,000 Active 66 DOM
-
2026-06-17days on market $180,000 Active 65 DOM
-
2026-06-16days on market $180,000 Active 64 DOM
-
2026-06-15days on market $180,000 Active 63 DOM
-
2026-06-13days on market $180,000 Active 61 DOM
-
2026-06-10days on market $180,000 Active 57 DOM
-
2026-06-08days on market $180,000 Active 56 DOM
-
2026-06-07days on market $180,000 Active 55 DOM
-
2026-06-04days on market $180,000 Active 52 DOM
-
2026-06-01days on market $180,000 Active 49 DOM
-
2026-05-31days on market $180,000 Active 48 DOM
-
2026-05-02status Active
-
2026-04-27status Pending
-
2026-04-09$180,000 Active
-
2026-02-09$1,600
-
2007-02-20soldstatus
-
2005-02-02soldstatus
-
1997-08-08soldstatus
ⓘ Source: listings_history table (triggers on properties + properties_extension) + one-shot
backfill from property_details.listing_events for pre-trigger history.
Tax reassessment forecast TX · Resets to sale price
- Current annual tax
- $3,570 · $297/mo
- Projected year-2 tax
- $3,570 · $297/mo
- Expected delta
- $0/yr ($0/mo · 0.0%)
ⓘ Screening estimate from a state-policy table — verify with the county assessor before closing.
Climate risk First Street
- Flood 6/10 Major FEMA zone X (unshaded) · 74% chance over 30 yrs
- Wildfire 1/10 Low
- Heat 9/10 Extreme 7 d/yr ≥109°F today · 24 d/yr by 30 yrs out
- Wind 9/10 Extreme 99% chance of damaging wind over 30 yrs
- Air quality 2/10 Low 2 unhealthy d/yr today · 2 by 30 yrs out
Nearby sold comps map
Loading sold comps map…
Walkable amenities ~0.75 mi
Loading nearby amenities…
Taxation est. · year 1
- Rental income
- $16,106
- − Mortgage interest
- −$10,083
- − Property taxes
- −$3,570
- − Insurance
- −$900
- − Repairs & maintenance
- −$1,288
- − Management
- −$1,288
- − Depreciation
- −$5,236
- Taxable loss
- −$6,260
- Est. tax savings @ 24.0%
- +$1,502
- After-tax cash flow
- $-1,571/yr
For passive investors: Depreciation is non-cash, so a rental often shows a tax loss while cash-flowing — sheltering income. Rental losses are passive: they offset passive income freely, and up to $25,000/yr can offset ordinary (W-2) income if you actively participate and your MAGI is under $100k (phasing out to $0 by $150k); unused losses carry forward. On sale, claimed depreciation is recaptured at up to 25%, and gains may owe capital-gains tax (a 1031 exchange can defer both). Figures are a year-1 estimate at your 24.0% rate — not tax advice; consult a CPA.
Schools (NCES district)
- District
- Houston ISD
- NCES district ID
- 4823640
- Math proficiency
- 27% ▼ -18.00%
- Reading proficiency
- 35% ▼ -6.00%
- Median HH income
- $46,054
- Composite
- 26.63/100
- National rank
- #7173
- State rank
- #593 of 826 in TX
Livability — Houston
- Score
- 74/100
- State rank
- #184
- US rank
- #4771
Category grades
Schools grade is shown separately in the Schools card above.
Census & demographics
- Census place
- Houston, TX
- County
- Harris County · 4,702,590 people
- City population
- 3,226,434
- Metro
- Houston-The Woodlands-Sugar Land, TX
- Population (ZIP)
- 26,153
- Household income
- $45,574
- Rent vs Own
- Severe rent burden
- 2532.0
Population outlook (Harris County) Hauer SSP2
- Today (2025)
- 5,571,493 people
- By 2030
- 6,089,821 · +9.3%
- By 2040
- 7,142,806 · +28.2%
- By 2050
- 8,185,864 · +46.9%
- By 2075
- 10,574,329 · +89.8%
- By 2100
- 12,109,958 · +117.4%
Race, ethnicity, and origin ACS 2023
- Neighborhood character
- Diverse neighborhood (Simpson 0.55)
- Race & ethnicity
- Black 62% Hispanic / Latino 22% Two or more races 12% White 10% Asian 2%
- Hispanic origin (detail)
- Mexican 15%
- Common ancestry
- Italian 1% Romanian 1% Lithuanian 1%
- Foreign-born
- 11% · Canada
- Languages at home
- 77% English-only · Spanish 19% French/Haitian/Cajun 1% Other Indo-European 1%
Political lean MEDSL · Harris
- 2024 margin
- Lean D (+5.5) · D 52.0% · R 46.4% · Other 1.6%
- 2008→2024 swing
- +3.9pp toward D · 2008: 1.6pp · 2024: 5.5pp
- All cycles
- 2024: D+5.5 2020: D+13.3 2016: D+12.4 2012: D+0.1 2008: D+1.6
Not yet ingested
- Civics
- —
Market trends
- HPI YoY
- ▼ -71.22%
- Current HPI
- 230.2869
- Rent YoY
- ▲ 2.17%
- Metro
- Houston-The Woodlands-Sugar Land, TX
- State GDP YoY
- ▲ 3.95%
- F500 in state
- 110
Industry mix (Fortune 500 HQ in TX)
| Industry | F500 HQs | Revenue |
|---|---|---|
| Energy | 16 | $1,198B |
|
||
| Technology | 5 | $198B |
|
||
| Engineering / Construction | 4 | $72B |
|
||
| Energy Services | 3 | $60B |
|
||
| Utilities | 3 | $41B |
|
||
| Healthcare | 2 | $330B |
|
||
Price history
+11150.0% since first listed7 events — show timeline
- 2026-05-02 Relisted — HARMLS
- 2026-04-27 Pending — HARMLS
- 2026-04-09 Listed $180,000 HARMLS
- 2026-02-09 Listed for Rent $1,600 HARMLS
- 2007-02-20 Sold (Public Records) — Public Records
- 2005-02-02 Sold (Public Records) — Public Records
- 1997-08-08 Sold (Public Records) — Public Records
Property tax history
+5.6%/yrLatest (2025): $3,570 · +0.7% YoY. Source: county tax records.
Cash-flow waterfall
monthlySold comps — $/sqft
last 12 mo · ≤1 miLoading sold comps…