1121 Meadowlark Ln · Centralia, IL
Flood risk 1/10 · Minimal
- FEMA flood zone
- X (unshaded)
- Chance of flooding over 30 yrs
- 0.0%
- Est. flood insurance / yr
- $473 – $860
Fire risk 1/10 · Minimal
- Est. fire insurance / yr
- $804 – $1,492
Heat risk 4/10 · Minor
- Hot days now (above 106°F)
- 7 days/yr
- Hot days in 30 yrs
- 20 days/yr
Wind risk 2/10 · Minimal
- Chance of severe wind over 30 yrs
- 3.0%
Air-quality risk 2/10 · Minimal
- Unhealthy air days now
- 1 days/yr
- Unhealthy air days in 30 yrs
- 1 days/yr
Risk factors via First Street. Map © Google.
Why this score? — see what drove the C+ grade
The composite is a weighted blend of 9 inputs, each scored 0–100. Each bar is that input's sub-score; the figure is the points it added to the 100-point composite (weight × sub-score).
- Cash flow +27.8/30.0
- DSCR +9.8/10.0
- 1% rule +8.6/10.0
- ARV discount +7.5/15.0
- Livability +3.4/5.0
- Rent growth +2.5/5.0
- Condition / age +2.5/5.0
- Schools +2.2/10.0
- Appreciation +0.0/10.0
$99,000
🖨 Deal sheet 📄 Offer letter ✓ Due diligence
Listing remarks
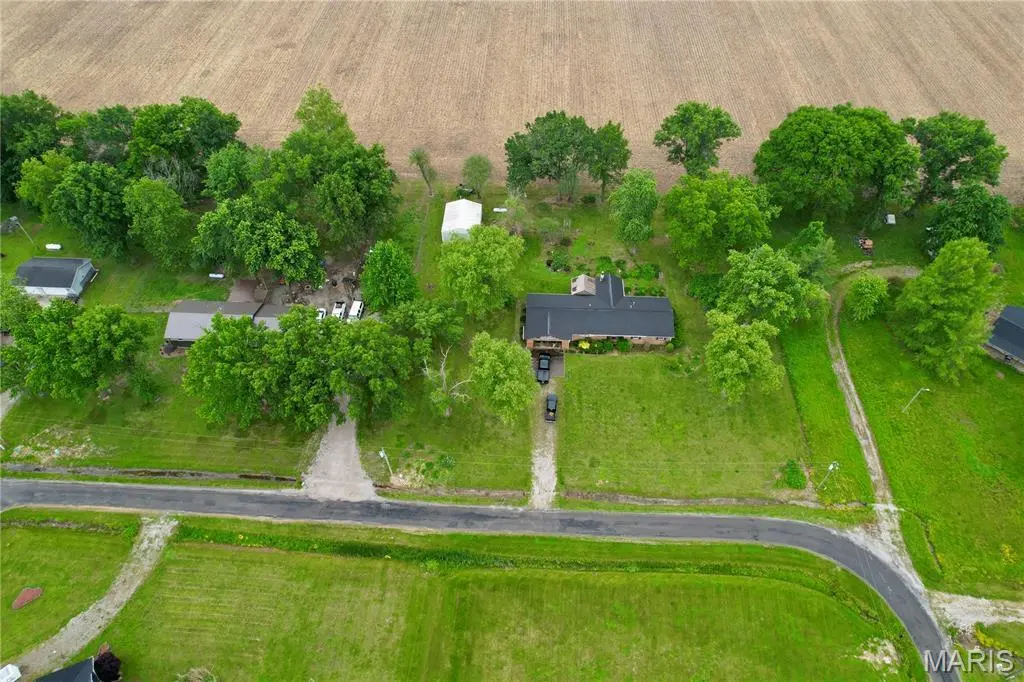
Escape to the peace and privacy of the countryside with this charming 3-bedroom, 2-bath home located just east of Centralia, Illinois. Nestled on a spacious setting with room to grow, this property offers endless potential for those looking to create their dream home in a quiet rural setting. Step inside to find a functional layout with generous living spaces, a large kitchen ready for your personal touch, and comfortable bedrooms filled with natural light. The home provides a solid foundation with plenty of opportunity to update, renovate, or customize to your style. Outside, enjoy wide-open views, fresh country air, and ample space for gardening, recreation, or even a small hobby farm. Wh
Key facts
- Spacious setting
- Natural light
- Large kitchen
Tags
Property features AI
Finance
- Other: Approximately 1.06-acre lot
Exterior
- Parking: 2-car garage
- Utilities: Public water; Septic tank sewer; Electricity connected
- Home design: Single-family residence; One story
- Construction: Brick and wood siding exterior
- Exterior features: Back yard; Front yard; Agricultural/farm-friendly lot
Interior
- Bedrooms: Three bedrooms on the main level
- Bathrooms: Two full bathrooms on the main level
- Heating & cooling: Forced air heat; Central air conditioning
- Interior features: Fireplace in the den; Central air
Neighborhood map
What this means for you Summary
Snapshot
- This is a 3-bed/2.0-bath single-family listed at $99k.
Deal economics
- At list price, monthly cash flow is $301 ($4k/yr) — positive.
- The deal already cash-flows at list — no discount required.
- Meets the 1% rule at list price ($1k rent vs $99k).
- Cap rate 9.9% vs local median 5.8% in Centralia — top-decile yield for the area; either an underpriced asset or a hidden risk that comps aren't pricing in. Stress-test before assuming the spread holds.
Location & tenants
- Location reads 68/100 on livability (#481 in IL) — a middle-class / working-renter tenant base. Strengths: cost of living A+, housing A+, health & safety A+; Watch: crime F, amenities F, commute F.
- Centralia Hsd 200 (town): math 21% / reading 26% proficiency, ranked #668 of 919 in IL (top 73%) — low school quality limits family demand, transient renter base, plan for 1-2y turnover.
- Zoned schools: Centralia High School (math 22% / reading 17%, grade F, #397 of 693 statewide, top 61%, 863 students, 0% FRL).
- Market conditions: 99 active listings in the ZIP; 2 units permitted in Marion County in 2024 (0 in 5+ unit buildings).
Forward outlook
- Local home prices are declining (-3.0%/yr); year-one equity from $684 of loan paydown is wiped out by about $3k of value loss. Plan a longer hold.
- Marion County population projected at -20% by 2050 — secular population decline; favor cash flow + early exit over multi-decade hold.
- At projected returns (-3.0% appreciation + 3.0% rent growth), your $28k cash investment doubles in ~9 years — after that, you're playing with house money.
Negotiation context
- Only 5 days on market — expect competitive offers; lowballing is unlikely to land.
Questions for the listing agent
- Built in 1976 — when were the roof, HVAC, electrical panel, plumbing, and water heater last replaced?
- Is there a deadline driving the sale (1031 exchange, divorce, estate, relocation)? That informs how much negotiation room exists.
- Schools are D-rated, which usually means shorter tenancies and higher turnover. Who's the typical renter profile here, and what's been the actual vacancy rate?
- Crime grade is F in this area — have there been break-ins, vandalism, or insurance claims at this property in the last 3 years? What carrier currently insures it and at what premium?
- What's the average days-on-market for RENTAL listings here right now (not sales)? A rising rental-DOM trend means longer vacancies and softer asking-rent achievability than the comps imply.
- What's the recent tenant-quality profile in this submarket — average credit score on applications, eviction rate, late-payment / NSF rate, and stable-employment percentage? A property-management company in the area should have these aggregated.
- How much new for-sale + rental construction is in the pipeline within 1–3 miles? Heavy new supply typically softens prices + rents 12–24 months out; constrained supply supports both.
Investment metrics
- 1% rule
- 1.36% ✓
- Cap rate
- 9.94%
- Cash-on-cash
- 13.01%
- DSCR
- 1.58
- GRM
- 6.1
CMA / ARV
- ARV (on-the-fly)
- $268,830
- Comps found
- 2
Show comp detail 2 sales within ~0.75 mi
| Address | Dist | Beds/Ba | Sqft | Sold | Price | $/sf | Match |
|---|---|---|---|---|---|---|---|
| 1670 Patriot Rd | 0.12mi | 3/2.0 | 1,598 (-14%) | 12mo | $231,000 | $145 | 61 |
| 1600 Patriot Rd | 0.41mi | 3/2.0 | 1,700 (-8%) | 15mo | $34,200 | $20 | 54 |
Match score weights: distance 35% · size 25% · config 20% · recency 20%. Top-matched comps best support the ARV.
Projected returns pro-forma
-3.0% appreciation · 3.0% rent growth · sell at horizon
- IRR
- 3.0%
- Equity multiple
- 1.11×
- Total profit
- $3,173
- Equity at exit
- $14,761
- IRR
- 12.6%
- Equity multiple
- 2.00×
- Total profit
- $27,698
- Equity at exit
- $8,560
Cash invested: $27,720 (down + closing). Projections, not guarantees.
Landlord ↔ Tenant lean methodology
- Overall (STATE)
- 43 Moderately Tenant-Leaning
- State Illinois
- 43 Moderately Tenant-Leaning · D+7
- County
- — inherits STATE
- City
- — inherits STATE
ZIP-level market 62801
- Home prices YoY
- -13.9%
- Active inventory
- 99
- Price-to-rent
- 6.1×
Monthly cashflow live
- Estimated rent
- $1,347 medium interval (Pro) →
- Mortgage (P&I)
- −$519
- Tax from tax record
- −$203 /mo · $2,440/yr
- Insurance
- −$41
- HOA
- −$0
- Vacancy / Maint / Mgmt
- −$283
- Net cashflow
- $301
Break-even live
UW: 25.0% down · 7.5% · 30yr · 1.5% tax · 5.0% vac · 8.0% maint · 8.0% mgmt
Financing live
Cash to close
- Down payment
- $24,750
- Closing costs
- $2,970
- Reserves months
- —
- Total cash needed
- —
Loan-product check · same deal, 3 products live
Conventional
25% down · 7.5% · 30yr
- Down + closing
- —
- Monthly P&I
- —
- Monthly cashflow
- —
- DSCR
- —
- Eligible?
- —
Personal DTI + credit; lowest rate.
DSCR
20% down · 8.5% · 30yr
- Down + closing
- —
- Monthly P&I
- —
- Monthly cashflow
- —
- DSCR
- —
- Eligible?
- —
No personal income docs; deal must DSCR.
Hard money
10% down · 12.0% · 12mo
- Down + closing
- —
- Monthly P&I
- —
- Monthly cashflow
- —
- DSCR
- —
- Eligible?
- —
Short-term bridge; refi at stabilization.
Listing history 2 events
-
2026-05-22status Pending
-
2026-05-17$99,000 Active
ⓘ Source: listings_history table (triggers on properties + properties_extension) + one-shot
backfill from property_details.listing_events for pre-trigger history.
Tax reassessment forecast IL · Partial reset (capped growth)
- Current annual tax
- $2,440 · $203/mo
- Projected year-2 tax
- $2,440 · $203/mo
- Expected delta
- $0/yr ($0/mo · 0.0%)
ⓘ Screening estimate from a state-policy table — verify with the county assessor before closing.
Climate risk First Street
- Flood 1/10 Low FEMA zone X (unshaded) · 0% chance over 30 yrs
- Wildfire 1/10 Low
- Heat 4/10 Moderate 7 d/yr ≥106°F today · 20 d/yr by 30 yrs out
- Wind 2/10 Low 3% chance of damaging wind over 30 yrs
- Air quality 2/10 Low 1 unhealthy d/yr today · 1 by 30 yrs out
Nearby sold comps map
Loading sold comps map…
Walkable amenities ~0.75 mi
Loading nearby amenities…
Taxation est. · year 1
- Rental income
- $16,168
- − Mortgage interest
- −$5,546
- − Property taxes
- −$2,440
- − Insurance
- −$495
- − Repairs & maintenance
- −$1,293
- − Management
- −$1,293
- − Depreciation
- −$2,880
- Taxable income
- $2,220
- Est. tax owed @ 24.0%
- −$533
- After-tax cash flow
- $3,074/yr
For passive investors: Depreciation is non-cash, so a rental often shows a tax loss while cash-flowing — sheltering income. Rental losses are passive: they offset passive income freely, and up to $25,000/yr can offset ordinary (W-2) income if you actively participate and your MAGI is under $100k (phasing out to $0 by $150k); unused losses carry forward. On sale, claimed depreciation is recaptured at up to 25%, and gains may owe capital-gains tax (a 1031 exchange can defer both). Figures are a year-1 estimate at your 24.0% rate — not tax advice; consult a CPA.
Schools (NCES district)
- District
- Centralia Hsd 200
- NCES district ID
- 1709300
- Math proficiency
- 21% ▲ 6.00%
- Reading proficiency
- 26% ▲ 1.00%
- Median HH income
- $34,555
- Composite
- 22.43/100
- National rank
- #13470
- State rank
- #668 of 919 in IL
Livability — Centralia
- Score
- 68/100
- State rank
- #481
- US rank
- #9987
Category grades
Schools grade is shown separately in the Schools card above.
Census & demographics
- City population
- 19,941
- Population (ZIP)
- 19,941
Population outlook (Marion County) Hauer SSP2
- Today (2025)
- 36,071 people
- By 2030
- 34,598 · -4.1%
- By 2040
- 31,754 · -12.0%
- By 2050
- 28,912 · -19.8%
- By 2075
- 22,527 · -37.5%
- By 2100
- 16,455 · -54.4%
Race, ethnicity, and origin ACS 2023
- Neighborhood character
- Predominantly White (81%)
- Race & ethnicity
- White 81% Black 11% Two or more races 4% Hispanic / Latino 4% Asian 1%
- Common ancestry
- Serbian 2% Romanian 2% Lithuanian 1%
- Foreign-born
- 3% · Canada, China
- Languages at home
- 96% English-only · Spanish 2%
Political lean MEDSL · Marion
- 2024 margin
- Solid R (+49.5) · D 24.6% · R 74.1% · Other 1.4%
- 2008→2024 swing
- -47.5pp toward R · 2008: -2.0pp · 2024: -49.5pp
- All cycles
- 2024: R+49.5 2020: R+46.6 2016: R+44.9 2012: R+19.2 2008: R+2.0
Not yet ingested
- Civics
- —
Market trends
- HPI YoY
- ▼ -34.12%
- Current HPI
- 211.3835
- Rent YoY
- —
- Metro
- —
- State GDP YoY
- ▲ 1.59%
- F500 in state
- 60
Industry mix (Fortune 500 HQ in IL)
| Industry | F500 HQs | Revenue |
|---|---|---|
| Insurance | 4 | $201B |
|
||
| Consumer Goods | 4 | $87B |
|
||
| Industrial Machinery | 3 | $64B |
|
||
| Healthcare | 2 | $55B |
|
||
| Retail / Pharmacy | 1 | $148B |
|
||
| Agriculture / Food | 1 | $86B |
|
||
Price history
2 events — show timeline
- 2026-05-22 Pending — MARIS as Distributed by MLS Grid
- 2026-05-17 Listed $99,000 MARIS as Distributed by MLS Grid
Property tax history
+2.0%/yrLatest (2024): $2,440 · -0.5% YoY. Source: county tax records.
Cash-flow waterfall
monthlySold comps — $/sqft
last 12 mo · ≤1 miLoading sold comps…