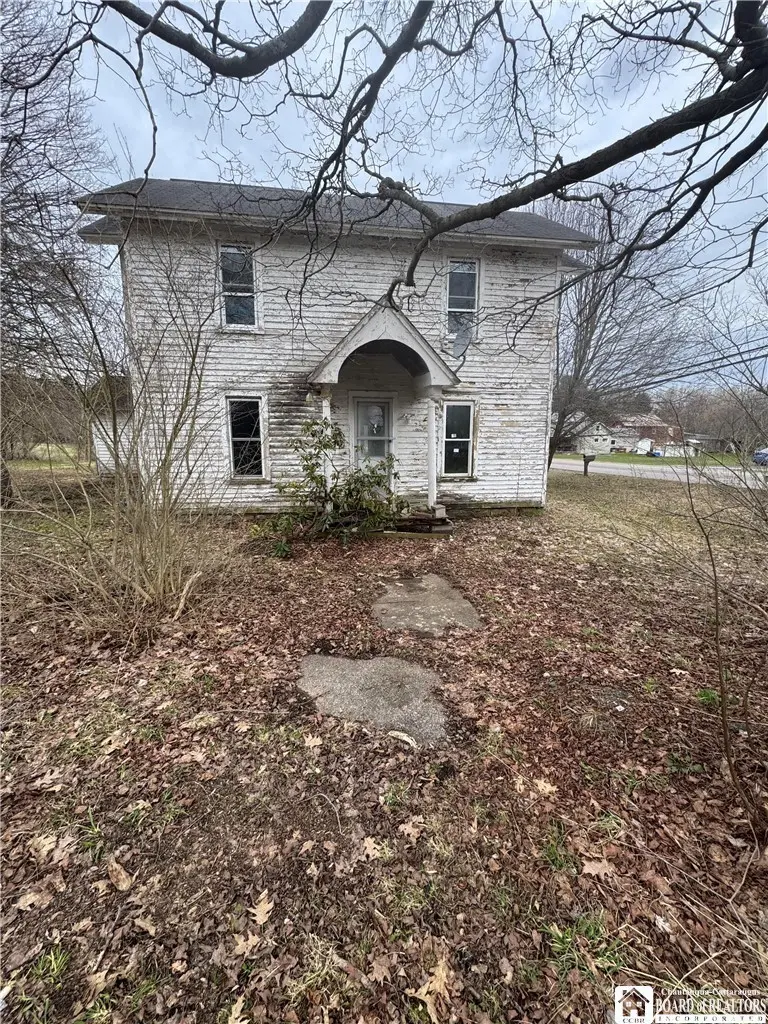
170 Park St · Sherman, NY
Flood risk 1/10 · Minimal
- FEMA flood zone
- X
- Chance of flooding over 30 yrs
- 0.0%
- Est. flood insurance / yr
- $473 – $860
Fire risk 2/10 · Minimal
- Est. fire insurance / yr
- $691 – $1,283
Heat risk 1/10 · Minimal
- Hot days now (above 89°F)
- 7 days/yr
- Hot days in 30 yrs
- 17 days/yr
Wind risk 1/10 · Minimal
- Chance of severe wind over 30 yrs
- —
Air-quality risk 2/10 · Minimal
- Unhealthy air days now
- 1 days/yr
- Unhealthy air days in 30 yrs
- 1 days/yr
Risk factors via First Street. Map © Google.
Why this score? — see what drove the C- grade
The composite is a weighted blend of 9 inputs, each scored 0–100. Each bar is that input's sub-score; the figure is the points it added to the 100-point composite (weight × sub-score).
- Cash flow +15.0/30.0
- ARV discount +7.5/15.0
- Appreciation +6.9/10.0
- Schools +5.8/10.0
- 1% rule +5.0/10.0
- DSCR +5.0/10.0
- Livability +3.1/5.0
- Rent growth +2.5/5.0
- Condition / age +2.5/5.0
$15,000
🖨 Deal sheet 📄 Offer letter ✓ Due diligence
Listing remarks
3-bedroom, 1-bath single-family home offering 2,064 square feet of living space, situated on a desirable corner lot in the quiet rural community of Sherman. This property is in need of renovation and presents a great opportunity for investors, flippers, or buyers looking to build equity. With its spacious layout and solid footprint, there’s plenty of potential to restore and customize to your vision. The lot includes a small barn, ideal for storage, workshop space, or hobby use. The corner location provides added accessibility and curb appeal. Located in a peaceful country setting, this property offers the chance to create value while enjoying small-town living. Bring your ideas and t
Key facts
- Small barn
- Corner lot
- 0.4 acre lot
Tags
Property features AI
Exterior
- Parking: Detached garage; 1 garage space
- Utilities: Public water connected; Sewer connected
- Home design: 2-story frame home with wood siding; Existing/resale property; Stone foundation
- Construction: Frame construction with wood siding; Stone foundation; Built as an existing structure
- Exterior features: Dirt driveway; Corner, irregular residential lot; Road frontage on a city street
Interior
- Kitchen: Water heater (listed under appliances); See remarks for additional kitchen appliance details
- Bedrooms: 1 main-level bedroom
- Flooring: Hardwood; Tile; Varies
- Bathrooms: 1 full bathroom (main level)
- Heating & cooling: Gas forced-air heating
- Interior features: Bedroom on main level; Varied interior finishes; see remarks
- Laundry & utility: Main-level laundry
Neighborhood map
What this means for you Summary
Snapshot
- This is a 3-bed/1.0-bath single-family listed at $15k.
Deal economics
- At list price, monthly cash flow is $944 ($11k/yr) — positive.
- The deal already cash-flows at list — no discount required.
- Meets the 1% rule at list price ($1k rent vs $15k).
- Recommended offer: $15k (1.5% below list) — sets the bar for market timing.
Location & tenants
- Location reads 62/100 on livability (#844 in NY) — a middle-class / working-renter tenant base. Strengths: cost of living A+, housing A, schools B+; Watch: employment C-, crime F, amenities F.
- Sherman Central School District (rural): math 70% / reading 65% proficiency, ranked #204 of 755 in NY (top 27%) — acceptable for families but not a draw, mixed tenant base, ~2y average lease.
- Market conditions: 12 active listings in the ZIP; 127 units permitted in Chautauqua County in 2024 (0 in 5+ unit buildings).
Forward outlook
- In year one you build about $676 of equity ($104 loan paydown + $572 appreciation (3.8% local appreciation)).
- Chautauqua County population projected at -22% by 2050 — secular population decline; favor cash flow + early exit over multi-decade hold.
- At projected returns (3.8% appreciation + 3.0% rent growth), your $4k cash investment doubles in ~1 year — after that, you're playing with house money.
Negotiation context
- It's been on market 18 days — a 2% lower offer ($15k) is reasonable based on typical stale-listing flexibility.
- 2 sale attempts since 7y ago with the ask held roughly flat each time — persistent listings suggest the price (not the market) is what's stuck; bring a comps-based counter.
Risks & watch-outs
- Watch-outs: built in 1824 — expect roof / HVAC / electrical / plumbing capex.
Questions for the listing agent
- Built in 1824 — when were the roof, HVAC, electrical panel, plumbing, and water heater last replaced?
- Is there a deadline driving the sale (1031 exchange, divorce, estate, relocation)? That informs how much negotiation room exists.
- Schools are B-rated — typically a magnet for longer-tenancy family renters. What's the average tenant stay here, and is there a school-zone premium baked into asking?
- Crime grade is F in this area — have there been break-ins, vandalism, or insurance claims at this property in the last 3 years? What carrier currently insures it and at what premium?
- What's the average days-on-market for RENTAL listings here right now (not sales)? A rising rental-DOM trend means longer vacancies and softer asking-rent achievability than the comps imply.
- What's the recent tenant-quality profile in this submarket — average credit score on applications, eviction rate, late-payment / NSF rate, and stable-employment percentage? A property-management company in the area should have these aggregated.
- How much new for-sale + rental construction is in the pipeline within 1–3 miles? Heavy new supply typically softens prices + rents 12–24 months out; constrained supply supports both.
Investment metrics
- 1% rule
- 8.84% ✓
- Cap rate
- 81.84%
- Cash-on-cash
- 269.82%
- DSCR
- 13.01
- GRM
- 0.9
CMA / ARV
- ARV (on-the-fly)
- $99,072
- Comps found
- 3
Show comp detail 3 sales within ~0.75 mi
| Address | Dist | Beds/Ba | Sqft | Sold | Price | $/sf | Match |
|---|---|---|---|---|---|---|---|
| 104 1st St | 0.12mi | 2/1.5 (-1) | 1,952 (-5%) | 14mo | $76,000 | $39 | 66 |
| 109 Kipp St | 0.50mi | 4/1.5 (+1) | 1,760 (-15%) | 3mo | $111,240 | $63 | 43 |
| 117 Miller St | 0.37mi | 4/2.0 (+1) | 2,298 (+11%) | 23mo | $110,000 | $48 | 36 |
Match score weights: distance 35% · size 25% · config 20% · recency 20%. Top-matched comps best support the ARV.
Projected returns pro-forma
3.81% appreciation · 3.0% rent growth · sell at horizon
- IRR
- —
- Equity multiple
- 15.91×
- Total profit
- $62,631
- Equity at exit
- $7,443
- IRR
- —
- Equity multiple
- 33.84×
- Total profit
- $137,912
- Equity at exit
- $12,045
Cash invested: $4,200 (down + closing). Projections, not guarantees.
Landlord ↔ Tenant lean methodology
- Overall (STATE)
- 15 Strongly Tenant-Friendly
- State New York
- 15 Strongly Tenant-Friendly · D+10
- County
- — inherits STATE
- City
- — inherits STATE
ZIP-level market 14781
- Home prices YoY
- 1.1%
- Active inventory
- 12
- Price-to-rent
- 0.9×
Monthly cashflow live
- Estimated rent
- $1,327 medium interval (Pro) →
- Mortgage (P&I)
- −$79
- Tax est. 1.5%
- −$19 /mo · $225/yr
- Insurance
- −$6
- HOA
- −$0
- Vacancy / Maint / Mgmt
- −$279
- Net cashflow
- $944
Break-even live
UW: 25.0% down · 7.5% · 30yr · 1.5% tax · 5.0% vac · 8.0% maint · 8.0% mgmt
Financing live
Cash to close
- Down payment
- $3,750
- Closing costs
- $450
- Reserves months
- —
- Total cash needed
- —
Loan-product check · same deal, 3 products live
Conventional
25% down · 7.5% · 30yr
- Down + closing
- —
- Monthly P&I
- —
- Monthly cashflow
- —
- DSCR
- —
- Eligible?
- —
Personal DTI + credit; lowest rate.
DSCR
20% down · 8.5% · 30yr
- Down + closing
- —
- Monthly P&I
- —
- Monthly cashflow
- —
- DSCR
- —
- Eligible?
- —
No personal income docs; deal must DSCR.
Hard money
10% down · 12.0% · 12mo
- Down + closing
- —
- Monthly P&I
- —
- Monthly cashflow
- —
- DSCR
- —
- Eligible?
- —
Short-term bridge; refi at stabilization.
Listing history 5 events
-
2026-04-19status Pending
-
2026-04-01$15,000 Active
-
2020-09-26historical
-
2020-03-23price $46,000
-
2019-09-26$48,000 Active
ⓘ Source: listings_history table (triggers on properties + properties_extension) + one-shot
backfill from property_details.listing_events for pre-trigger history.
Climate risk First Street
- Flood 1/10 Low FEMA zone X · 0% chance over 30 yrs
- Wildfire 2/10 Low
- Heat 1/10 Low 7 d/yr ≥89°F today · 17 d/yr by 30 yrs out
- Wind 1/10 Low
- Air quality 2/10 Low 1 unhealthy d/yr today · 1 by 30 yrs out
Nearby sold comps map
Loading sold comps map…
Walkable amenities ~0.75 mi
Loading nearby amenities…
Taxation est. · year 1
- Rental income
- $15,920
- − Mortgage interest
- −$840
- − Property taxes
- −$225
- − Insurance
- −$75
- − Repairs & maintenance
- −$1,274
- − Management
- −$1,274
- − Depreciation
- −$436
- Taxable income
- $11,796
- Est. tax owed @ 24.0%
- −$2,831
- After-tax cash flow
- $8,502/yr
For passive investors: Depreciation is non-cash, so a rental often shows a tax loss while cash-flowing — sheltering income. Rental losses are passive: they offset passive income freely, and up to $25,000/yr can offset ordinary (W-2) income if you actively participate and your MAGI is under $100k (phasing out to $0 by $150k); unused losses carry forward. On sale, claimed depreciation is recaptured at up to 25%, and gains may owe capital-gains tax (a 1031 exchange can defer both). Figures are a year-1 estimate at your 24.0% rate — not tax advice; consult a CPA.
Schools (NCES district)
- District
- Sherman Central School District
- NCES district ID
- 3626730
- Math proficiency
- 70% ▬ 0.00%
- Reading proficiency
- 65% ▲ 5.00%
- Median HH income
- $44,932
- Composite
- 58.13/100
- National rank
- #2135
- State rank
- #204 of 755 in NY
Livability — Sherman
- Score
- 62/100
- State rank
- #844
- US rank
- #16354
Category grades
Schools grade is shown separately in the Schools card above.
Census & demographics
- Census place
- Sherman, NY
- Population (ZIP)
- 1,859
Population outlook (Chautauqua County) Hauer SSP2
- Today (2025)
- 123,454 people
- By 2030
- 118,509 · -4.0%
- By 2040
- 107,311 · -13.1%
- By 2050
- 96,703 · -21.7%
- By 2075
- 76,757 · -37.8%
- By 2100
- 60,984 · -50.6%
Race, ethnicity, and origin ACS 2023
- Neighborhood character
- Predominantly White (90%)
- Race & ethnicity
- White 90% Two or more races 7% Hispanic / Latino 5%
- Hispanic origin (detail)
- Puerto Rican 5%
- Common ancestry
- Iranian 6% Romanian 5% Polish 5%
- Foreign-born
- 1%
- Languages at home
- 90% English-only · German/W. Germanic 9%
Political lean MEDSL · Chautauqua
- 2024 margin
- Strong R (+22.0) · D 39.0% · R 61.0%
- 2008→2024 swing
- -22.9pp toward R · 2008: 0.9pp · 2024: -22.0pp
- All cycles
- 2024: R+22.0 2020: R+19.8 2016: R+24.6 2012: R+8.2 2008: D+0.9
Not yet ingested
- Civics
- —
Market trends
- HPI YoY
- ▲ 3.81%
- Current HPI
- 346.9299
- Rent YoY
- —
- Metro
- —
- State GDP YoY
- ▲ 2.60%
- F500 in state
- 92
Industry mix (Fortune 500 HQ in NY)
| Industry | F500 HQs | Revenue |
|---|---|---|
| Financial Services | 10 | $950B |
|
||
| Consumer Goods | 9 | $162B |
|
||
| Insurance | 4 | $225B |
|
||
| Telecommunications | 2 | $144B |
|
||
| Pharmaceuticals | 2 | $112B |
|
||
| Media / Entertainment | 2 | $69B |
|
||
Price history
-68.8% since first listed5 events — show timeline
- 2026-04-19 Pending — UNYREIS
- 2026-04-01 Listed $15,000 UNYREIS
- 2020-09-26 Listing Removed — UNYREIS
- 2020-03-23 Price Changed $46,000 UNYREIS
- 2019-09-26 Listed $48,000 UNYREIS
Property tax history
+1.2%/yrLatest (2025): $1,415 · -0.7% YoY. Source: county tax records.
Cash-flow waterfall
monthlySold comps — $/sqft
last 12 mo · ≤1 miLoading sold comps…