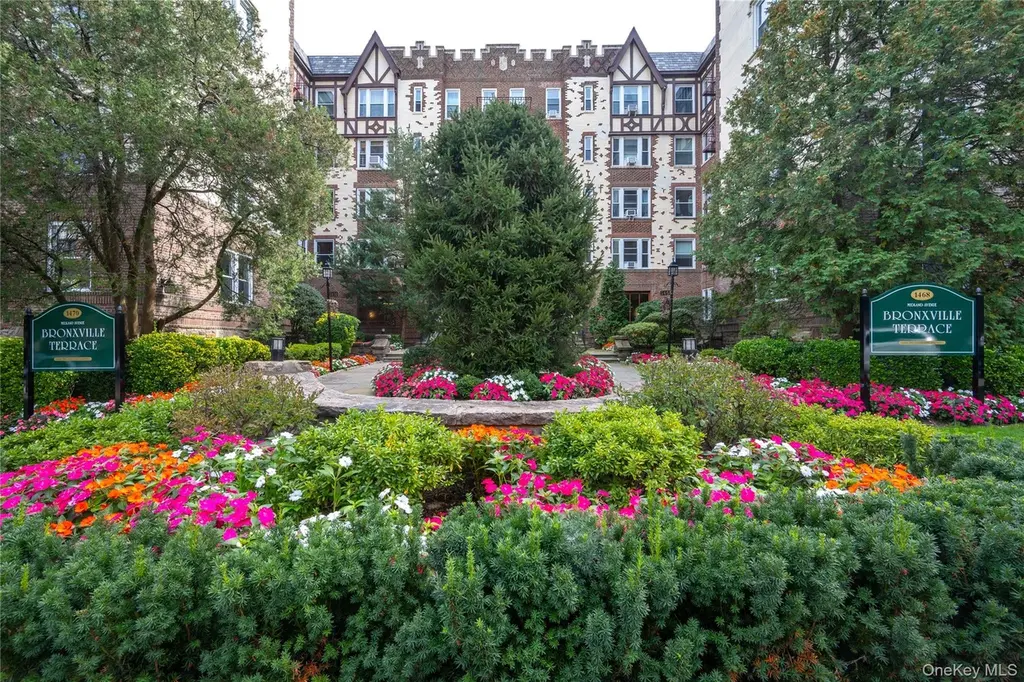
1468 Midland Ave Unit 4D · Yonkers, NY
Flood risk 1/10 · Minimal
- FEMA flood zone
- X (unshaded)
- Chance of flooding over 30 yrs
- 0.0%
- Est. flood insurance / yr
- $473 – $860
Fire risk 1/10 · Minimal
- Est. fire insurance / yr
- $691 – $1,283
Heat risk 6/10 · Moderate
- Hot days now (above 98°F)
- 7 days/yr
- Hot days in 30 yrs
- 15 days/yr
Wind risk 6/10 · Moderate
- Chance of severe wind over 30 yrs
- 27.0%
Air-quality risk 5/10 · Moderate
- Unhealthy air days now
- 6 days/yr
- Unhealthy air days in 30 yrs
- 8 days/yr
Risk factors via First Street. Map © Google.
Why this score? — see what drove the D grade
The composite is a weighted blend of 9 inputs, each scored 0–100. Each bar is that input's sub-score; the figure is the points it added to the 100-point composite (weight × sub-score).
- ARV discount +10.3/15.0
- Cash flow +8.0/30.0
- 1% rule +7.9/10.0
- Schools +4.1/10.0
- Condition / age +3.8/5.0
- Rent growth +3.6/5.0
- Livability +3.4/5.0
- DSCR +2.1/10.0
- Appreciation +0.0/10.0
$200,000
🖨 Deal sheet 📄 Offer letter ✓ Due diligence
Listing remarks
Welcome to Bronxville Terrace, a very popular financially sound coop with so much to offer! This high floor one bedroom is move in ready, and offers a beautifully renovated chefs kitchen and upgraded bath, east and south exposures with bright light all day and immaculate condition. The home features high ceilings, hardwood floors and classic archways offering a fabulous pre war feel. The living room and breakfast area face east for lovely morning sun while enjoying your coffee and the bedroom faces south with bright light all day. Bronxville Terrace offers charming Tudor details and many recent upgrades: new thermopane windows; new lobby video security, newly refreshed lobbies and hallways,
Key facts
- Garage
- Built 1928
- Listed 183 days
Neighborhood map
What this means for you Summary
Snapshot
- This is a 1-bed/1.0-bath condo listed at $200k. Condition is rated good.
Deal economics
- At list price, monthly cash flow is $-204 ($-2k/yr) — negative.
- The deal already cash-flows at list — no discount required.
- Meets the 1% rule at list price ($3k rent vs $200k).
- Recommended offer: $176k (12.0% below list) — sets the bar for market timing.
Location & tenants
- Location reads 68/100 on livability (#528 in NY) — a middle-class / working-renter tenant base. Strengths: employment A, commute B; Watch: amenities F, cost of living F.
- Yonkers City School District (suburban): math 41% / reading 54% proficiency, ranked #413 of 590 in NY (top 70%) — families likely to look elsewhere, expect single-tenant / working-renter base with shorter leases; 64% free/reduced lunch — lower-income household profile, screen leases tightly.
- Market conditions: Rents rising fast (+4.3%/yr); 245 active listings in the ZIP; 29 comparable units currently listed for rent nearby; rentals at typical pace (median 24d on market — plan ~3-4 weeks tenant-placement turnaround); high-income renter base; 954 units permitted in Westchester County in 2024 (649 in 5+ unit buildings).
Forward outlook
- Local home prices are declining (-3.0%/yr); year-one equity from $1k of loan paydown is wiped out by about $6k of value loss. Plan a longer hold.
- Westchester County population projected at +10% by 2050 — modest demand growth; plan on rents tracking national, not racing it.
Negotiation context
- It's been on market 183 days — a 12% lower offer ($176k) is reasonable based on typical stale-listing flexibility.
- 3 sale attempts with the ask held roughly flat each time — persistent listings suggest the price (not the market) is what's stuck; bring a comps-based counter.
Risks & watch-outs
- Watch-outs: HOA is 33% of rent; built in 1928 — expect roof / HVAC / electrical / plumbing capex.
- Climate carrying-cost: major wind risk, 27% chance of damaging wind over 30y; extreme-heat days projected 7→15/yr by 2055 (HVAC capex compounding) — expect insurance premiums to compound above CPI over the hold.
Questions for the listing agent
- What do current leases actually rent for vs. the listed asking? Can we see a recent rent roll and the last 12 months of T-12 income?
- It's been on market 183 days. Have you received any prior offers? Is the seller open to a 12% concession, seller financing, or rate buy-down credit?
- Built in 1928 — when were the roof, HVAC, electrical panel, plumbing, and water heater last replaced?
- What does the HOA fee cover, when was the last increase, and are there any pending special assessments or reserve-fund shortfalls?
- Any open or pending special assessments — roof, HVAC, plumbing, elevator, façade? What's the per-unit balance and payoff schedule, and is the seller paying it off at close or rolling it to the buyer?
- Why hasn't it sold? Are there any deal-killer items the seller is aware of (foundation, flood, title, zoning, code violations)?
- Is there a deadline driving the sale (1031 exchange, divorce, estate, relocation)? That informs how much negotiation room exists.
- The area grade is low — what's the realistic commute time and amenity access for the typical tenant pool here? Any planned neighborhood developments (good or bad) we should know about?
- What's the average days-on-market for RENTAL listings here right now (not sales)? A rising rental-DOM trend means longer vacancies and softer asking-rent achievability than the comps imply.
- What's the recent tenant-quality profile in this submarket — average credit score on applications, eviction rate, late-payment / NSF rate, and stable-employment percentage? A property-management company in the area should have these aggregated.
- How much new apartment / multifamily construction is in the pipeline within 1–3 miles? Heavy new supply (>2% of stock underway) typically softens rents 12–24 months out; light construction supports rent growth.
Investment metrics
- 1% rule
- 1.29% ✓
- Cap rate
- 5.07%
- Cash-on-cash
- -4.37%
- DSCR
- 0.81
- GRM
- 6.5
CMA / ARV
- ARV (median comp)
- $213,475
- List price
- $200,000
- Delta
- -6.31%
- Verdict
- FAIR
- Comps
- 20 within 1.0 mi
Projected returns pro-forma
-3.0% appreciation · 4.27% rent growth · sell at horizon
- IRR
- -20.9%
- Equity multiple
- 0.26×
- Total profit
- $-41,481
- Equity at exit
- $29,821
- IRR
- -9.6%
- Equity multiple
- 0.35×
- Total profit
- $-36,454
- Equity at exit
- $17,292
Cash invested: $56,000 (down + closing). Projections, not guarantees.
Landlord ↔ Tenant lean methodology
- Overall (CITY)
- 5 Strongly Tenant-Friendly
- State New York
- 15 Strongly Tenant-Friendly · D+10
- County
- — inherits STATE
- City Yonkers
- 5 Strongly Tenant-Friendly · D+20
ZIP-level market 10708
- Rents YoY
- 4.3%
- Active inventory
- 245
- Price-to-rent
- 6.5×
Monthly cashflow live
- Estimated rent
- $2,583 high interval (Pro) →
- Mortgage (P&I)
- −$1,049
- Tax est. 1.5%
- −$250 /mo · $3,000/yr
- Insurance
- −$83
- HOA est. from 1 same-building comp
- −$862
- Vacancy / Maint / Mgmt
- −$542
- Net cashflow
- $-204
Break-even live
UW: 25.0% down · 7.5% · 30yr · 1.5% tax · 5.0% vac · 8.0% maint · 8.0% mgmt
Financing live
Cash to close
- Down payment
- $50,000
- Closing costs
- $6,000
- Reserves months
- —
- Total cash needed
- —
Loan-product check · same deal, 3 products live
Conventional
25% down · 7.5% · 30yr
- Down + closing
- —
- Monthly P&I
- —
- Monthly cashflow
- —
- DSCR
- —
- Eligible?
- —
Personal DTI + credit; lowest rate.
DSCR
20% down · 8.5% · 30yr
- Down + closing
- —
- Monthly P&I
- —
- Monthly cashflow
- —
- DSCR
- —
- Eligible?
- —
No personal income docs; deal must DSCR.
Hard money
10% down · 12.0% · 12mo
- Down + closing
- —
- Monthly P&I
- —
- Monthly cashflow
- —
- DSCR
- —
- Eligible?
- —
Short-term bridge; refi at stabilization.
Rent comps 29 comps
| Address | Beds | Baths | Sqft | Rent | $/sqft | DOM | Units | Dist |
|---|---|---|---|---|---|---|---|---|
| 80 W Grand St Mount Vernon, NY | 1.0 | 1.0 | 850 | $1,942 | $2.28 | 24d | 1 | 0.28mi |
| 42 Broad St W Mount Vernon, NY | 3.0 | 1.0–2.0 | 955 | $2,841 | $2.97 | 1d | 16 | 0.30mi |
| 42 Broad St W Mount Vernon, NY | 3.0 | 1.0–2.0 | 1014 | $3,956 | $3.90 | 24d | 15 | 0.30mi |
| 669 N Terrace Ave Mount Vernon, NY | 1.0 | 1.0 | 750 | $2,031 | $2.71 | 24d | 1 | 0.35mi |
| 645 N MacQuesten Pkwy Unit 3G Mt Vernon, NY | 2.0 | 1.0 | 950 | $3,195 | $3.36 | 24d | 1 | 0.36mi |
| 33 William St Mount Vernon, NY | 1.0–2.0 | 1.0 | 725 | $1,850 | $2.55 | 22d | 2 | 0.50mi |
| 51 Parkway Rd Apt 3 Bronxville, NY | 1.0 | 1.0 | 1100 | $3,100 | $2.82 | 24d | 1 | 0.60mi |
| 671 Bronx River Rd Unit 3A Yonkers, NY | 2.0 | 1.5 | 950 | $3,000 | $3.16 | 24d | 1 | 0.62mi |
| 200 Crescent Pl Unit 2nd fl Yonkers, NY | 1.0 | 1.0 | 800 | $2,300 | $2.88 | 16d | 1 | 0.67mi |
| 28 Tunis Ave Unit 2 Yonkers, NY | 2.0 | 1.0 | 900 | $3,000 | $3.33 | 43d | 1 | 0.74mi |
| 12 Putnam St Mount Vernon, NY | 2.0 | 1.0 | 950 | $2,600 | $2.74 | 24d | 1 | 0.81mi |
| 230 N 7th Ave Unit 2 Mt Vernon, NY | 1.0 | 1.0 | 950 | $2,300 | $2.42 | 10d | 1 | 0.90mi |
| 103 North St Mount Vernon, NY | 1.0 | 1.0 | 720 | $1,900 | $2.64 | 20d | 1 | 0.96mi |
| 86 Edgewood Ave Unit 2W Yonkers, NY | 2.0 | 1.0 | 1000 | $2,699 | $2.70 | 43d | 1 | 0.99mi |
| 86 Edgewood Ave Apt 2E Yonkers, NY | 2.0 | 1.0 | 1000 | $2,599 | $2.60 | 18d | 1 | 0.99mi |
| 14 Elm St Unit 2 Mt Vernon, NY | 2.0 | 1.0 | 1000 | $2,800 | $2.80 | 24d | 1 | 1.07mi |
| 64 Sagamore Rd Unit A6 Bronxville, NY | 1.0 | 1.0 | 850 | $2,900 | $3.41 | 4d | 1 | 1.11mi |
| 148 Claremont Ave Mount Vernon, NY | 2.0 | 1.0 | 960 | $2,400 | $2.50 | 18d | 1 | 1.13mi |
| 495 Kimball Ave Unit First Floor Yonkers, NY | 2.0 | 1.0 | 1100 | $3,000 | $2.73 | 43d | 1 | 1.16mi |
| 64 Kensington Rd Apt 1A Bronxville, NY | 1.0 | 1.0 | 800 | $2,895 | $3.62 | 11d | 1 | 1.17mi |
| 32 N Bond St Mount Vernon, NY | 1.0 | 1.0 | 850 | $1,900 | $2.24 | 7d | 1 | 1.24mi |
| 142 Trenchard St Unit 2E Yonkers, NY | 1.0 | 1.0 | 900 | $2,250 | $2.50 | 11d | 1 | 1.26mi |
| 18 N Bond St Unit 3D Mt Vernon, NY | 1.0 | 1.0 | 750 | $2,000 | $2.67 | 24d | 1 | 1.28mi |
| 13 N Bond St Mount Vernon, NY | 1.0 | 1.0 | 600 | $1,785 | $2.98 | 24d | 1 | 1.30mi |
| 20 Overhill Pl Unit 3 Yonkers, NY | 2.0 | 1.0 | 800 | $3,000 | $3.75 | 43d | 1 | 1.30mi |
| 118 N Columbus Ave Mount Vernon, NY | 1.0 | 1.0 | 650 | $1,700 | $2.62 | 24d | 1 | 1.33mi |
| 111 Kensington Rd Unit 8 Bronxville, NY | 1.0 | 1.0 | 825 | $2,650 | $3.21 | 13d | 1 | 1.33mi |
| 112 N Columbus Ave Unit 2 Mt Vernon, NY | 2.0 | 2.0 | 900 | $2,997 | $3.33 | 18d | 1 | 1.33mi |
| 28 Kenilworth Rd Unit The Cottage Yonkers, NY | 1.0 | 1.0 | 600 | $1,950 | $3.25 | 14d | 1 | 1.39mi |
HOA detail condo
- Monthly dues
- $0 · $0/yr
- Likely covers
- security
- Assessments
- None detected in remarks — confirm with the listing agent.
Listing history 5 events
-
2026-05-01status Active
-
2026-04-07price $200,000
-
2026-01-05status Active
-
2025-10-24$210,000 Active
-
2025-10-19historical
ⓘ Source: listings_history table (triggers on properties + properties_extension) + one-shot
backfill from property_details.listing_events for pre-trigger history.
Climate risk First Street
- Flood 1/10 Low FEMA zone X (unshaded) · 0% chance over 30 yrs
- Wildfire 1/10 Low
- Heat 6/10 Major 7 d/yr ≥98°F today · 15 d/yr by 30 yrs out
- Wind 6/10 Major 27% chance of damaging wind over 30 yrs
- Air quality 5/10 Major 6 unhealthy d/yr today · 8 by 30 yrs out
Nearby sold comps map
Loading sold comps map…
Walkable amenities ~0.75 mi
Loading nearby amenities…
Taxation est. · year 1
- Rental income
- $30,992
- − Mortgage interest
- −$11,203
- − Property taxes
- −$3,000
- − Insurance
- −$1,000
- − Repairs & maintenance
- −$2,479
- − Management
- −$2,479
- − HOA
- −$10,344
- − Depreciation
- −$5,818
- Taxable loss
- −$5,332
- Est. tax savings @ 24.0%
- +$1,280
- After-tax cash flow
- $-1,166/yr
For passive investors: Depreciation is non-cash, so a rental often shows a tax loss while cash-flowing — sheltering income. Rental losses are passive: they offset passive income freely, and up to $25,000/yr can offset ordinary (W-2) income if you actively participate and your MAGI is under $100k (phasing out to $0 by $150k); unused losses carry forward. On sale, claimed depreciation is recaptured at up to 25%, and gains may owe capital-gains tax (a 1031 exchange can defer both). Figures are a year-1 estimate at your 24.0% rate — not tax advice; consult a CPA.
Condition & rehab AI · 12 photos
This move-in ready condo in Bronxville Terrace offers a beautifully renovated kitchen, updated bath, and charming Tudor details. The property is in good condition with minimal maintenance required.
Value-add opportunities
- Both Paint exterior — Enhances curb appeal and resale value
- Resale Replace old appliances — Modernizes kitchen and appeals to buyers
- Rental Install smart home devices — Attracts tech-savvy renters
Renovation cost estimate screening
Value-add ROI direction
- Both Paint exterior — Enhances curb appeal and resale value ↑
- Resale Replace old appliances — Modernizes kitchen and appeals to buyers ↑
- Rental Install smart home devices — Attracts tech-savvy renters ↑
ⓘ Cost ranges are severity-bucket heuristics (US national rule-of-thumb). Get contractor quotes + a written scope before underwriting a rehab budget.
Schools (NCES district)
- District
- Yonkers City School District
- NCES district ID
- 3631920
- Math proficiency
- 41% ▼ -1.00%
- Reading proficiency
- 54% ▲ 14.00%
- Median HH income
- $58,042
- Composite
- 41.43/100
- National rank
- #3471
- State rank
- #413 of 590 in NY
Livability — Yonkers
- Score
- 68/100
- State rank
- #528
- US rank
- #9394
Category grades
Schools grade is shown separately in the Schools card above.
Census & demographics
- Census place
- Yonkers, NY
- County
- Westchester County · 709,332 people
- City population
- 212,407
- Metro
- New York-Newark-Jersey City, NY-NJ-PA
- Population (ZIP)
- 22,482
- Household income
- $126,343
- Rent vs Own
- Severe rent burden
- 357.0
Population outlook (Westchester County) Hauer SSP2
- Today (2025)
- 1,028,035 people
- By 2030
- 1,051,636 · +2.3%
- By 2040
- 1,098,520 · +6.9%
- By 2050
- 1,136,044 · +10.5%
- By 2075
- 1,196,925 · +16.4%
- By 2100
- 1,175,147 · +14.3%
Race, ethnicity, and origin ACS 2023
- Neighborhood character
- Predominantly White (69%)
- Race & ethnicity
- White 69% Hispanic / Latino 17% Two or more races 10% Black 6% Asian 4%
- Hispanic origin (detail)
- Puerto Rican 7% Dominican 3%
- Common ancestry
- Romanian 2% Lithuanian 2% Scotch-Irish 1%
- Foreign-born
- 16% · Canada, China
- Languages at home
- 76% English-only · Spanish 10% Other Indo-European 6% Other Asian/Pacific 2%
Political lean MEDSL · Westchester
- 2024 margin
- Strong D (+26.3) · D 63.1% · R 36.9%
- 2008→2024 swing
- -1.3pp toward R · 2008: 27.6pp · 2024: 26.3pp
- All cycles
- 2024: D+26.3 2020: D+36.3 2016: D+32.8 2012: D+22.2 2008: D+27.6
Not yet ingested
- Civics
- —
Market trends
- HPI YoY
- ▼ -668.11%
- Current HPI
- 203.4295
- Rent YoY
- ▲ 4.27%
- Metro
- New York-Newark-Jersey City, NY-NJ-PA
- State GDP YoY
- ▲ 2.60%
- F500 in state
- 92
Industry mix (Fortune 500 HQ in NY)
| Industry | F500 HQs | Revenue |
|---|---|---|
| Financial Services | 10 | $950B |
|
||
| Consumer Goods | 9 | $162B |
|
||
| Insurance | 4 | $225B |
|
||
| Telecommunications | 2 | $144B |
|
||
| Pharmaceuticals | 2 | $112B |
|
||
| Media / Entertainment | 2 | $69B |
|
||
Price history
-4.8% since first listed5 events — show timeline
- 2026-05-01 Relisted — OneKey® MLS as Distributed by MLS Grid
- 2026-04-07 Price Changed $200,000 OneKey® MLS as Distributed by MLS Grid
- 2026-01-05 Relisted — OneKey® MLS as Distributed by MLS Grid
- 2025-10-24 Listed $210,000 OneKey® MLS as Distributed by MLS Grid
- 2025-10-19 Coming Soon — OneKey® MLS as Distributed by MLS Grid
Cash-flow waterfall
monthlySold comps — $/sqft
last 12 mo · ≤1 miLoading sold comps…