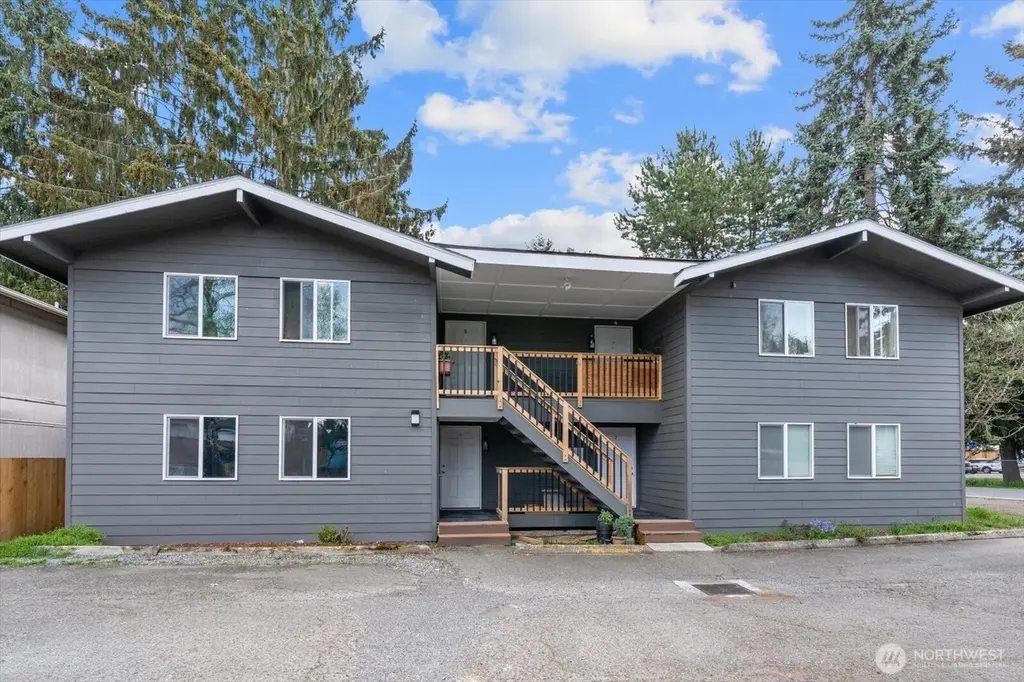
 Fourplex
10443 17 Ave SW · White Center, WA
Flood risk 1/10 · Minimal
- FEMA flood zone
- X (unshaded)
- Chance of flooding over 30 yrs
- 0.0%
- Est. flood insurance / yr
- $507 – $1,088
Fire risk 1/10 · Minimal
- Est. fire insurance / yr
- $604 – $1,122
Heat risk 3/10 · Minor
- Hot days now (above 86°F)
- 7 days/yr
- Hot days in 30 yrs
- 14 days/yr
Wind risk 1/10 · Minimal
- Chance of severe wind over 30 yrs
- —
Air-quality risk 6/10 · Moderate
- Unhealthy air days now
- 8 days/yr
- Unhealthy air days in 30 yrs
- 9 days/yr
Risk factors via First Street. Map © Google.
Why this score? — see what drove the C- grade
The composite is a weighted blend of 9 inputs, each scored 0–100. Each bar is that input's sub-score; the figure is the points it added to the 100-point composite (weight × sub-score).
- Cash flow +18.7/30.0
- ARV discount +7.7/15.0
- DSCR +5.9/10.0
- 1% rule +5.6/10.0
- Livability +4.2/5.0
- Schools +3.9/10.0
- Condition / age +2.5/5.0
- Rent growth +2.4/5.0
- Appreciation +0.0/10.0
$980,000
🖨 Deal sheet (PDF) 📄 Offer letter ✓ Due diligence
Multi-family units
County records classify this as Multi-Family (5+ Unit). Listing-text estimate: 4 units. estimate disagrees with records
5+ unit building — per-unit beds/baths from public records are typically unavailable; the breakdown below (if shown) is an estimate from the listing text.
Listing remarks
Exceptional opportunity to acquire a fully renovated, income-producing 4-plex in Seattle’s highly competitive 98146 rental corridor. Priced aggressively under $1M, this stabilized multifamily asset is expected to generate * * strong immediate interest and multiple offers * * due to its turnkey condition, income stability, and limited availability of similar assets in this price range. Comprehensively renovated in 2025, the property features four well-designed 2BD/1BA units, each offering strong tenant appeal, in-unit washer/dryer, private outdoor space (decks/patios/yards), and reserved parking. All units are occupied by stable long-term tenants at $1,800/month, producing $86,400
Key facts
- Reserved parking
- Long term tenants
- Modern finishes
Tags
Neighborhood map
What this means for you Summary
Snapshot
- This is a 4 × 2-bed/1-bath units multifamily listed at $980k.
Deal economics
- At list price, monthly cash flow is $972 ($12k/yr) — positive. Per door: $243/mo.
- The deal already cash-flows at list — no discount required.
- Meets the 1% rule at list price ($10k rent vs $980k).
- Recommended offer: $951k (3.0% below list) — sets the bar for market timing.
- Cap rate 7.5% vs local median 2.3% in White Center — top-decile yield for the area; either an underpriced asset or a hidden risk that comps aren't pricing in. Stress-test before assuming the spread holds.
Location & tenants
- Location reads 83/100 on livability (#49 in WA, #897 nationally) — a professional / high-income tenant draw. Strengths: amenities A+, commute A+, health & safety A+; Watch: cost of living F.
- Highline School District (suburban): math 36% / reading 49% proficiency, ranked #200 of 291 in WA (top 69%) — families likely to look elsewhere, expect single-tenant / working-renter base with shorter leases.
- Market conditions: Rents soft (-0.3%/yr); 109 active listings in the ZIP; solid renter incomes; 10,555 units permitted in King County in 2024 (7,119 in 5+ unit buildings).
- At $10,425/mo this rent would consume 122% of the median local household income ($103k/yr) (locally 816% of renters already pay >50% of income on rent) — very limited rent-growth headroom before tenants either downsize or default.
Forward outlook
- Local home prices are declining (-3.0%/yr); year-one equity from $7k of loan paydown is wiped out by about $29k of value loss. Plan a longer hold.
- King County population projected at +44% by 2050 — long-run rental-demand tailwind backs the buy-and-hold thesis.
Negotiation context
- It's been on market 54 days — a 3% lower offer ($951k) is reasonable based on typical stale-listing flexibility.
- 3 sale attempts since 3y ago with the ask held roughly flat each time — persistent listings suggest the price (not the market) is what's stuck; bring a comps-based counter.
Questions for the listing agent
- It's been on market 54 days. Have you received any prior offers? Is the seller open to a 3% concession, seller financing, or rate buy-down credit?
- Can we see the unit-by-unit rent roll, current vacancy, and any below-market leases? What's the average tenancy length?
- What capital expenditures (roof, boiler, parking lot, exteriors) have been made in the last 5 years, and what's planned in the next 2?
- Built in 1969 — when were the roof, HVAC, electrical panel, plumbing, and water heater last replaced?
- What does the HOA fee cover, when was the last increase, and are there any pending special assessments or reserve-fund shortfalls?
- Is there a deadline driving the sale (1031 exchange, divorce, estate, relocation)? That informs how much negotiation room exists.
- Schools are A-rated — typically a magnet for longer-tenancy family renters. What's the average tenant stay here, and is there a school-zone premium baked into asking?
- What's the average days-on-market for RENTAL listings here right now (not sales)? A rising rental-DOM trend means longer vacancies and softer asking-rent achievability than the comps imply.
- What's the recent tenant-quality profile in this submarket — average credit score on applications, eviction rate, late-payment / NSF rate, and stable-employment percentage? A property-management company in the area should have these aggregated.
- How much new apartment / multifamily construction is in the pipeline within 1–3 miles? Heavy new supply (>2% of stock underway) typically softens rents 12–24 months out; light construction supports rent growth.
Investment metrics
- 1% rule
- 1.06% ✓
- Cap rate
- 7.48%
- Cash-on-cash
- 4.25%
- DSCR
- 1.19
- GRM
- 7.8
CMA / ARV
- ARV (median comp)
- $984,861
- List price
- $980,000
- Delta
- -0.49%
- Verdict
- FAIR
- Comps
- 6 within 1.0 mi
Projected returns pro-forma
-3.0% appreciation · 0.0% rent growth · sell at horizon
- IRR
- -13.3%
- Equity multiple
- 0.54×
- Total profit
- $-127,004
- Equity at exit
- $146,121
- IRR
- -10.3%
- Equity multiple
- 0.46×
- Total profit
- $-147,102
- Equity at exit
- $84,732
Cash invested: $274,400 (down + closing). Projections, not guarantees.
Landlord ↔ Tenant lean methodology
- Overall (STATE)
- 28 Tenant-Leaning
- State Washington
- 28 Tenant-Leaning · D+8
- County
- — inherits STATE
- City
- — inherits STATE
ZIP-level market 98146
- Rents YoY
- -0.3%
- Active inventory
- 109
- Price-to-rent
- 31.3×
Monthly cashflow live
- Estimated rent
- $10,425 high interval (Pro) →
- Mortgage (P&I)
- −$5,139
- Tax from tax record
- −$1,705 /mo · $20,465/yr
- Insurance
- −$408
- HOA
- −$11
- Vacancy / Maint / Mgmt
- −$2,189
- Net cashflow
- $972
Break-even live
Sensitivity live
| Price | -10% $1,526 | -5% $1,249 | +0% $972 | +5% $694 | +10% $417 |
|---|---|---|---|---|---|
| Rent | -10% $148 | -5% $560 | +0% $972 | +5% $1,384 | +10% $1,795 |
| Rate | -1.0pp $1,465 | -0.5pp $1,221 | base $972 | +0.5pp $718 | +1.0pp $459 |
4-unit breakdown (identical units grouped — click to expand)
| Units | Beds | Baths | Est. rent |
|---|---|---|---|
| 4× units | 2 | 1 | $10,424 |
| #1 | 2 | 1 | $2,606 |
| #2 | 2 | 1 | $2,606 |
| #3 | 2 | 1 | $2,606 |
| #4 | 2 | 1 | $2,606 |
| Total (4 units) | $10,425 | ||
UW: 25.0% down · 7.5% · 30yr · 1.5% tax · 5.0% vac · 8.0% maint · 8.0% mgmt
Financing live
Cash to close
- Down payment
- $245,000
- Closing costs
- $29,400
- Reserves months
- —
- Total cash needed
- —
Loan-product check · same deal, 3 products live
Conventional
25% down · 7.5% · 30yr
- Down + closing
- —
- Monthly P&I
- —
- Monthly cashflow
- —
- DSCR
- —
- Eligible?
- —
Personal DTI + credit; lowest rate.
DSCR
20% down · 8.5% · 30yr
- Down + closing
- —
- Monthly P&I
- —
- Monthly cashflow
- —
- DSCR
- —
- Eligible?
- —
No personal income docs; deal must DSCR.
Hard money
10% down · 12.0% · 12mo
- Down + closing
- —
- Monthly P&I
- —
- Monthly cashflow
- —
- DSCR
- —
- Eligible?
- —
Short-term bridge; refi at stabilization.
HOA detail
- Monthly dues
- $11 · $132/yr
Listing history 25 events
-
2026-06-21days on market $980,000 Active 54 DOM
-
2026-06-19days on market $980,000 Active 53 DOM
-
2026-06-18days on market $980,000 Active 52 DOM
-
2026-06-17days on market $980,000 Active 51 DOM
-
2026-06-16days on market $980,000 Active 50 DOM
-
2026-06-15days on market $980,000 Active 49 DOM
-
2026-06-15days on market $980,000 Active 48 DOM
-
2026-06-14price $980,000 Active 47 DOM
-
2026-06-13days on market $990,000 Active 47 DOM
-
2026-06-12days on market $990,000 Active 46 DOM
-
2026-06-10days on market $990,000 Active 44 DOM
-
2026-06-09days on market $990,000 Active 43 DOM
-
2026-06-08days on market $990,000 Active 42 DOM
-
2026-06-07days on market $990,000 Active 41 DOM
-
2026-06-07days on market $990,000 Active 40 DOM
-
2026-06-05pricestatus $990,000 Active 38 DOM
-
2026-05-11status Pending
-
2026-04-03$999,000 Active
-
2023-08-30soldstatus $1,600,000 Closed
-
2023-08-30soldstatus $1,600,000
-
2023-05-16status Pending
-
2023-05-04status Active
-
2023-04-12status Pending
-
2023-04-03$1,700,000 Active
-
1978-09-25soldstatus $170,000
ⓘ Source: listings_history table (triggers on properties + properties_extension) + one-shot
backfill from property_details.listing_events for pre-trigger history.
Tax reassessment forecast WA · Resets to sale price
- Current annual tax
- $20,465 · $1,705/mo
- Projected year-2 tax
- $20,465 · $1,705/mo
- Expected delta
- $0/yr ($0/mo · 0.0%)
ⓘ Screening estimate from a state-policy table — verify with the county assessor before closing.
Climate risk First Street
- Flood 1/10 Low FEMA zone X (unshaded) · 0% chance over 30 yrs
- Wildfire 1/10 Low
- Heat 3/10 Moderate 7 d/yr ≥86°F today · 14 d/yr by 30 yrs out
- Wind 1/10 Low
- Air quality 6/10 Major 8 unhealthy d/yr today · 9 by 30 yrs out
Nearby sold comps map
Loading sold comps map…
Walkable amenities ~0.75 mi
Loading nearby amenities…
Taxation est. · year 1
- Rental income
- $125,100
- − Mortgage interest
- −$54,895
- − Property taxes
- −$20,465
- − Insurance
- −$4,900
- − Repairs & maintenance
- −$10,008
- − Management
- −$10,008
- − HOA
- −$132
- − Depreciation
- −$28,509
- Taxable loss
- −$3,818
- Est. tax savings @ 24.0%
- +$916
- After-tax cash flow
- $12,577/yr
For passive investors: Depreciation is non-cash, so a rental often shows a tax loss while cash-flowing — sheltering income. Rental losses are passive: they offset passive income freely, and up to $25,000/yr can offset ordinary (W-2) income if you actively participate and your MAGI is under $100k (phasing out to $0 by $150k); unused losses carry forward. On sale, claimed depreciation is recaptured at up to 25%, and gains may owe capital-gains tax (a 1031 exchange can defer both). Figures are a year-1 estimate at your 24.0% rate — not tax advice; consult a CPA.
Schools (NCES district)
- District
- Highline School District
- NCES district ID
- 5303540
- Math proficiency
- 36% ▼ -4.00%
- Reading proficiency
- 49% ▼ -1.00%
- Median HH income
- $52,697
- Composite
- 39.12/100
- National rank
- #8245
- State rank
- #200 of 291 in WA
Livability — White Center
- Score
- 83/100
- State rank
- #49
- US rank
- #897
Category grades
Schools grade is shown separately in the Schools card above.
Census & demographics
- Census place
- White Center, WA
- County
- King County · 2,251,916 people
- Metro
- Seattle-Tacoma-Bellevue, WA
- Population (ZIP)
- 28,573
- Household income
- $102,520
- Rent vs Own
- Severe rent burden
- 816.0
Population outlook (King County) Hauer SSP2
- Today (2025)
- 2,576,485 people
- By 2030
- 2,803,316 · +8.8%
- By 2040
- 3,255,921 · +26.4%
- By 2050
- 3,706,444 · +43.9%
- By 2075
- 4,746,063 · +84.2%
- By 2100
- 5,407,730 · +109.9%
Race, ethnicity, and origin ACS 2023
- Neighborhood character
- Highly diverse neighborhood (Simpson 0.70)
- Race & ethnicity
- White 46% Hispanic / Latino 20% Asian 19% Black 8% Two or more races 8% Native American 1%
- Hispanic origin (detail)
- Mexican 14%
- Common ancestry
- Italian 4% Portuguese 3% Lithuanian 3%
- Foreign-born
- 26% · Canada, Vietnam, South Korea
- Languages at home
- 67% English-only · Spanish 15% Vietnamese 7% Other Asian/Pacific 2%
Political lean MEDSL · King
- 2024 margin
- Solid D (+51.7) · D 74.2% · R 22.5% · Other 3.4%
- 2008→2024 swing
- +9.6pp toward D · 2008: 42.1pp · 2024: 51.7pp
- All cycles
- 2024: D+51.7 2020: D+52.7 2016: D+50.4 2012: D+39.9 2008: D+42.1
Not yet ingested
- Civics
- —
Market trends
- HPI YoY
- ▼ -958.86%
- Current HPI
- 306.8042
- Rent YoY
- ▼ -0.35%
- Metro
- Seattle-Tacoma-Bellevue, WA
- State GDP YoY
- ▲ 4.65%
- F500 in state
- 22
Industry mix (Fortune 500 HQ in WA)
| Industry | F500 HQs | Revenue |
|---|---|---|
| Retail | 2 | $269B |
|
||
| Technology / Retail | 1 | $638B |
|
||
| Technology | 1 | $245B |
|
||
| Telecommunications | 1 | $38B |
|
||
| Food / Beverage | 1 | $36B |
|
||
| Automotive / Trucks | 1 | $34B |
|
||
Price history
+487.6% since first listed9 events — show timeline
- 2026-05-11 Pending — NWMLS as Distributed by MLS Grid
- 2026-04-03 Listed $999,000 NWMLS as Distributed by MLS Grid
- 2023-08-30 Sold (Public Records) $1,600,000 Public Records
- 2023-08-30 Sold (MLS) $1,600,000 NWMLS as Distributed by MLS Grid
- 2023-05-16 Pending — NWMLS as Distributed by MLS Grid
- 2023-05-04 Relisted — NWMLS as Distributed by MLS Grid
- 2023-04-12 Pending — NWMLS as Distributed by MLS Grid
- 2023-04-03 Listed $1,700,000 NWMLS as Distributed by MLS Grid
- 1978-09-25 Sold (Public Records) $170,000 Public Records
Property tax history
+6.5%/yrLatest (2024): $20,465 · +3.7% YoY. Source: county tax records.
Cash-flow waterfall
monthlySold comps — $/sqft
last 12 mo · ≤1 miLoading sold comps…