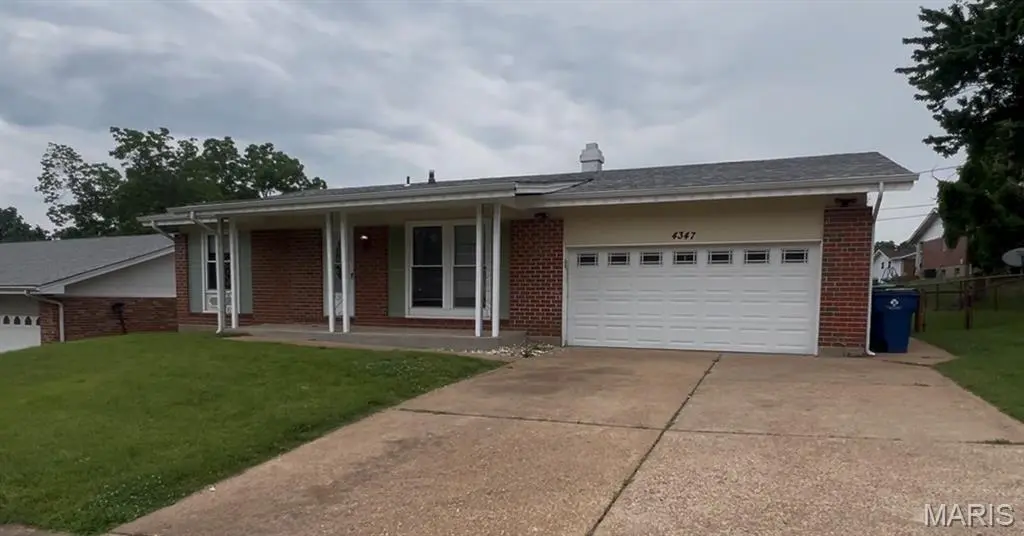
4347 Varano Dr · Florissant, MO
Flood risk 1/10 · Minimal
- FEMA flood zone
- X (unshaded)
- Chance of flooding over 30 yrs
- 0.0%
- Est. flood insurance / yr
- $473 – $860
Fire risk 1/10 · Minimal
- Est. fire insurance / yr
- $1,054 – $1,958
Heat risk 5/10 · Moderate
- Hot days now (above 106°F)
- 7 days/yr
- Hot days in 30 yrs
- 21 days/yr
Wind risk 2/10 · Minimal
- Chance of severe wind over 30 yrs
- 1.0%
Air-quality risk 3/10 · Minor
- Unhealthy air days now
- 3 days/yr
- Unhealthy air days in 30 yrs
- 5 days/yr
Risk factors via First Street. Map © Google.
Why this score? — see what drove the D+ grade
The composite is a weighted blend of 9 inputs, each scored 0–100. Each bar is that input's sub-score; the figure is the points it added to the 100-point composite (weight × sub-score).
- Cash flow +12.0/30.0
- Appreciation +10.0/10.0
- ARV discount +7.1/15.0
- Rent growth +4.4/5.0
- Livability +3.7/5.0
- DSCR +3.6/10.0
- 1% rule +3.1/10.0
- Condition / age +2.5/5.0
- Schools +1.7/10.0
$235,000
🖨 Deal sheet (PDF) 📄 Offer letter ✓ Due diligence
Listing remarks MLS
This beautiful ranch styled home is ready for a loving family. It sits in the Seven Hills subdivision which is an outstanding family-oriented community. The kitchen has been recently updated with stainless steel appliances. The family room has a wood burning fireplace to ensure warm memories on a cold day. On the lower level, there is additional living space, entertainment space, and plenty of room for storage. The flat backyard is suited perfectly for outdoor gatherings. Lastly, this property has a two car garage and room for more in driveway. Don't miss out on this opportunity !!
Key facts
- 8,280 sq ft lot
- 2 garage spots
- Built 1966
Property features AI
Finance
- Other: No additional financial details provided
- Financial info: Lease not considered
- HOA & community: No HOA information provided
Exterior
- Parking: Attached 2-car garage (total 2 parking spaces)
- Security: No security information provided
- Utilities: Public water; Public sewer; Electric service by Ameren; Natural gas available
- Home design: Single-family residence; One level
- Construction: Brick construction
- Exterior features: Front yard; Back yard
Interior
- Kitchen: No specific kitchen appliance list provided
- Bedrooms: 4 bedrooms (all on the main level)
- Flooring: No flooring information provided
- Bathrooms: 2 full bathrooms (main level)
- Heating & cooling: Forced air heating (natural gas); Central electric air conditioning
- Interior features: Partially finished basement; Wood-burning fireplace in family room; Gas water heater
- Laundry & utility: No specific laundry appliances listed
Neighborhood map
What this means for you Summary
Snapshot
- This is a 4-bed/2.0-bath single-family listed at $235k.
Deal economics
- At list price, monthly cash flow is $-55 ($-661/yr) — negative.
- To cash-flow at today's rent, offer at most $225k (4.1% below list).
- To meet the 1% rule (rent ≥ 1% of price), the offer needs to be $190k (19.2% below list).
- Recommended offer: $190k (19.2% below list) — sets the bar for 1% rule.
Location & tenants
- Location reads 73/100 on livability (#82 in MO) — a middle-class / working-renter tenant base. Strengths: cost of living A+, housing A+, health & safety B+; Watch: crime C-, amenities D+, commute F.
- Hazelwood (suburban): math 11% / reading 26% proficiency, ranked #306 of 324 in MO (top 94%) — low school quality limits family demand, transient renter base, plan for 1-2y turnover.
- Zoned schools: Jury Elem. (math 5% / reading 19%, grade F, #1,016 of 1,115 statewide, top 92%, 420 students, 99% FRL); Central Middle (math 12% / reading 25%, grade F, #348 of 391 statewide, top 89%, 707 students, 68% FRL); Hazelwood Central High (math 12% / reading 33%, grade F, #455 of 521 statewide, top 88%, 1,628 students, 52% FRL) — zoned schools average 73% FRL vs 53% district-wide (20 pts higher); higher-poverty schools than district average — tighter screening recommended.
- Market conditions: Rents rising fast (+7.5%/yr); 221 active listings in the ZIP; 10 comparable units currently listed for rent nearby; rentals leasing fast (median 9d on market — plan ~1-2 weeks tenant-placement turnaround); 920 units permitted in St. Louis County in 2024 (250 in 5+ unit buildings).
- This rent runs 34% of the median local income ($67k/yr) — at the standard rent-burdened threshold; future hikes will face affordability resistance.
Forward outlook
- In year one you build about $25k of equity ($2k loan paydown + $24k appreciation (10.0% local appreciation)).
- At projected returns (10.0% appreciation + 7.5% rent growth), your $66k cash investment doubles in ~3 years — after that, you're playing with house money.
- By year 2, paydown + projected appreciation supports a ~$40k cash-out refi (75% LTV) — recoverable capital for the next deal without selling this one.
Negotiation context
- It's been on market 16 days — a 2% lower offer ($231k) is reasonable based on typical stale-listing flexibility.
- Current owner paid $134k; list at $235k implies a 75% gain — meaningful room to come down on a strong offer.
Risks & watch-outs
- Climate carrying-cost: extreme-heat days projected 7→21/yr by 2055 (HVAC capex compounding) — expect insurance premiums to compound above CPI over the hold.
Questions for the listing agent
- What do current leases actually rent for vs. the listed asking? Can we see a recent rent roll and the last 12 months of T-12 income?
- Built in 1966 — when were the roof, HVAC, electrical panel, plumbing, and water heater last replaced?
- Is there a deadline driving the sale (1031 exchange, divorce, estate, relocation)? That informs how much negotiation room exists.
- Schools are D-rated, which usually means shorter tenancies and higher turnover. Who's the typical renter profile here, and what's been the actual vacancy rate?
- The area grade is low — what's the realistic commute time and amenity access for the typical tenant pool here? Any planned neighborhood developments (good or bad) we should know about?
- What's the average days-on-market for RENTAL listings here right now (not sales)? A rising rental-DOM trend means longer vacancies and softer asking-rent achievability than the comps imply.
- What's the recent tenant-quality profile in this submarket — average credit score on applications, eviction rate, late-payment / NSF rate, and stable-employment percentage? A property-management company in the area should have these aggregated.
- How much new for-sale + rental construction is in the pipeline within 1–3 miles? Heavy new supply typically softens prices + rents 12–24 months out; constrained supply supports both.
Investment metrics
- 1% rule
- 0.81% ✗
- Cap rate
- 6.01%
- Cash-on-cash
- -1.00%
- DSCR
- 0.96
- GRM
- 10.3
CMA / ARV
- ARV (on-the-fly)
- $233,144
- Comps found
- 12
Show comp detail 12 sales within ~0.75 mi
| Address | Dist | Beds/Ba | Sqft | Sold | Price | $/sf | Match |
|---|---|---|---|---|---|---|---|
| 11636 Macrinus Dr | 0.21mi | 4/3.0 | 1,525 (-1%) | 1mo | $229,900 | $151 | 83 |
| 11962 Nero Dr | 0.13mi | 3/2.0 (-1) | 1,440 (-7%) | 1mo | $220,000 | $153 | 77 |
| 2325 Grassland Dr | 0.31mi | 3/2.0 (-1) | 1,525 (-1%) | 2mo | $239,000 | $157 | 77 |
| 4471 Rhine Dr | 0.31mi | 4/3.0 | 1,525 (-1%) | 7mo | $245,000 | $161 | 73 |
| 2390 Grassland Dr | 0.36mi | 4/2.0 | 1,653 (+7%) | 4mo | $175,000 | $106 | 68 |
| 4461 Rhine Dr | 0.31mi | 3/2.5 (-1) | 1,607 (+4%) | 5mo | $150,000 | $93 | 67 |
| 4451 Rhine Dr | 0.31mi | 3/2.0 (-1) | 1,421 (-8%) | 0mo | $165,000 | $116 | 67 |
| 4443 Remus Dr | 0.25mi | 4/2.5 | 1,354 (-12%) | 3mo | $224,900 | $166 | 63 |
| 19 Bridekirk Ct | 0.64mi | 4/2.0 | 1,624 (+5%) | 1mo | $220,000 | $135 | 61 |
| 4428 Papal Dr | 0.23mi | 3/2.0 (-1) | 1,318 (-15%) | 6mo | $129,900 | $99 | 55 |
| 4040 Helmkampf Dr | 0.40mi | 3/2.0 (-1) | 1,371 (-11%) | 8mo | $215,000 | $157 | 52 |
| 1945 Pohlman Rd | 0.73mi | 4/2.0 | 1,665 (+8%) | 6mo | $225,000 | $135 | 48 |
Match score weights: distance 35% · size 25% · config 20% · recency 20%. Top-matched comps best support the ARV.
Projected returns pro-forma
10.0% appreciation · 7.51% rent growth · sell at horizon
- IRR
- 25.0%
- Equity multiple
- 3.03×
- Total profit
- $133,471
- Equity at exit
- $211,707
- IRR
- 23.2%
- Equity multiple
- 7.35×
- Total profit
- $417,672
- Equity at exit
- $456,553
Cash invested: $65,800 (down + closing). Projections, not guarantees.
Landlord ↔ Tenant lean methodology
- Overall (STATE)
- 81 Strongly Landlord-Friendly
- State Missouri
- 81 Strongly Landlord-Friendly · R+10
- County
- — inherits STATE
- City
- — inherits STATE
ZIP-level market 63033
- Home prices YoY
- 2.5%
- Rents YoY
- 7.5%
- Active inventory
- 221
- Price-to-rent
- 10.3×
Monthly cashflow live
- Estimated rent
- $1,899 high interval (Pro) →
- Mortgage (P&I)
- −$1,232
- Tax from tax record
- −$225 /mo · $2,696/yr
- Insurance
- −$98
- HOA
- −$0
- Vacancy / Maint / Mgmt
- −$399
- Net cashflow
- $-55
Break-even live
Sensitivity live
| Price | -10% $78 | -5% $11 | +0% $-55 | +5% $-122 | +10% $-188 |
|---|---|---|---|---|---|
| Rent | -10% $-205 | -5% $-130 | +0% $-55 | +5% $20 | +10% $95 |
| Rate | -1.0pp $63 | -0.5pp $5 | base $-55 | +0.5pp $-116 | +1.0pp $-178 |
UW: 25.0% down · 7.5% · 30yr · 1.5% tax · 5.0% vac · 8.0% maint · 8.0% mgmt
Financing live
Cash to close
- Down payment
- $58,750
- Closing costs
- $7,050
- Reserves months
- —
- Total cash needed
- —
Loan-product check · same deal, 3 products live
Conventional
25% down · 7.5% · 30yr
- Down + closing
- —
- Monthly P&I
- —
- Monthly cashflow
- —
- DSCR
- —
- Eligible?
- —
Personal DTI + credit; lowest rate.
DSCR
20% down · 8.5% · 30yr
- Down + closing
- —
- Monthly P&I
- —
- Monthly cashflow
- —
- DSCR
- —
- Eligible?
- —
No personal income docs; deal must DSCR.
Hard money
10% down · 12.0% · 12mo
- Down + closing
- —
- Monthly P&I
- —
- Monthly cashflow
- —
- DSCR
- —
- Eligible?
- —
Short-term bridge; refi at stabilization.
Rent comps 10 comps
| Address | Beds | Baths | Sqft | Rent | $/sqft | DOM | Units | Dist |
|---|---|---|---|---|---|---|---|---|
| 4872 Bristol Rock Rd Black Jack, MO | 4.0 | 2.0 | 1448 | $2,061 | $1.42 | 3d | 1 | 0.45mi |
| 11635 Hazeloak Dr Black Jack, MO | 3.0 | 2.0 | 1124 | $1,728 | $1.54 | 19d | 1 | 0.47mi |
| 4583 Whisper Lake Dr Black Jack, MO | 1.0–5.0 | 1.0–2.5 | 1225 | $1,364 | $1.11 | 0d | 18 | 0.58mi |
| 4440 Parker Rd Black Jack, MO | 3.0 | 2.0 | 1900 | $1,711 | $0.90 | 3d | 1 | 0.63mi |
| 2544 Netherton Dr Saint Louis, MO | 3.0 | 2.0 | 1288 | $1,945 | $1.51 | 0d | 1 | 1.19mi |
| 1536 Springlet Ct #31 Florissant, MO | 3.0 | 2.5 | 1161 | $1,450 | $1.25 | 0d | 1 | 1.24mi |
| 1536 Springlet Ct #31 Florissant, MO | 3.0 | 2.5 | 1161 | $1,450 | $1.25 | 9d | 1 | 1.24mi |
| 2257 Luxmore Dr Saint Louis, MO | 3.0 | 3.0 | 1073 | $1,495 | $1.39 | 25d | 1 | 1.44mi |
| 5364 Trailview Dr Black Jack, MO | 4.0 | 3.0 | 1992 | $2,330 | $1.17 | 23d | 1 | 1.46mi |
| 3585 Pershall Rd Unit Moor Ferguson, MO | 3.0 | 2.0 | 1577 | $1,500 | $0.95 | 45d | 1 | 1.46mi |
Listing history 15 events
-
2026-06-21days on market $235,000 Active 16 DOM
-
2026-06-18days on market $235,000 Active 13 DOM
-
2026-06-17days on market $235,000 Active 12 DOM
-
2026-06-16days on market $235,000 Active 11 DOM
-
2026-06-15days on market $235,000 Active 10 DOM
-
2026-06-13days on market $235,000 Active 8 DOM
-
2026-06-13days on market $235,000 Active 7 DOM
-
2026-06-09days on market $235,000 Active 4 DOM
-
2026-06-08days on market $235,000 Active 3 DOM
-
2026-06-07remarks 693-char remark
-
2026-06-07statusdays on market $235,000 Active 2 DOM
-
2026-06-05days on market $235,000 Coming Soon 3 DOM
-
2026-06-03days on market $235,000 Coming Soon 2 DOM
-
2026-06-02remarks 99-char remark
-
2026-06-02$235,000 Coming Soon 1 DOM
ⓘ Source: listings_history table (triggers on properties + properties_extension) + one-shot
backfill from property_details.listing_events for pre-trigger history.
Tax reassessment forecast MO · Resets to sale price
- Current annual tax
- $2,696 · $225/mo
- Projected year-2 tax
- $2,696 · $225/mo
- Expected delta
- $0/yr ($0/mo · 0.0%)
ⓘ Screening estimate from a state-policy table — verify with the county assessor before closing.
Climate risk First Street
- Flood 1/10 Low FEMA zone X (unshaded) · 0% chance over 30 yrs
- Wildfire 1/10 Low
- Heat 5/10 Major 7 d/yr ≥106°F today · 21 d/yr by 30 yrs out
- Wind 2/10 Low 100% chance of damaging wind over 30 yrs
- Air quality 3/10 Moderate 3 unhealthy d/yr today · 5 by 30 yrs out
Nearby sold comps map
Loading sold comps map…
Walkable amenities ~0.75 mi
Loading nearby amenities…
Taxation est. · year 1
- Rental income
- $22,782
- − Mortgage interest
- −$13,164
- − Property taxes
- −$2,696
- − Insurance
- −$1,175
- − Repairs & maintenance
- −$1,823
- − Management
- −$1,823
- − Depreciation
- −$6,836
- Taxable loss
- −$4,734
- Est. tax savings @ 24.0%
- +$1,136
- After-tax cash flow
- $475/yr
For passive investors: Depreciation is non-cash, so a rental often shows a tax loss while cash-flowing — sheltering income. Rental losses are passive: they offset passive income freely, and up to $25,000/yr can offset ordinary (W-2) income if you actively participate and your MAGI is under $100k (phasing out to $0 by $150k); unused losses carry forward. On sale, claimed depreciation is recaptured at up to 25%, and gains may owe capital-gains tax (a 1031 exchange can defer both). Figures are a year-1 estimate at your 24.0% rate — not tax advice; consult a CPA.
Schools (NCES district)
- District
- Hazelwood
- NCES district ID
- 2913830
- Math proficiency
- 11% ▼ -13.00%
- Reading proficiency
- 26% ▼ -6.00%
- Median HH income
- $51,621
- Composite
- 16.77/100
- National rank
- #9156
- State rank
- #306 of 324 in MO
Livability — Florissant
- Score
- 73/100
- State rank
- #82
- US rank
- #5406
Category grades
Schools grade is shown separately in the Schools card above.
Census & demographics
- County
- Saint Louis County · 888,823 people
- City population
- 69,104
- Metro
- St. Louis, MO-IL
- Population (ZIP)
- 43,056
- Household income
- $66,776
- Rent vs Own
- Severe rent burden
- 1429.0
Population outlook (St. Louis County) Hauer SSP2
- Today (2025)
- 1,025,227 people
- By 2030
- 1,028,023 · +0.3%
- By 2040
- 1,020,940 · -0.4%
- By 2050
- 1,007,280 · -1.8%
- By 2075
- 987,277 · -3.7%
- By 2100
- 921,984 · -10.1%
Race, ethnicity, and origin ACS 2023
- Neighborhood character
- Predominantly Black (71%)
- Race & ethnicity
- Black 71% White 23% Two or more races 4% Hispanic / Latino 1%
- Common ancestry
- Romanian 1% Lithuanian 1% Italian 1%
- Foreign-born
- 3% · Canada, Vietnam
- Languages at home
- 95% English-only · Spanish 1% French/Haitian/Cajun 1%
Political lean MEDSL · St. Louis
- 2024 margin
- Strong D (+23.4) · D 60.8% · R 37.4% · Other 1.7%
- 2008→2024 swing
- +3.5pp toward D · 2008: 19.9pp · 2024: 23.4pp
- All cycles
- 2024: D+23.4 2020: D+24.0 2016: D+16.2 2012: D+13.7 2008: D+19.9
Not yet ingested
- Civics
- —
Market trends
- HPI YoY
- ▲ 13.78%
- Current HPI
- 570.6
- Rent YoY
- ▲ 7.51%
- Metro
- St. Louis, MO-IL
- State GDP YoY
- ▲ 1.84%
- F500 in state
- 20
Industry mix (Fortune 500 HQ in MO)
| Industry | F500 HQs | Revenue |
|---|---|---|
| Healthcare | 1 | $163B |
|
||
| Insurance | 1 | $21B |
|
||
| Industrial Technology | 1 | $17B |
|
||
| Retail | 1 | $16B |
|
||
| Industrial Distribution | 1 | $10B |
|
||
| Utilities | 1 | $9B |
|
||
Price history
+201.3% since first listed11 events — show timeline
- 2026-06-02 Coming Soon $235,000 MARIS as Distributed by MLS Grid
- 2022-04-27 Price Changed $1,625 RENT.
- 2020-08-24 Sold (Public Records) $134,232 Public Records
- 2020-07-29 Pending — MARIS as Distributed by MLS Grid
- 2020-07-29 Sold (MLS) — MARIS as Distributed by MLS Grid
- 2020-06-29 Listed — MARIS as Distributed by MLS Grid
- 2020-06-08 Coming Soon $144,500 MARIS as Distributed by MLS Grid
- 2008-03-20 Sold (Public Records) $101,000 Public Records
- 2008-03-20 Sold (Public Records) $83,300 Public Records
- 2004-04-19 Sold (Public Records) $127,500 Public Records
- 1994-02-01 Sold (Public Records) $78,000 Public Records
Property tax history
+2.7%/yrLatest (2022): $2,696 · +5.6% YoY. Source: county tax records.
Cash-flow waterfall
monthlySold comps — $/sqft
last 12 mo · ≤1 miLoading sold comps…