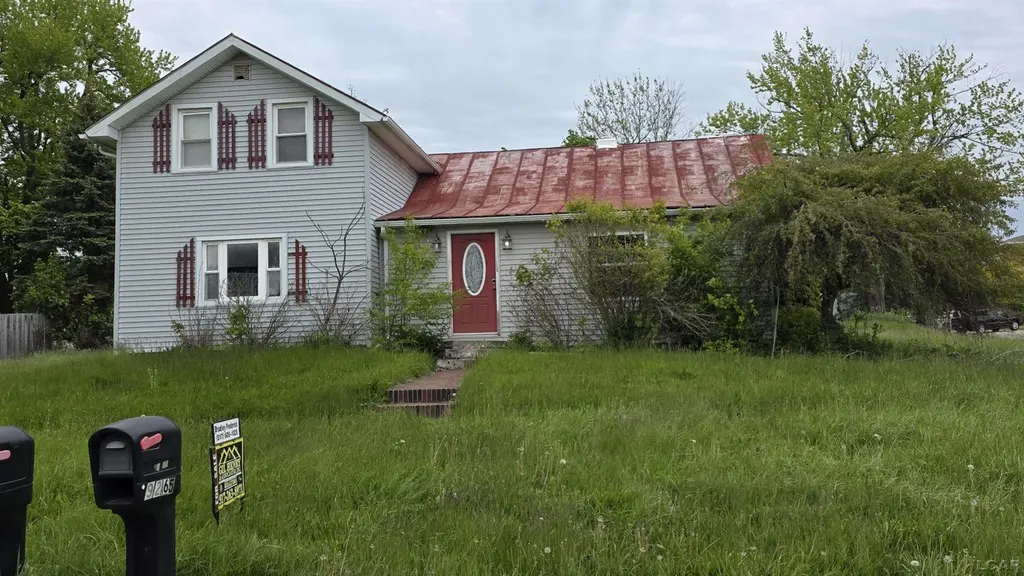
9358 E Market Rd · Pittsford, MI
Flood risk 1/10 · Minimal
- FEMA flood zone
- X (unshaded)
- Chance of flooding over 30 yrs
- 0.0%
- Est. flood insurance / yr
- $473 – $860
Fire risk 1/10 · Minimal
- Est. fire insurance / yr
- $784 – $1,456
Heat risk 3/10 · Minor
- Hot days now (above 97°F)
- 7 days/yr
- Hot days in 30 yrs
- 16 days/yr
Wind risk 2/10 · Minimal
- Chance of severe wind over 30 yrs
- —
Air-quality risk 2/10 · Minimal
- Unhealthy air days now
- 1 days/yr
- Unhealthy air days in 30 yrs
- 2 days/yr
Risk factors via First Street. Map © Google.
Why this score? — see what drove the B grade
The composite is a weighted blend of 9 inputs, each scored 0–100. Each bar is that input's sub-score; the figure is the points it added to the 100-point composite (weight × sub-score).
- Cash flow +30.0/30.0
- ARV discount +15.0/15.0
- DSCR +10.0/10.0
- 1% rule +7.4/10.0
- Schools +2.8/10.0
- Rent growth +2.5/5.0
- Livability +2.5/5.0
- Condition / age +2.5/5.0
- Appreciation +1.2/10.0
$99,900
🖨 Deal sheet 📄 Offer letter ✓ Due diligence
Listing remarks MLS
Spacious and full of potential! This 4 bedroom, 1.5 bath home sits on a large corner lot directly across from Pittsford Schools. Inside you’ll find a huge living room with plenty of space to gather, main level laundry for added convenience, and an enclosed porch perfect for relaxing year-round. Convenient location, generous living space, and room to make it your own — don’t miss this opportunity!
Key facts
- Main level laundry
- Enclosed porch
- Corner lot
Tags
Property features AI
Finance
- Other: Residential property type
- HOA & community: Homeowners association present
Exterior
- Utilities: Private well water; Public sewer
- Home design: Single-family residence; One-and-one-half story; Vinyl siding exterior
- Construction: Vinyl siding construction; One-and-one-half level design
- Exterior features: Lot about 0.42 acres (dimensions approx. 110 x 159); No pool
Interior
- Bathrooms: 1 full bathroom; 1 half bathroom
- Heating & cooling: Forced air heating (natural gas); Ceiling fans; Has cooling
- Interior features: 9 total rooms; Partial crawl space / partial basement
Neighborhood map
What this means for you Summary
Snapshot
- This is a 4-bed/1.0-bath single-family listed at $100k.
Deal economics
- At list price, monthly cash flow is $380 ($5k/yr) — positive.
- The deal already cash-flows at list — no discount required.
- Meets the 1% rule at list price ($1k rent vs $100k).
Location & tenants
- Location reads: area grade B — affects rentability + tenant quality, not the cash-flow math above.
- Pittsford Area Schools (rural): math 22% / reading 36% proficiency, ranked #542 of 760 in MI (top 71%) — low school quality limits family demand, transient renter base, plan for 1-2y turnover.
- Market conditions: 7 active listings in the ZIP; 72 units permitted in Hillsdale County in 2024 (0 in 5+ unit buildings).
Forward outlook
- Local home prices are declining (-3.0%/yr); year-one equity from $691 of loan paydown is wiped out by about $3k of value loss. Plan a longer hold.
- Hillsdale County population projected at -22% by 2050 — secular population decline; favor cash flow + early exit over multi-decade hold.
- At projected returns (-3.0% appreciation + 3.0% rent growth), your $28k cash investment doubles in ~8 years — after that, you're playing with house money.
Negotiation context
- Only 5 days on market — expect competitive offers; lowballing is unlikely to land.
- 22 sale attempts since 24y ago with the ask held roughly flat each time — persistent listings suggest the price (not the market) is what's stuck; bring a comps-based counter.
Risks & watch-outs
- Watch-outs: built in 1930 — expect roof / HVAC / electrical / plumbing capex.
Questions for the listing agent
- Built in 1930 — when were the roof, HVAC, electrical panel, plumbing, and water heater last replaced?
- Is there a deadline driving the sale (1031 exchange, divorce, estate, relocation)? That informs how much negotiation room exists.
- What's the average days-on-market for RENTAL listings here right now (not sales)? A rising rental-DOM trend means longer vacancies and softer asking-rent achievability than the comps imply.
- What's the recent tenant-quality profile in this submarket — average credit score on applications, eviction rate, late-payment / NSF rate, and stable-employment percentage? A property-management company in the area should have these aggregated.
- How much new for-sale + rental construction is in the pipeline within 1–3 miles? Heavy new supply typically softens prices + rents 12–24 months out; constrained supply supports both.
Investment metrics
- 1% rule
- 1.24% ✓
- Cap rate
- 10.86%
- Cash-on-cash
- 16.30%
- DSCR
- 1.73
- GRM
- 6.7
CMA / ARV
- ARV (on-the-fly)
- $123,930
- Comps found
- 2
Show comp detail 2 sales within ~0.75 mi
| Address | Dist | Beds/Ba | Sqft | Sold | Price | $/sf | Match |
|---|---|---|---|---|---|---|---|
| 4320 Ann St | 0.35mi | 3/1.0 (-1) | 1,300 (-11%) | 17mo | $110,000 | $85 | 46 |
| 8879 W North Street St | 0.38mi | 3/2.0 (-1) | 1,603 (+10%) | 20mo | $120,000 | $75 | 40 |
Match score weights: distance 35% · size 25% · config 20% · recency 20%. Top-matched comps best support the ARV.
Projected returns pro-forma
-3.0% appreciation · 3.0% rent growth · sell at horizon
- IRR
- 7.3%
- Equity multiple
- 1.29×
- Total profit
- $7,973
- Equity at exit
- $14,895
- IRR
- 16.6%
- Equity multiple
- 2.36×
- Total profit
- $37,950
- Equity at exit
- $8,638
Cash invested: $27,972 (down + closing). Projections, not guarantees.
Landlord ↔ Tenant lean methodology
- Overall (STATE)
- 62 Landlord-Friendly
- State Michigan
- 62 Landlord-Friendly · EVEN
- County
- — inherits STATE
- City
- — inherits STATE
ZIP-level market 49271
- Home prices YoY
- -3.1%
- Active inventory
- 7
- Price-to-rent
- 6.7×
Monthly cashflow live
- Estimated rent
- $1,239 medium interval (Pro) →
- Mortgage (P&I)
- −$524
- Tax from tax record
- −$34 /mo · $403/yr
- Insurance
- −$42
- HOA
- −$0
- Vacancy / Maint / Mgmt
- −$260
- Net cashflow
- $380
Break-even live
UW: 25.0% down · 7.5% · 30yr · 1.5% tax · 5.0% vac · 8.0% maint · 8.0% mgmt
Financing live
Cash to close
- Down payment
- $24,975
- Closing costs
- $2,997
- Reserves months
- —
- Total cash needed
- —
Loan-product check · same deal, 3 products live
Conventional
25% down · 7.5% · 30yr
- Down + closing
- —
- Monthly P&I
- —
- Monthly cashflow
- —
- DSCR
- —
- Eligible?
- —
Personal DTI + credit; lowest rate.
DSCR
20% down · 8.5% · 30yr
- Down + closing
- —
- Monthly P&I
- —
- Monthly cashflow
- —
- DSCR
- —
- Eligible?
- —
No personal income docs; deal must DSCR.
Hard money
10% down · 12.0% · 12mo
- Down + closing
- —
- Monthly P&I
- —
- Monthly cashflow
- —
- DSCR
- —
- Eligible?
- —
Short-term bridge; refi at stabilization.
Listing history 50 events
-
2026-06-01status $99,900 Pending 5 DOM
-
2026-06-01days on market $99,900 Active 5 DOM
-
2026-05-31days on market $99,900 Active 4 DOM
-
2026-05-31days on market $99,900 Active 3 DOM
-
2026-05-27$99,900 Active
Show marketing remark (417 chars)
Spacious and full of potential! This 4 bedroom, 1.5 bath home sits on a large corner lot directly across from Pittsford Schools. Inside you’ll find a huge living room with plenty of space to gather, main level laundry for added convenience, and an enclosed porch perfect for relaxing year-round. Convenient location, generous living space, and room to make it your own — don’t miss this opportunity!
-
2026-05-27$99,900 Active 417-char remark
Show marketing remark (417 chars)
Spacious and full of potential! This 4 bedroom, 1.5 bath home sits on a large corner lot directly across from Pittsford Schools. Inside you’ll find a huge living room with plenty of space to gather, main level laundry for added convenience, and an enclosed porch perfect for relaxing year-round. Convenient location, generous living space, and room to make it your own — don’t miss this opportunity!
-
2025-08-26historical
-
2025-08-14price $149,000
-
2025-08-13price $149,000
-
2025-07-31price $154,000
-
2025-07-31price $154,000
-
2025-05-21$160,000 Active
-
2025-05-21$160,000 Active
-
2023-06-16soldstatus $137,694
-
2023-06-14soldstatus $137,694 Sold
-
2023-06-14soldstatus $137,694 Sold
-
2023-05-18historical Accepting Backup Offers
-
2023-05-18historical Accepting Backup Offers
-
2023-05-18historical Active - Backup Offers Accepted
-
2023-04-24$129,900 Active
-
2023-04-24$129,900 Active
-
2023-04-24$129,900 Active
-
2019-11-18soldstatus $95,500
-
2015-12-13historical
-
2015-08-19soldstatus $23,000
-
2015-08-19soldstatus $23,000
-
2015-08-19soldstatus $23,000
-
2015-07-21historical
-
2015-03-31$29,000
-
2015-03-31$29,000
-
2015-03-31$29,000
-
2012-03-04historical
-
2011-06-04$48,000
-
2011-06-04$48,000
-
2011-06-04$48,000
-
2007-10-23soldstatus $35,000
-
2007-10-23soldstatus $35,000
-
2007-10-23soldstatus $35,000
-
2007-10-23soldstatus $35,000
-
2007-10-23soldstatus $35,000
-
2007-10-23soldstatus $35,000
-
2007-10-18historical
-
2007-10-17historical
-
2007-08-14$39,900
-
2007-08-14$39,900
-
2007-08-14$39,900
-
2007-08-14$39,900
-
2007-08-14$39,900
-
2007-08-14$39,900
-
2002-07-31soldstatus $69,900
ⓘ Source: listings_history table (triggers on properties + properties_extension) + one-shot
backfill from property_details.listing_events for pre-trigger history.
Tax reassessment forecast MI · Partial reset (capped growth)
- Current annual tax
- $403 · $34/mo
- Projected year-2 tax
- $971 · $81/mo
- Expected delta
- +$568/yr (+$47/mo · 140.9%)
ⓘ Screening estimate from a state-policy table — verify with the county assessor before closing.
Climate risk First Street
- Flood 1/10 Low FEMA zone X (unshaded) · 0% chance over 30 yrs
- Wildfire 1/10 Low
- Heat 3/10 Moderate 7 d/yr ≥97°F today · 16 d/yr by 30 yrs out
- Wind 2/10 Low
- Air quality 2/10 Low 1 unhealthy d/yr today · 2 by 30 yrs out
Nearby sold comps map
Loading sold comps map…
Walkable amenities ~0.75 mi
Loading nearby amenities…
Taxation est. · year 1
- Rental income
- $14,871
- − Mortgage interest
- −$5,596
- − Property taxes
- −$403
- − Insurance
- −$500
- − Repairs & maintenance
- −$1,190
- − Management
- −$1,190
- − Depreciation
- −$2,906
- Taxable income
- $3,087
- Est. tax owed @ 24.0%
- −$741
- After-tax cash flow
- $3,818/yr
For passive investors: Depreciation is non-cash, so a rental often shows a tax loss while cash-flowing — sheltering income. Rental losses are passive: they offset passive income freely, and up to $25,000/yr can offset ordinary (W-2) income if you actively participate and your MAGI is under $100k (phasing out to $0 by $150k); unused losses carry forward. On sale, claimed depreciation is recaptured at up to 25%, and gains may owe capital-gains tax (a 1031 exchange can defer both). Figures are a year-1 estimate at your 24.0% rate — not tax advice; consult a CPA.
Schools (NCES district)
- District
- Pittsford Area Schools
- NCES district ID
- 2628500
- Math proficiency
- 22% ▲ 13.00%
- Reading proficiency
- 36% ▲ 18.00%
- Median HH income
- $46,221
- Composite
- 27.86/100
- National rank
- #12283
- State rank
- #542 of 760 in MI
Livability — Pittsford
No livability data for this city. (Only ~50 U.S. cities are tracked.)
Census & demographics
- Census place
- Pittsford, MI
- Population (ZIP)
- 2,354
Population outlook (Hillsdale County) Hauer SSP2
- Today (2025)
- 43,704 people
- By 2030
- 41,996 · -3.9%
- By 2040
- 38,019 · -13.0%
- By 2050
- 34,095 · -22.0%
- By 2075
- 25,897 · -40.7%
- By 2100
- 18,746 · -57.1%
Race, ethnicity, and origin ACS 2023
- Neighborhood character
- Predominantly White (96%)
- Race & ethnicity
- White 96% Two or more races 3%
- Common ancestry
- Romanian 5% Lithuanian 3% Iranian 1%
- Foreign-born
- 1%
Political lean MEDSL · Hillsdale
- 2024 margin
- Solid R (+51.4) · D 23.7% · R 75.1% · Other 1.2%
- 2008→2024 swing
- -39.4pp toward R · 2008: -12.0pp · 2024: -51.4pp
- All cycles
- 2024: R+51.4 2020: R+47.9 2016: R+46.8 2012: R+24.2 2008: R+12.0
Not yet ingested
- Civics
- —
Market trends
- HPI YoY
- ▼ -7.54%
- Current HPI
- 235.009
- Rent YoY
- —
- Metro
- —
- State GDP YoY
- ▲ 1.37%
- F500 in state
- 28
Industry mix (Fortune 500 HQ in MI)
| Industry | F500 HQs | Revenue |
|---|---|---|
| Automotive Parts | 3 | $48B |
|
||
| Automotive | 2 | $372B |
|
||
| Chemicals | 1 | $45B |
|
||
| Automotive Retail | 1 | $29B |
|
||
| Healthcare / Medical Devices | 1 | $23B |
|
||
| Automotive Technology | 1 | $20B |
|
||
Price history
+42.9% since first listed52 events — show timeline
- 2026-05-27 Listed $99,900 REALCOMP
- 2026-05-27 Listed $99,900 MiRealSource-MiMLS
- 2025-08-26 Listing Removed — MiRealSource-MiMLS
- 2025-08-14 Price Changed $149,000 MiRealSource-MiMLS
- 2025-08-13 Price Changed $149,000 REALCOMP
- 2025-07-31 Price Changed $154,000 MiRealSource-MiMLS
- 2025-07-31 Price Changed $154,000 REALCOMP
- 2025-05-21 Listed $160,000 MiRealSource-MiMLS
- 2025-05-21 Listed $160,000 REALCOMP
- 2023-06-16 Sold (Public Records) $137,694 Public Records
- 2023-06-14 Sold (MLS) $137,694 SW Michigan MLS
- 2023-06-14 Sold (MLS) $137,694 REALCOMP
- 2023-05-18 Contingent — MiRealSource-MiMLS
- 2023-05-18 Contingent — REALCOMP
- 2023-05-18 Contingent — SW Michigan MLS
- 2023-04-24 Listed $129,900 SW Michigan MLS
- 2023-04-24 Listed $129,900 MiRealSource-MiMLS
- 2023-04-24 Listed $129,900 REALCOMP
- 2019-11-18 Sold (Public Records) $95,500 Public Records
- 2015-12-13 Listing Removed — SW Michigan MLS
- 2015-08-19 Sold (MLS) $23,000 MiRealSource-MiMLS
- 2015-08-19 Sold (MLS) $23,000 SW Michigan MLS
- 2015-08-19 Sold (MLS) $23,000 REALCOMP
- 2015-07-21 Listing Removed — MiRealSource-MiMLS
- 2015-03-31 Listed $29,000 MiRealSource-MiMLS
- 2015-03-31 Listed $29,000 SW Michigan MLS
- 2015-03-31 Listed $29,000 REALCOMP
- 2012-03-04 Listing Removed — MiRealSource-MiMLS
- 2011-06-04 Listed $48,000 REALCOMP
- 2011-06-04 Listed $48,000 MiRealSource-MiMLS
- 2011-06-04 Listed $48,000 SW Michigan MLS
- 2007-10-23 Sold (MLS) $35,000 REALCOMP
- 2007-10-23 Sold (MLS) $35,000 REALCOMP
- 2007-10-23 Sold (MLS) $35,000 MiRealSource-MiMLS
- 2007-10-23 Sold (MLS) $35,000 MiRealSource-MiMLS
- 2007-10-23 Sold (MLS) $35,000 SW Michigan MLS
- 2007-10-23 Sold (MLS) $35,000 SW Michigan MLS
- 2007-10-18 Listing Removed — MiRealSource-MiMLS
- 2007-10-17 Listing Removed — MiRealSource-MiMLS
- 2007-08-14 Listed $39,900 REALCOMP
- 2007-08-14 Listed $39,900 REALCOMP
- 2007-08-14 Listed $39,900 MiRealSource-MiMLS
- 2007-08-14 Listed $39,900 MiRealSource-MiMLS
- 2007-08-14 Listed $39,900 SW Michigan MLS
- 2007-08-14 Listed $39,900 SW Michigan MLS
- 2002-07-31 Sold (MLS) $69,900 MiRealSource-MiMLS
- 2002-07-31 Sold (MLS) $69,900 REALCOMP
- 2002-07-31 Sold (MLS) $69,900 SW Michigan MLS
- 2002-06-18 Listing Removed — MiRealSource-MiMLS
- 2002-06-18 Listed $69,900 MiRealSource-MiMLS
- 2002-06-18 Listed $69,900 REALCOMP
- 2002-06-18 Listed $69,900 SW Michigan MLS
Property tax history
-1.6%/yrLatest (2025): $403 · -50.8% YoY. Source: county tax records.
Cash-flow waterfall
monthlySold comps — $/sqft
last 12 mo · ≤1 miLoading sold comps…