 🌊 Lakefront
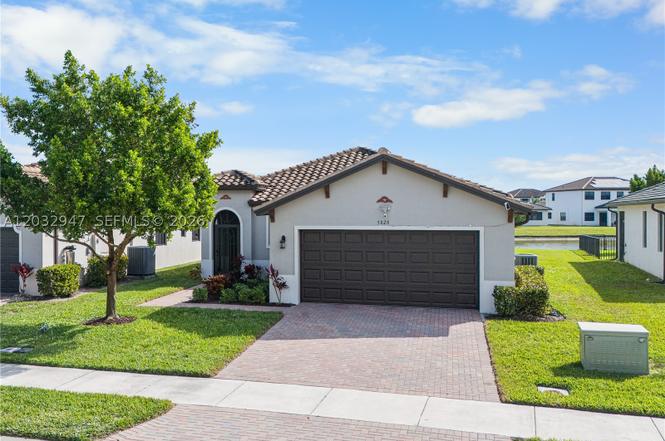
5028 Arancia Ln · Ave Maria, FL
Flood risk 1/10 · Minimal
- FEMA flood zone
- AH
- Chance of flooding over 30 yrs
- 0.0%
- Est. flood insurance / yr
- $1,142 – $2,507
Fire risk 5/10 · Moderate
- Est. fire insurance / yr
- $947 – $1,759
Heat risk 9/10 · Severe
- Hot days now (above 111°F)
- 7 days/yr
- Hot days in 30 yrs
- 26 days/yr
Wind risk 10/10 · Severe
- Chance of severe wind over 30 yrs
- 99.0%
Air-quality risk 2/10 · Minimal
- Unhealthy air days now
- 0 days/yr
- Unhealthy air days in 30 yrs
- 1 days/yr
Risk factors via First Street. Map © Google.
Why this score? — see what drove the D+ grade
The composite is a weighted blend of 9 inputs, each scored 0–100. Each bar is that input's sub-score; the figure is the points it added to the 100-point composite (weight × sub-score).
- Cash flow +16.4/30.0
- DSCR +5.1/10.0
- Schools +5.0/10.0
- 1% rule +4.9/10.0
- Appreciation +4.5/10.0
- Rent growth +3.2/5.0
- Livability +2.5/5.0
- Condition / age +2.5/5.0
- ARV discount +2.0/15.0
$389,000
🖨 Deal sheet 📄 Offer letter ✓ Due diligence
Listing remarks
Gorgeous One-Story lakeview home located in the desirable Maple Ridge, Ave Maria Community. Spacious open floor plan flows into a modern kitchen equipped with stainless steel appliances. Natural light throughout the entire house with tasteful finishes. Step outside to enjoy the backyard, screened patio and a serene lake view, ideal for relaxing and entertaining. This community offers resort style amenities which include pool, playgrounds, fitness center, tennis and pickle ball courts. Very close to Ave Maria's Town Center. Easy to show.
Key facts
- Screened patio
- Backyard
- Modern kitchen
Tags
Property features AI
Finance
- Financial info: Pets allowed
- HOA & community: Quarterly association fee ($203) covering common area maintenance, recreation facilities and trash; Community amenities: clubhouse, fitness center, game room, maintained community, park, pickleball, pool, sidewalks, tennis courts
Exterior
- Parking: Attached 2-car garage with garage door opener; Covered parking (2 spaces)
- Security: Storm/security shutters
- Utilities: Public water; Public sewer; Cable available; Underground utilities
- Home design: Single-family home; One story; Resale; Birch model
- Construction: Block construction; Spanish tile roof
- Exterior features: Enclosed porch; Screened porch; Patio; Paver block; Storm/security shutters; Canal-front waterfront; Automatic sprinklers; Less than quarter-acre lot; North-facing
Interior
- Kitchen: Electric range; Self-cleaning oven; Microwave; Dishwasher; Refrigerator; Garbage disposal; Pantry
- Bedrooms: Main level bedrooms (includes primary on main level)
- Flooring: Carpet; Tile
- Bathrooms: 2 full bathrooms; 1 half bathroom
- Heating & cooling: Central heating; Central air conditioning; Electric water heater
- Interior features: Plantation shutters; First-floor entry; Main-level primary bedroom; Bedroom on main level; Breakfast area; Living/dining room; Pantry; Dual sinks; Split bedroom floor plan; Shower-only bath; Attic
- Laundry & utility: Washer; Dryer; Utility room
Neighborhood map
What this means for you Summary
Snapshot
- This is a 3-bed/2.5-bath single-family listed at $389k.
Deal economics
- At list price, monthly cash flow is $70 ($840/yr) — positive.
- The deal already cash-flows at list — no discount required.
- To meet the 1% rule (rent ≥ 1% of price), the offer needs to be $387k (0.6% below list).
- Recommended offer: $387k (0.6% below list) — sets the bar for 1% rule.
Location & tenants
- Location reads: area grade D — affects rentability + tenant quality, not the cash-flow math above.
- Collier (suburban): math 60% / reading 56% proficiency, ranked #16 of 73 in FL (top 22%) — acceptable for families but not a draw, mixed tenant base, ~2y average lease.
- Market conditions: Rents rising (+3.0%/yr); 449 active listings in the ZIP; 40 comparable units currently listed for rent nearby; rentals at typical pace (median 24d on market — plan ~3-4 weeks tenant-placement turnaround); 3,520 units permitted in Collier County in 2024 (959 in 5+ unit buildings).
- At $3,865/mo this rent would consume 74% of the median local household income ($62k/yr) (locally 1093% of renters already pay >50% of income on rent) — very limited rent-growth headroom before tenants either downsize or default.
Forward outlook
- Local home prices are declining (-1.1%/yr); year-one equity from $3k of loan paydown is wiped out by about $4k of value loss. Plan a longer hold.
- Collier County population projected at +30% by 2050 — long-run rental-demand tailwind backs the buy-and-hold thesis.
Negotiation context
- Only 1 days on market — expect competitive offers; lowballing is unlikely to land.
- 2 sale attempts with the ask held roughly flat each time — persistent listings suggest the price (not the market) is what's stuck; bring a comps-based counter.
Risks & watch-outs
- Watch-outs: flood insurance adds $152/mo.
- Climate carrying-cost: in FEMA flood zone AH (mandatory federal flood insurance); severe wind risk, 99% chance of damaging wind over 30y; moderate wildfire risk; extreme-heat days projected 7→26/yr by 2055 (HVAC capex compounding) — expect insurance premiums to compound above CPI over the hold.
Questions for the listing agent
- What's the actual annual flood-insurance premium (NFIP or private), and is the property in a SFHA with mandatory coverage?
- What does the HOA fee cover, when was the last increase, and are there any pending special assessments or reserve-fund shortfalls?
- Is there a deadline driving the sale (1031 exchange, divorce, estate, relocation)? That informs how much negotiation room exists.
- The area grade is low — what's the realistic commute time and amenity access for the typical tenant pool here? Any planned neighborhood developments (good or bad) we should know about?
- This sits on a lake — are riparian / water-frontage rights deeded with the parcel? Any dock permits, shoreline easements, or HOA water-use restrictions?
- What's the documented flood / surge / shoreline-erosion history here (FEMA AND non-FEMA — e.g., storm surge, creek backup, septic-field saturation)?
- Any water-quality or seasonal algae-bloom issues that affect tenant satisfaction or short-term-rental demand?
- What's the average days-on-market for RENTAL listings here right now (not sales)? A rising rental-DOM trend means longer vacancies and softer asking-rent achievability than the comps imply.
- What's the recent tenant-quality profile in this submarket — average credit score on applications, eviction rate, late-payment / NSF rate, and stable-employment percentage? A property-management company in the area should have these aggregated.
- How much new for-sale + rental construction is in the pipeline within 1–3 miles? Heavy new supply typically softens prices + rents 12–24 months out; constrained supply supports both.
Investment metrics
- 1% rule
- 0.99% ✗
- Cap rate
- 6.98%
- Cash-on-cash
- 2.45%
- DSCR
- 1.11
- GRM
- 8.4
CMA / ARV
- ARV (on-the-fly)
- $346,834
- Comps found
- 1
Show comp detail 1 sale within ~0.75 mi
| Address | Dist | Beds/Ba | Sqft | Sold | Price | $/sf | Match |
|---|---|---|---|---|---|---|---|
| 4432 Steinbeck Way | 0.68mi | 4/2.5 (+1) | 1,959 (+14%) | 18mo | $395,000 | $202 | 25 |
Match score weights: distance 35% · size 25% · config 20% · recency 20%. Top-matched comps best support the ARV.
Projected returns pro-forma
-1.05% appreciation · 2.95% rent growth · sell at horizon
- IRR
- -5.4%
- Equity multiple
- 0.76×
- Total profit
- $-25,630
- Equity at exit
- $93,000
- IRR
- 1.4%
- Equity multiple
- 1.13×
- Total profit
- $14,418
- Equity at exit
- $96,892
Cash invested: $108,920 (down + closing). Projections, not guarantees.
Landlord ↔ Tenant lean methodology
- Overall (STATE)
- 87 Strongly Landlord-Friendly
- State Florida
- 87 Strongly Landlord-Friendly · R+3
- County
- — inherits STATE
- City
- — inherits STATE
ZIP-level market 34142
- Home prices YoY
- -0.5%
- Rents YoY
- 3.0%
- Active inventory
- 449
- Price-to-rent
- 8.4×
Monthly cashflow live
- Estimated rent
- $3,865 high interval (Pro) →
- Mortgage (P&I)
- −$2,040
- Tax from tax record
- −$561 /mo · $6,736/yr
- Insurance
- −$162
- Flood insurance flood zone
- −$152 /mo · $1,824/yr
- HOA
- −$68
- Vacancy / Maint / Mgmt
- −$812
- Net cashflow
- $70
Break-even live
UW: 25.0% down · 7.5% · 30yr · 1.5% tax · 5.0% vac · 8.0% maint · 8.0% mgmt
Financing live
Cash to close
- Down payment
- $97,250
- Closing costs
- $11,670
- Reserves months
- —
- Total cash needed
- —
Loan-product check · same deal, 3 products live
Conventional
25% down · 7.5% · 30yr
- Down + closing
- —
- Monthly P&I
- —
- Monthly cashflow
- —
- DSCR
- —
- Eligible?
- —
Personal DTI + credit; lowest rate.
DSCR
20% down · 8.5% · 30yr
- Down + closing
- —
- Monthly P&I
- —
- Monthly cashflow
- —
- DSCR
- —
- Eligible?
- —
No personal income docs; deal must DSCR.
Hard money
10% down · 12.0% · 12mo
- Down + closing
- —
- Monthly P&I
- —
- Monthly cashflow
- —
- DSCR
- —
- Eligible?
- —
Short-term bridge; refi at stabilization.
Rent comps 40 comps
| Address | Beds | Baths | Sqft | Rent | $/sqft | DOM | Units | Dist |
|---|---|---|---|---|---|---|---|---|
| 5032 Arancia Ln Ave Maria, FL | 3.0 | 2.0 | 1525 | $2,595 | $1.70 | 14d | 1 | 0.02mi |
| 4546 Battlecreek Way Ave Maria, FL | 3.0 | 2.5 | 2104 | $3,900 | $1.85 | 23d | 1 | 0.44mi |
| 4881 Gambero Way Ave Maria, FL | 3.0 | 2.5 | 2037 | $2,800 | $1.37 | 10d | 1 | 0.50mi |
| 4925 Gambero Way Ave Maria, FL | 2.0 | 2.0 | 1525 | $4,000 | $2.62 | 23d | 1 | 0.53mi |
| 5265 Messina St Ave Maria, FL | 3.0 | 2.5 | 1929 | $4,995 | $2.59 | 23d | 1 | 0.55mi |
| 4957 Gambero Way Unit 4957 Ave Maria, FL | 4.0 | 3.0 | 1500 | $3,400 | $2.27 | 12d | 1 | 0.56mi |
| 5089 Penella Ave Ave Maria, FL | 3.0 | 2.5 | 2028 | $2,300 | $1.13 | 14d | 1 | 0.58mi |
| 5187 Nevola Ave Ave Maria, FL | 3.0 | 2.5 | 1680 | $2,700 | $1.61 | 21d | 1 | 0.62mi |
| 5322 Nevola Ave Ave Maria, FL | 3.0 | 3.0 | 1918 | $2,700 | $1.41 | 14d | 1 | 0.63mi |
| 5376 Fancourt Links Way Ave Maria, FL | 2.0 | 2.5 | 1850 | $6,850 | $3.70 | 21d | 1 | 0.67mi |
| 5068 Annunciation Cir #4201 Ave Maria, FL | 2.0 | 2.0 | 1266 | $3,400 | $2.69 | 23d | 1 | 0.70mi |
| 5076 Annunciation Cir #2206 Ave Maria, FL | 2.0 | 2.0 | 1206 | $3,100 | $2.57 | 23d | 1 | 0.70mi |
| 5076 Annunciation Cir #2305 Ave Maria, FL | 2.0 | 2.0 | 1166 | $2,800 | $2.40 | 23d | 1 | 0.70mi |
| 5522 Hampton Links Ct Ave Maria, FL | 2.0 | 2.5 | 1850 | $3,995 | $2.16 | 23d | 1 | 0.73mi |
| 5080 Annunciation Cir #1306 Ave Maria, FL | 3.0 | 2.0 | 1700 | $4,500 | $2.65 | 23d | 1 | 0.74mi |
| 5374 Ferris Ave Ave Maria, FL | 3.0 | 2.5 | 1933 | $2,350 | $1.22 | 23d | 1 | 0.76mi |
| 5412 Fancourt Links Way Ave Maria, FL | 4.0 | 3.0 | 2247 | $8,000 | $3.56 | 21d | 1 | 0.77mi |
| 5545 Hampton Links Ct Ave Maria, FL | 4.0 | 3.0 | 2247 | $8,500 | $3.78 | 23d | 1 | 0.77mi |
| 5538 Hampton Links Ct Ave Maria, FL | 3.0 | 3.0 | 2247 | $6,295 | $2.80 | 21d | 1 | 0.77mi |
| 5428 Fancourt Links Way Ave Maria, FL | 3.0 | 3.0 | 2247 | $7,895 | $3.51 | 21d | 1 | 0.81mi |
| 5538 Useppa Dr Ave Maria, FL | 2.0 | 2.5 | 1850 | $10,995 | $5.94 | 23d | 1 | 0.84mi |
| 5435 Pikewood Ct Ave Maria, FL | 2.0 | 2.5 | 1850 | $3,695 | $2.00 | 21d | 1 | 0.84mi |
| 5444 Fancourt Links Way Ave Maria, FL | 3.0 | 3.0 | 2247 | $3,995 | $1.78 | 21d | 1 | 0.85mi |
| 5583 Double Eagle Cir Ave Maria, FL | 2.0 | 2.0 | 1239 | $2,495 | $2.01 | 23d | 1 | 0.87mi |
| 5661 Melbourne Ct #8011 Ave Maria, FL | 3.0 | 2.0 | 1741 | $7,295 | $4.19 | 12d | 1 | 0.87mi |
| 5527 Double Eagle Cir Unit 3838 Ave Maria, FL | 3.0 | 2.0 | 1301 | $2,295 | $1.76 | 23d | 1 | 0.87mi |
| 5527 Double Eagle Cir Unit 3815 Ave Maria, FL | 2.0 | 2.0 | 1120 | $5,795 | $5.17 | 23d | 1 | 0.88mi |
| 5427 Double Eagle Cir #2825 Ave Maria, FL | 2.0 | 2.0 | 1355 | $6,295 | $4.65 | 23d | 1 | 0.88mi |
| 5427 Double Eagle Cir #2822 Ave Maria, FL | 2.0 | 2.0 | 1355 | $5,795 | $4.28 | 23d | 1 | 0.88mi |
| 5427 Double Eagle Cir #2826 Ave Maria, FL | 2.0 | 2.0 | 1569 | $6,495 | $4.14 | 23d | 1 | 0.88mi |
| 5427 Double Eagle Cir #2815 Ave Maria, FL | 2.0 | 2.0 | 1400 | $2,700 | $1.93 | 23d | 1 | 0.88mi |
| 5445 Double Eagle Cir Ave Maria, FL | 2.0 | 2.0 | 1355 | $2,995 | $2.21 | 23d | 1 | 0.88mi |
| 5583 Double Eagle Cir #4135 Ave Maria, FL | 2.0 | 2.0 | 1120 | $2,195 | $1.96 | 23d | 1 | 0.88mi |
| 5583 Double Eagle Cir Unit 4118 Ave Maria, FL | 3.0 | 2.0 | 1301 | $4,700 | $3.61 | 23d | 1 | 0.88mi |
| 5583 Double Eagle Cir Unit 4143 Ave Maria, FL | 2.0 | 2.0 | 1120 | $5,795 | $5.17 | 23d | 1 | 0.88mi |
| 5583 Double Eagle Cir #4137 Ave Maria, FL | 2.0 | 2.0 | 1154 | $5,795 | $5.02 | 21d | 1 | 0.88mi |
| 5445 Double Eagle Cir #3013 Ave Maria, FL | 2.0 | 2.0 | 1366 | $2,595 | $1.90 | 21d | 1 | 0.89mi |
| 5445 Double Eagle Cir #3026 Ave Maria, FL | 2.0 | 2.0 | 1569 | $2,350 | $1.50 | 21d | 1 | 0.89mi |
| 5555 Double Eagle Cir #3918 Ave Maria, FL | 3.0 | 2.0 | 1301 | $5,995 | $4.61 | 23d | 1 | 0.89mi |
| 5555 Double Eagle Cir #3913 Ave Maria, FL | 2.0 | 2.0 | 1154 | $2,100 | $1.82 | 23d | 1 | 0.89mi |
HOA detail
- Monthly dues
- $68 · $816/yr
- Likely covers
- landscapingpoolgym
Listing history 2 events
-
2026-06-17remarks 542-char remark
-
2026-06-17$389,000 Active 1 DOM
ⓘ Source: listings_history table (triggers on properties + properties_extension) + one-shot
backfill from property_details.listing_events for pre-trigger history.
Tax reassessment forecast FL · Resets to sale price
- Current annual tax
- $6,736 · $561/mo
- Projected year-2 tax
- $6,736 · $561/mo
- Expected delta
- $0/yr ($0/mo · 0.0%)
ⓘ Screening estimate from a state-policy table — verify with the county assessor before closing.
Climate risk First Street
- Flood 1/10 Low FEMA zone AH · 0% chance over 30 yrs
- Wildfire 5/10 Major
- Heat 9/10 Extreme 7 d/yr ≥111°F today · 26 d/yr by 30 yrs out
- Wind 10/10 Extreme 99% chance of damaging wind over 30 yrs
- Air quality 2/10 Low 0 unhealthy d/yr today · 1 by 30 yrs out
Nearby sold comps map
Loading sold comps map…
Walkable amenities ~0.75 mi
Loading nearby amenities…
Taxation est. · year 1
- Rental income
- $46,382
- − Mortgage interest
- −$21,790
- − Property taxes
- −$6,736
- − Insurance
- −$3,770
- − Repairs & maintenance
- −$3,711
- − Management
- −$3,711
- − HOA
- −$816
- − Depreciation
- −$11,316
- Taxable loss
- −$5,467
- Est. tax savings @ 24.0%
- +$1,312
- After-tax cash flow
- $2,153/yr
For passive investors: Depreciation is non-cash, so a rental often shows a tax loss while cash-flowing — sheltering income. Rental losses are passive: they offset passive income freely, and up to $25,000/yr can offset ordinary (W-2) income if you actively participate and your MAGI is under $100k (phasing out to $0 by $150k); unused losses carry forward. On sale, claimed depreciation is recaptured at up to 25%, and gains may owe capital-gains tax (a 1031 exchange can defer both). Figures are a year-1 estimate at your 24.0% rate — not tax advice; consult a CPA.
Schools (NCES district)
- District
- Collier
- NCES district ID
- 1200330
- Math proficiency
- 60% ▼ -4.00%
- Reading proficiency
- 56% ▼ -2.00%
- Median HH income
- $58,275
- Composite
- 50.23/100
- National rank
- #1892
- State rank
- #16 of 73 in FL
Livability — Ave Maria
No livability data for this city. (Only ~50 U.S. cities are tracked.)
Census & demographics
- Census place
- Ave Maria, FL
- County
- Collier County · 396,295 people
- Metro
- Naples-Marco Island, FL
- Population (ZIP)
- 35,149
- Household income
- $62,333
- Rent vs Own
- Severe rent burden
- 1093.0
Population outlook (Collier County) Hauer SSP2
- Today (2025)
- 420,858 people
- By 2030
- 450,054 · +6.9%
- By 2040
- 502,232 · +19.3%
- By 2050
- 544,932 · +29.5%
- By 2075
- 627,203 · +49.0%
- By 2100
- 659,015 · +56.6%
Race, ethnicity, and origin ACS 2023
- Neighborhood character
- Majority Hispanic (63%)
- Race & ethnicity
- Hispanic / Latino 63% Two or more races 39% Black 19% White 16% Native American 7%
- Hispanic origin (detail)
- Mexican 43% Puerto Rican 3% Cuban 2% Dominican 1%
- Common ancestry
- Hispanic 8% Slovak 1% Serbian 1%
- Foreign-born
- 32% · Canada, Jamaica
- Languages at home
- 34% English-only · Spanish 53% French/Haitian/Cajun 12%
Political lean MEDSL · Collier
- 2024 margin
- Solid R (+33.1) · D 33.1% · R 66.2%
- 2008→2024 swing
- -10.6pp toward R · 2008: -22.5pp · 2024: -33.1pp
- All cycles
- 2024: R+33.1 2020: R+24.7 2016: R+26.0 2012: R+30.1 2008: R+22.5
Not yet ingested
- Civics
- —
Market trends
- HPI YoY
- ▼ -1.05%
- Current HPI
- 226.9105
- Rent YoY
- ▲ 2.95%
- Metro
- Naples-Marco Island, FL
- State GDP YoY
- ▲ 3.28%
- F500 in state
- 36
Industry mix (Fortune 500 HQ in FL)
| Industry | F500 HQs | Revenue |
|---|---|---|
| Industrial Technology | 2 | $29B |
|
||
| Insurance | 2 | $17B |
|
||
| Retail | 1 | $60B |
|
||
| Technology Distribution | 1 | $58B |
|
||
| Homebuilding | 1 | $35B |
|
||
| Technology Manufacturing | 1 | $35B |
|
||
Price history
-25.9% since first listed4 events — show timeline
- 2026-06-17 Listed $389,000 MARMLS
- 2025-06-01 Listing Removed — MARMLS
- 2025-04-02 Price Changed $495,000 MARMLS
- 2025-02-19 Listed $525,000 MARMLS
Property tax history
+19.0%/yrLatest (2025): $6,736 · +9.2% YoY. Source: county tax records.
Cash-flow waterfall
monthlySold comps — $/sqft
last 12 mo · ≤1 miLoading sold comps…