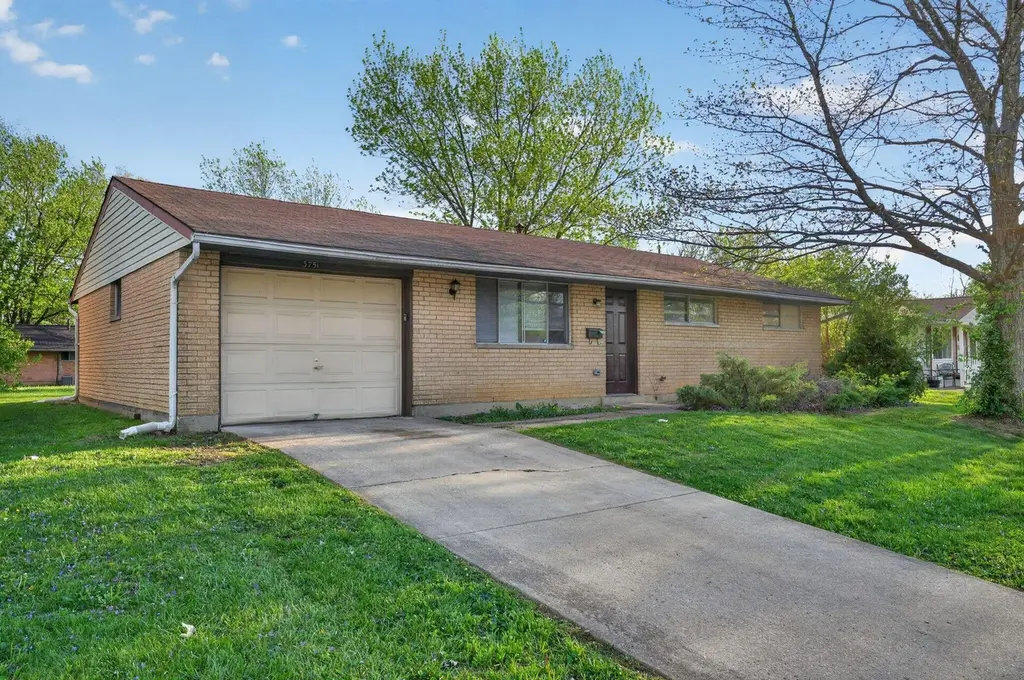
3751 Caracas Dr · Huber Ridge, OH
Flood risk 1/10 · Minimal
- FEMA flood zone
- X (unshaded)
- Chance of flooding over 30 yrs
- 0.0%
- Est. flood insurance / yr
- $507 – $1,088
Fire risk 1/10 · Minimal
- Est. fire insurance / yr
- $713 – $1,323
Heat risk 3/10 · Minor
- Hot days now (above 100°F)
- 7 days/yr
- Hot days in 30 yrs
- 18 days/yr
Wind risk 2/10 · Minimal
- Chance of severe wind over 30 yrs
- 0.0%
Air-quality risk 3/10 · Minor
- Unhealthy air days now
- 2 days/yr
- Unhealthy air days in 30 yrs
- 4 days/yr
Risk factors via First Street. Map © Google.
Why this score? — see what drove the C- grade
The composite is a weighted blend of 9 inputs, each scored 0–100. Each bar is that input's sub-score; the figure is the points it added to the 100-point composite (weight × sub-score).
- Cash flow +16.0/30.0
- ARV discount +15.0/15.0
- Schools +5.2/10.0
- DSCR +5.0/10.0
- 1% rule +4.6/10.0
- Livability +3.8/5.0
- Condition / age +2.5/5.0
- Rent growth +2.4/5.0
- Appreciation +0.0/10.0
$234,900
🖨 Deal sheet 📄 Offer letter ✓ Due diligence
Listing remarks MLS
Discover this well-maintained ranch-style home in the desirable Huber Ridge community! This classic residence features a bright, open living area and a functional floor plan designed for easy single-level living. The exterior boasts timeless curb appeal with an attached 1-car garage and a spacious backyard on a 0.17-acre lot. Enjoy the benefit of no municipal income tax in Blendon Township while staying minutes from Uptown Westerville, parks, and shopping.
Key facts
- Spacious backyard
- Ranch-style home
- Open living area
Tags
Neighborhood map
What this means for you Summary
Snapshot
- This is a 4-bed/2.0-bath single-family listed at $235k.
Deal economics
- At list price, monthly cash flow is $117 ($1k/yr) — positive.
- The deal already cash-flows at list — no discount required.
- To meet the 1% rule (rent ≥ 1% of price), the offer needs to be $225k (4.2% below list).
- Recommended offer: $221k (6.0% below list) — sets the bar for market timing.
- Cap rate 6.9% vs local median 5.0% in Huber Ridge — top-decile yield for the area; either an underpriced asset or a hidden risk that comps aren't pricing in. Stress-test before assuming the spread holds.
Location & tenants
- Location reads 75/100 on livability (#255 in OH, #4,049 nationally) — a middle-class / working-renter tenant base. Strengths: cost of living A+, housing A+, crime A-; Watch: amenities D, commute F.
- Westerville City (suburban): math 54% / reading 63% proficiency, ranked #276 of 656 in OH (top 42%) — acceptable for families but not a draw, mixed tenant base, ~2y average lease.
- Market conditions: Rents soft (-0.6%/yr); 169 active listings in the ZIP; 7 comparable units currently listed for rent nearby; rentals lingering (median 44d on market — plan ~5-8 weeks vacancy on turnover, expect pricing pressure); 57% of comp listings sitting > 30 days — soft ceiling on asking rent; solid renter incomes; 8,139 units permitted in Franklin County in 2024 (5,940 in 5+ unit buildings).
Forward outlook
- Local home prices are declining (-3.0%/yr); year-one equity from $2k of loan paydown is wiped out by about $7k of value loss. Plan a longer hold.
- Franklin County population projected at +34% by 2050 — long-run rental-demand tailwind backs the buy-and-hold thesis.
Negotiation context
- It's been on market 62 days — a 6% lower offer ($221k) is reasonable based on typical stale-listing flexibility.
Questions for the listing agent
- It's been on market 62 days. Have you received any prior offers? Is the seller open to a 6% concession, seller financing, or rate buy-down credit?
- Built in 1963 — when were the roof, HVAC, electrical panel, plumbing, and water heater last replaced?
- Why hasn't it sold? Are there any deal-killer items the seller is aware of (foundation, flood, title, zoning, code violations)?
- Is there a deadline driving the sale (1031 exchange, divorce, estate, relocation)? That informs how much negotiation room exists.
- What's the average days-on-market for RENTAL listings here right now (not sales)? A rising rental-DOM trend means longer vacancies and softer asking-rent achievability than the comps imply.
- What's the recent tenant-quality profile in this submarket — average credit score on applications, eviction rate, late-payment / NSF rate, and stable-employment percentage? A property-management company in the area should have these aggregated.
- How much new for-sale + rental construction is in the pipeline within 1–3 miles? Heavy new supply typically softens prices + rents 12–24 months out; constrained supply supports both.
Investment metrics
- 1% rule
- 0.96% ✗
- Cap rate
- 6.89%
- Cash-on-cash
- 2.14%
- DSCR
- 1.10
- GRM
- 8.7
CMA / ARV
- ARV (median comp)
- $289,512
- List price
- $234,900
- Delta
- -18.86%
- Verdict
- UNDERPRICED
- Comps
- 20 within 1.0 mi
Show comp detail 12 sales within ~0.75 mi
| Address | Dist | Beds/Ba | Sqft | Sold | Price | $/sf | Match |
|---|---|---|---|---|---|---|---|
| 5769 Montevideo Rd | 0.06mi | 3/1.0 (-1) | 1,026 (0%) | 7mo | $250,000 | $244 | 82 |
| 3719 Caracas Dr | 0.08mi | 3/2.0 (-1) | 1,080 (+5%) | 6mo | $267,569 | $248 | 78 |
| 3660 Managua Dr | 0.28mi | 3/2.0 (-1) | 1,026 (0%) | 9mo | $303,000 | $295 | 75 |
| 3630 Stockholm Rd | 0.34mi | 3/2.0 (-1) | 1,026 (0%) | 12mo | $304,000 | $296 | 69 |
| 5888 Montevideo Rd | 0.16mi | 3/2.0 (-1) | 936 (-9%) | 6mo | $268,000 | $286 | 68 |
| 5799 Buenos Aires Blvd | 0.33mi | 3/2.0 (-1) | 1,053 (+3%) | 15mo | $287,000 | $273 | 63 |
| 3509 Canberra Ct | 0.60mi | 3/1.0 (-1) | 1,026 (0%) | 3mo | $249,900 | $244 | 61 |
| 3535 Paris Blvd | 0.52mi | 3/2.0 (-1) | 1,080 (+5%) | 7mo | $275,000 | $255 | 56 |
| 3487 Saddle Ln S | 0.61mi | 3/1.0 (-1) | 1,064 (+4%) | 4mo | $299,900 | $282 | 53 |
| 6082 Bolamo Ct | 0.31mi | 3/1.0 (-1) | 936 (-9%) | 12mo | $225,000 | $240 | 52 |
| 5904 Dakar Rd E | 0.65mi | 3/1.0 (-1) | 988 (-4%) | 12mo | $285,000 | $288 | 45 |
| 366 Saint Thomas Dr | 0.70mi | 3/1.5 (-1) | 1,162 (+13%) | 12mo | $361,000 | $311 | 29 |
Match score weights: distance 35% · size 25% · config 20% · recency 20%. Top-matched comps best support the ARV.
Projected returns pro-forma
-3.0% appreciation · 0.0% rent growth · sell at horizon
- IRR
- -16.4%
- Equity multiple
- 0.44×
- Total profit
- $-37,134
- Equity at exit
- $35,024
- IRR
- -14.9%
- Equity multiple
- 0.27×
- Total profit
- $-47,977
- Equity at exit
- $20,310
Cash invested: $65,772 (down + closing). Projections, not guarantees.
Landlord ↔ Tenant lean methodology
- Overall (STATE)
- 73 Landlord-Friendly
- State Ohio
- 73 Landlord-Friendly · R+6
- County
- — inherits STATE
- City
- — inherits STATE
ZIP-level market 43081
- Rents YoY
- -0.6%
- Active inventory
- 169
- Price-to-rent
- 8.7×
Monthly cashflow live
- Estimated rent
- $2,250 high interval (Pro) →
- Mortgage (P&I)
- −$1,232
- Tax from tax record
- −$331 /mo · $3,970/yr
- Insurance
- −$98
- HOA
- −$0
- Vacancy / Maint / Mgmt
- −$473
- Net cashflow
- $117
Break-even live
UW: 25.0% down · 7.5% · 30yr · 1.5% tax · 5.0% vac · 8.0% maint · 8.0% mgmt
Financing live
Cash to close
- Down payment
- $58,725
- Closing costs
- $7,047
- Reserves months
- —
- Total cash needed
- —
Loan-product check · same deal, 3 products live
Conventional
25% down · 7.5% · 30yr
- Down + closing
- —
- Monthly P&I
- —
- Monthly cashflow
- —
- DSCR
- —
- Eligible?
- —
Personal DTI + credit; lowest rate.
DSCR
20% down · 8.5% · 30yr
- Down + closing
- —
- Monthly P&I
- —
- Monthly cashflow
- —
- DSCR
- —
- Eligible?
- —
No personal income docs; deal must DSCR.
Hard money
10% down · 12.0% · 12mo
- Down + closing
- —
- Monthly P&I
- —
- Monthly cashflow
- —
- DSCR
- —
- Eligible?
- —
Short-term bridge; refi at stabilization.
Rent comps 7 comps
| Address | Beds | Baths | Sqft | Rent | $/sqft | DOM | Units | Dist |
|---|---|---|---|---|---|---|---|---|
| 3553 Triton Ct Westerville, OH | 3.0 | 2.0 | 1188 | $2,600 | $2.19 | 43d | 1 | 0.51mi |
| 3553 Triton Ct Westerville, OH | 3.0 | 2.0 | 1200 | $2,600 | $2.17 | 2d | 1 | 0.51mi |
| 5415 Turtle Sta Westerville, OH | 2.0–3.0 | 2.0–2.5 | 1600 | $2,425 | $1.52 | 1d | 33 | 1.06mi |
| 3311 Kristin Ct Unit 3311 Columbus, OH | 3.0 | 1.5 | 1100 | $1,450 | $1.32 | 43d | 1 | 1.15mi |
| 5500 Hildebrand Rd Columbus, OH | 1.0–3.0 | 1.0–2.0 | 917 | $1,890 | $2.06 | 43d | 1 | 1.42mi |
| 10 King Arthur Ct Westerville, OH | 3.0 | 2.0 | 1164 | $1,747 | $1.50 | 43d | 1 | 1.46mi |
| 20 King Arthur Ct Unit 20 Westerville, OH | 3.0 | 1.5 | 1164 | $1,700 | $1.46 | 2d | 1 | 1.49mi |
Listing history 15 events
-
2026-06-18days on market $234,900 Active 62 DOM
-
2026-06-17days on market $234,900 Active 61 DOM
-
2026-06-16days on market $234,900 Active 60 DOM
-
2026-06-15days on market $234,900 Active 59 DOM
-
2026-06-13days on market $234,900 Active 57 DOM
-
2026-06-09days on market $234,900 Active 53 DOM
-
2026-06-08days on market $234,900 Active 52 DOM
-
2026-06-07pricedays on market $234,900 Active 51 DOM
-
2026-06-03days on market $249,900 Active 47 DOM
-
2026-06-02days on market $249,900 Active 46 DOM
-
2026-06-01days on market $249,900 Active 45 DOM
-
2026-05-31days on market $249,900 Active 44 DOM
-
2026-05-14price $249,900 460-char remark
Show marketing remark (460 chars)
Discover this well-maintained ranch-style home in the desirable Huber Ridge community! This classic residence features a bright, open living area and a functional floor plan designed for easy single-level living. The exterior boasts timeless curb appeal with an attached 1-car garage and a spacious backyard on a 0.17-acre lot. Enjoy the benefit of no municipal income tax in Blendon Township while staying minutes from Uptown Westerville, parks, and shopping.
-
2026-04-17$254,900 Active 460-char remark
Show marketing remark (460 chars)
Discover this well-maintained ranch-style home in the desirable Huber Ridge community! This classic residence features a bright, open living area and a functional floor plan designed for easy single-level living. The exterior boasts timeless curb appeal with an attached 1-car garage and a spacious backyard on a 0.17-acre lot. Enjoy the benefit of no municipal income tax in Blendon Township while staying minutes from Uptown Westerville, parks, and shopping.
-
2024-11-19soldstatus $20,974,000
ⓘ Source: listings_history table (triggers on properties + properties_extension) + one-shot
backfill from property_details.listing_events for pre-trigger history.
Tax reassessment forecast OH · Partial reset (capped growth)
- Current annual tax
- $3,970 · $331/mo
- Projected year-2 tax
- $3,970 · $331/mo
- Expected delta
- $0/yr ($0/mo · 0.0%)
ⓘ Screening estimate from a state-policy table — verify with the county assessor before closing.
Climate risk First Street
- Flood 1/10 Low FEMA zone X (unshaded) · 0% chance over 30 yrs
- Wildfire 1/10 Low
- Heat 3/10 Moderate 7 d/yr ≥100°F today · 18 d/yr by 30 yrs out
- Wind 2/10 Low 0% chance of damaging wind over 30 yrs
- Air quality 3/10 Moderate 2 unhealthy d/yr today · 4 by 30 yrs out
Nearby sold comps map
Loading sold comps map…
Walkable amenities ~0.75 mi
Loading nearby amenities…
Taxation est. · year 1
- Rental income
- $27,005
- − Mortgage interest
- −$13,158
- − Property taxes
- −$3,970
- − Insurance
- −$1,174
- − Repairs & maintenance
- −$2,160
- − Management
- −$2,160
- − Depreciation
- −$6,833
- Taxable loss
- −$2,452
- Est. tax savings @ 24.0%
- +$589
- After-tax cash flow
- $1,996/yr
For passive investors: Depreciation is non-cash, so a rental often shows a tax loss while cash-flowing — sheltering income. Rental losses are passive: they offset passive income freely, and up to $25,000/yr can offset ordinary (W-2) income if you actively participate and your MAGI is under $100k (phasing out to $0 by $150k); unused losses carry forward. On sale, claimed depreciation is recaptured at up to 25%, and gains may owe capital-gains tax (a 1031 exchange can defer both). Figures are a year-1 estimate at your 24.0% rate — not tax advice; consult a CPA.
Schools (NCES district)
- District
- Westerville City
- NCES district ID
- 3904504
- Math proficiency
- 54% ▼ -16.00%
- Reading proficiency
- 63% ▼ -6.00%
- Median HH income
- $72,017
- Composite
- 51.9/100
- National rank
- #1649
- State rank
- #276 of 656 in OH
Livability — Huber Ridge
- Score
- 75/100
- State rank
- #255
- US rank
- #4049
Category grades
Schools grade is shown separately in the Schools card above.
Census & demographics
- Census place
- Huber Ridge, OH
- County
- Franklin County · 1,351,780 people
- Metro
- Columbus, OH
- Population (ZIP)
- 65,020
- Household income
- $92,422
- Rent vs Own
- Severe rent burden
- 1746.0
Population outlook (Franklin County) Hauer SSP2
- Today (2025)
- 1,456,139 people
- By 2030
- 1,556,890 · +6.9%
- By 2040
- 1,757,349 · +20.7%
- By 2050
- 1,950,539 · +34.0%
- By 2075
- 2,376,171 · +63.2%
- By 2100
- 2,636,796 · +81.1%
Race, ethnicity, and origin ACS 2023
- Neighborhood character
- Predominantly White (72%)
- Race & ethnicity
- White 72% Black 14% Two or more races 7% Asian 5% Hispanic / Latino 4%
- Common ancestry
- Italian 4% Romanian 3% Lithuanian 2%
- Foreign-born
- 10% · Canada, China
- Languages at home
- 88% English-only · Spanish 2% Other Indo-European 2% Other Asian/Pacific 1%
Political lean MEDSL · Franklin
- 2024 margin
- Strong D (+28.4) · D 63.7% · R 35.3% · Other 1.0%
- 2008→2024 swing
- +7.7pp toward D · 2008: 20.7pp · 2024: 28.4pp
- All cycles
- 2024: D+28.4 2020: D+31.4 2016: D+25.9 2012: D+21.7 2008: D+20.7
Not yet ingested
- Civics
- —
Market trends
- HPI YoY
- ▼ -275.55%
- Current HPI
- 259.862
- Rent YoY
- ▼ -0.56%
- Metro
- Columbus, OH
- State GDP YoY
- ▲ 1.98%
- F500 in state
- 48
Industry mix (Fortune 500 HQ in OH)
| Industry | F500 HQs | Revenue |
|---|---|---|
| Insurance | 3 | $145B |
|
||
| Industrial Machinery | 3 | $49B |
|
||
| Financial Services | 3 | $24B |
|
||
| Consumer Goods | 2 | $93B |
|
||
| Aerospace / Defense | 2 | $47B |
|
||
| Utilities | 2 | $33B |
|
||
Price history
-98.8% since first listed3 events — show timeline
- 2026-05-14 Price Changed $249,900 CBRMLS
- 2026-04-17 Listed $254,900 CBRMLS
- 2024-11-19 Sold (Public Records) $20,974,000 Public Records
Property tax history
+3.2%/yrLatest (2024): $3,970 · +2.1% YoY. Source: county tax records.
Cash-flow waterfall
monthlySold comps — $/sqft
last 12 mo · ≤1 miLoading sold comps…