 Duplex
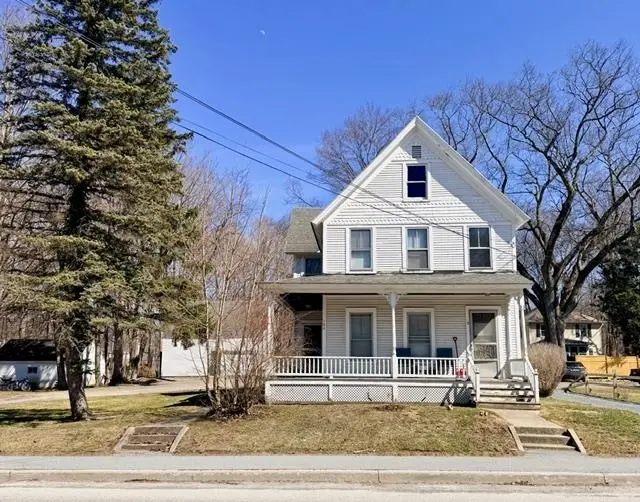
124 S Branch St · Bennington, VT
Flood risk 1/10 · Minimal
- FEMA flood zone
- X (unshaded)
- Chance of flooding over 30 yrs
- 0.0%
- Est. flood insurance / yr
- $507 – $1,088
Fire risk 2/10 · Minimal
- Est. fire insurance / yr
- $480 – $892
Heat risk 3/10 · Minor
- Hot days now (above 88°F)
- 7 days/yr
- Hot days in 30 yrs
- 16 days/yr
Wind risk 3/10 · Minor
- Chance of severe wind over 30 yrs
- 6.0%
Air-quality risk 2/10 · Minimal
- Unhealthy air days now
- 0 days/yr
- Unhealthy air days in 30 yrs
- 1 days/yr
Risk factors via First Street. Map © Google.
Why this score? — see what drove the C grade
The composite is a weighted blend of 9 inputs, each scored 0–100. Each bar is that input's sub-score; the figure is the points it added to the 100-point composite (weight × sub-score).
- Cash flow +29.1/30.0
- DSCR +10.0/10.0
- 1% rule +7.5/10.0
- Schools +5.0/10.0
- Livability +3.2/5.0
- Rent growth +2.5/5.0
- Condition / age +2.5/5.0
- ARV discount +0.0/15.0
- Appreciation +0.0/10.0
$279,000
🖨 Deal sheet 📄 Offer letter ✓ Due diligence
Multi-family units
County records classify this as Multi-Family (2-4 Unit). Listing-text estimate: 2 units. confirmed
Listing remarks
Don’t miss this two-family gem! Each spacious unit features 2 bedrooms, eat-in kitchen, large living room with hardwood floors and tin ceiling throughout, spacious full bathroom, and in-unit laundry hookups—perfect for comfortable living or strong rental potential. The downstairs unit offers a side porch for sitting and both units get to enjoy a charming covered front porch on a side street. With a level lot just over half-acre, off-street parking, and 1 car garage/barn with additional storage, plus a prime location near downtown shops and restaurants, this is an ideal opportunity for both investors and owner-occupants!
Key facts
- Covered front porch
- Tin ceiling
- Eat-in kitchen
Tags
Property features AI
Finance
- Financial info: Two-unit building with annual leases
Exterior
- Parking: 1-car garage
- Utilities: Public water; Public sewer; Cable available; High-speed internet available
- Home design: Multi-family property; Existing building; Built in 1875
- Construction: Wood siding; Asphalt shingle roof; Unfinished basement (walkout)
- Exterior features: Level, neighborhood lot; Gravel driveway
Interior
- Kitchen: Unit 1: Dishwasher, Electric range, Refrigerator; Unit 2: Electric range, Refrigerator
- Bedrooms: Two 2-bedroom units (Unit 1 on level 1, Unit 2 on level 2)
- Bathrooms: Two full bathrooms (one in each unit)
- Heating & cooling: Steam heat; No central air conditioning
- Interior features: Walkout unfinished basement
- Laundry & utility: 100 Amp electrical service
Neighborhood map
What this means for you Summary
Snapshot
- This is a 2 × 2-bed/1.0-bath units multifamily listed at $279k.
Deal economics
- At list price, monthly cash flow is $961 ($12k/yr) — positive. Per door: $481/mo.
- The deal already cash-flows at list — no discount required.
- Meets the 1% rule at list price ($3k rent vs $279k).
- Recommended offer: $262k (6.0% below list) — sets the bar for market timing.
- Cap rate 10.4% vs local median 5.4% in Bennington — top-decile yield for the area; either an underpriced asset or a hidden risk that comps aren't pricing in. Stress-test before assuming the spread holds.
Location & tenants
- Location reads 64/100 on livability (#63 in VT) — a middle-class / working-renter tenant base. Strengths: housing A+, health & safety A+, cost of living A; Watch: employment C-, crime D, schools F.
- Market conditions: 65 active listings in the ZIP; 59 units permitted in Bennington County in 2024 (0 in 5+ unit buildings).
- At $3,496/mo this rent would consume 70% of the median local household income ($60k/yr) (locally 982% of renters already pay >50% of income on rent) — very limited rent-growth headroom before tenants either downsize or default.
Forward outlook
- Local home prices are declining (-3.0%/yr); year-one equity from $2k of loan paydown is wiped out by about $8k of value loss. Plan a longer hold.
- Bennington County population projected at -23% by 2050 — secular population decline; favor cash flow + early exit over multi-decade hold.
- At projected returns (-3.0% appreciation + 3.0% rent growth), your $78k cash investment doubles in ~8 years — after that, you're playing with house money.
Negotiation context
- It's been on market 79 days — a 6% lower offer ($262k) is reasonable based on typical stale-listing flexibility.
- Current owner paid $95k; list at $279k implies a 194% gain — meaningful room to come down on a strong offer.
Risks & watch-outs
- Watch-outs: built in 1875 — expect roof / HVAC / electrical / plumbing capex.
Questions for the listing agent
- It's been on market 79 days. Have you received any prior offers? Is the seller open to a 6% concession, seller financing, or rate buy-down credit?
- Can we see the unit-by-unit rent roll, current vacancy, and any below-market leases? What's the average tenancy length?
- What capital expenditures (roof, boiler, parking lot, exteriors) have been made in the last 5 years, and what's planned in the next 2?
- Built in 1875 — when were the roof, HVAC, electrical panel, plumbing, and water heater last replaced?
- Why hasn't it sold? Are there any deal-killer items the seller is aware of (foundation, flood, title, zoning, code violations)?
- Is there a deadline driving the sale (1031 exchange, divorce, estate, relocation)? That informs how much negotiation room exists.
- Schools are F-rated, which usually means shorter tenancies and higher turnover. Who's the typical renter profile here, and what's been the actual vacancy rate?
- Crime grade is D in this area — have there been break-ins, vandalism, or insurance claims at this property in the last 3 years? What carrier currently insures it and at what premium?
- What's the average days-on-market for RENTAL listings here right now (not sales)? A rising rental-DOM trend means longer vacancies and softer asking-rent achievability than the comps imply.
- What's the recent tenant-quality profile in this submarket — average credit score on applications, eviction rate, late-payment / NSF rate, and stable-employment percentage? A property-management company in the area should have these aggregated.
- How much new apartment / multifamily construction is in the pipeline within 1–3 miles? Heavy new supply (>2% of stock underway) typically softens rents 12–24 months out; light construction supports rent growth.
Investment metrics
- 1% rule
- 1.25% ✓
- Cap rate
- 10.43%
- Cash-on-cash
- 14.77%
- DSCR
- 1.66
- GRM
- 6.7
CMA / ARV
- ARV (on-the-fly)
- $230,508
- Comps found
- 6
Show comp detail 6 sales within ~0.75 mi
| Address | Dist | Beds/Ba | Sqft | Sold | Price | $/sf | Match |
|---|---|---|---|---|---|---|---|
| 121 Bradford St | 0.21mi | 5/3.0 | 2,178 (+8%) | 16mo | $260,000 | $119 | 60 |
| 317 Pleasant St | 0.52mi | 5/2.0 | 2,201 (+9%) | 1mo | $185,000 | $84 | 60 |
| 1004 Main St | 0.35mi | 5/3.0 | 1,872 (-7%) | 13mo | $213,200 | $114 | 57 |
| 216 Union St | 0.58mi | 4/3.0 (-1) | 1,887 (-7%) | 20mo | $62,000 | $33 | 36 |
| 304-306 Grove St | 0.52mi | 5/3.0 | 1,810 (-10%) | 23mo | $291,000 | $161 | 35 |
| 215 School St | 0.72mi | 4/2.0 (-1) | 1,718 (-15%) | 23mo | $165,000 | $96 | 17 |
Match score weights: distance 35% · size 25% · config 20% · recency 20%. Top-matched comps best support the ARV.
Projected returns pro-forma
-3.0% appreciation · 3.0% rent growth · sell at horizon
- IRR
- 5.3%
- Equity multiple
- 1.20×
- Total profit
- $15,985
- Equity at exit
- $41,600
- IRR
- 14.7%
- Equity multiple
- 2.19×
- Total profit
- $92,646
- Equity at exit
- $24,123
Cash invested: $78,120 (down + closing). Projections, not guarantees.
Landlord ↔ Tenant lean methodology
- Overall (STATE)
- 41 Moderately Tenant-Leaning
- State Vermont
- 41 Moderately Tenant-Leaning · D+15
- County
- — inherits STATE
- City
- — inherits STATE
ZIP-level market 05201
- Home prices YoY
- -19.3%
- Active inventory
- 65
- Price-to-rent
- 13.3×
Monthly cashflow live
- Estimated rent
- $3,496 medium interval (Pro) →
- Mortgage (P&I)
- −$1,463
- Tax from tax record
- −$221 /mo · $2,655/yr
- Insurance
- −$116
- HOA
- −$0
- Vacancy / Maint / Mgmt
- −$734
- Net cashflow
- $961
Break-even live
2-unit breakdown (identical units grouped — click to expand)
| Units | Beds | Baths | Est. rent |
|---|---|---|---|
| 2× units | 2 | 1 | $3,496 |
| #1 | 2 | 1 | $1,748 |
| #2 | 2 | 1 | $1,748 |
| Total (2 units) | $3,496 | ||
UW: 25.0% down · 7.5% · 30yr · 1.5% tax · 5.0% vac · 8.0% maint · 8.0% mgmt
Financing live
Cash to close
- Down payment
- $69,750
- Closing costs
- $8,370
- Reserves months
- —
- Total cash needed
- —
Loan-product check · same deal, 3 products live
Conventional
25% down · 7.5% · 30yr
- Down + closing
- —
- Monthly P&I
- —
- Monthly cashflow
- —
- DSCR
- —
- Eligible?
- —
Personal DTI + credit; lowest rate.
DSCR
20% down · 8.5% · 30yr
- Down + closing
- —
- Monthly P&I
- —
- Monthly cashflow
- —
- DSCR
- —
- Eligible?
- —
No personal income docs; deal must DSCR.
Hard money
10% down · 12.0% · 12mo
- Down + closing
- —
- Monthly P&I
- —
- Monthly cashflow
- —
- DSCR
- —
- Eligible?
- —
Short-term bridge; refi at stabilization.
Listing history 19 events
-
2026-06-19days on market $279,000 Active 79 DOM
-
2026-06-18days on market $279,000 Active 78 DOM
-
2026-06-17days on market $279,000 Active 77 DOM
-
2026-06-16days on market $279,000 Active 76 DOM
-
2026-06-15days on market $279,000 Active 75 DOM
-
2026-06-14days on market $279,000 Active 73 DOM
-
2026-06-12days on market $279,000 Active 72 DOM
-
2026-06-09days on market $279,000 Active 69 DOM
-
2026-06-08days on market $279,000 Active 68 DOM
-
2026-06-07days on market $279,000 Active 67 DOM
-
2026-06-07days on market $279,000 Active 66 DOM
-
2026-06-04days on market $279,000 Active 63 DOM
-
2026-06-02days on market $279,000 Active 62 DOM
-
2026-06-01days on market $279,000 Active 61 DOM
-
2026-05-31days on market $279,000 Active 60 DOM
-
2026-05-31days on market $279,000 Active 59 DOM
-
2026-05-21price $279,000
-
2026-04-01$295,000 Active
-
2003-07-23soldstatus $95,000
ⓘ Source: listings_history table (triggers on properties + properties_extension) + one-shot
backfill from property_details.listing_events for pre-trigger history.
Tax reassessment forecast VT · Partial reset (capped growth)
- Current annual tax
- $2,655 · $221/mo
- Projected year-2 tax
- $3,978 · $332/mo
- Expected delta
- +$1,323/yr (+$110/mo · 49.8%)
ⓘ Screening estimate from a state-policy table — verify with the county assessor before closing.
Climate risk First Street
- Flood 1/10 Low FEMA zone X (unshaded) · 0% chance over 30 yrs
- Wildfire 2/10 Low
- Heat 3/10 Moderate 7 d/yr ≥88°F today · 16 d/yr by 30 yrs out
- Wind 3/10 Moderate 6% chance of damaging wind over 30 yrs
- Air quality 2/10 Low 0 unhealthy d/yr today · 1 by 30 yrs out
Nearby sold comps map
Loading sold comps map…
Walkable amenities ~0.75 mi
Loading nearby amenities…
Taxation est. · year 1
- Rental income
- $41,952
- − Mortgage interest
- −$15,628
- − Property taxes
- −$2,655
- − Insurance
- −$1,395
- − Repairs & maintenance
- −$3,356
- − Management
- −$3,356
- − Depreciation
- −$8,116
- Taxable income
- $7,445
- Est. tax owed @ 24.0%
- −$1,787
- After-tax cash flow
- $9,748/yr
For passive investors: Depreciation is non-cash, so a rental often shows a tax loss while cash-flowing — sheltering income. Rental losses are passive: they offset passive income freely, and up to $25,000/yr can offset ordinary (W-2) income if you actively participate and your MAGI is under $100k (phasing out to $0 by $150k); unused losses carry forward. On sale, claimed depreciation is recaptured at up to 25%, and gains may owe capital-gains tax (a 1031 exchange can defer both). Figures are a year-1 estimate at your 24.0% rate — not tax advice; consult a CPA.
Schools (NCES district)
No district data.
Livability — Bennington
- Score
- 64/100
- State rank
- #63
- US rank
- #14446
Category grades
Schools grade is shown separately in the Schools card above.
Census & demographics
- Census place
- Bennington, VT
- County
- Bennington County · 14,998 people
- City population
- 14,998
- Metro
- Bennington, VT
- Population (ZIP)
- 14,998
- Household income
- $59,798
- Rent vs Own
- Severe rent burden
- 982.0
Population outlook (Bennington County) Hauer SSP2
- Today (2025)
- 34,407 people
- By 2030
- 32,975 · -4.2%
- By 2040
- 29,711 · -13.6%
- By 2050
- 26,638 · -22.6%
- By 2075
- 21,318 · -38.0%
- By 2100
- 16,086 · -53.2%
Race, ethnicity, and origin ACS 2023
- Neighborhood character
- Predominantly White (92%)
- Race & ethnicity
- White 92% Two or more races 4% Hispanic / Latino 3%
- Common ancestry
- Lithuanian 10% Slovak 7% Romanian 3%
- Foreign-born
- 2% · Canada
- Languages at home
- 96% English-only · Spanish 2% Other Indo-European 1%
Political lean MEDSL · Bennington
- 2024 margin
- Strong D (+22.5) · D 60.0% · R 37.5% · Other 2.6%
- 2008→2024 swing
- -10.9pp toward R · 2008: 33.4pp · 2024: 22.5pp
- All cycles
- 2024: D+22.5 2020: D+27.3 2016: D+22.1 2012: D+33.3 2008: D+33.4
Not yet ingested
- Civics
- —
Market trends
- HPI YoY
- ▼ -60.78%
- Current HPI
- 254.5149
- Rent YoY
- —
- Metro
- Bennington, VT
- State GDP YoY
- —
- F500 in state
- 0
Price history
+193.7% since first listed3 events — show timeline
- 2026-05-21 Price Changed $279,000 PrimeMLS
- 2026-04-01 Listed $295,000 PrimeMLS
- 2003-07-23 Sold (Public Records) $95,000 Public Records
Property tax history
-3.0%/yrLatest (2024): $2,655 · +9.6% YoY. Source: county tax records.
Cash-flow waterfall
monthlySold comps — $/sqft
last 12 mo · ≤1 miLoading sold comps…