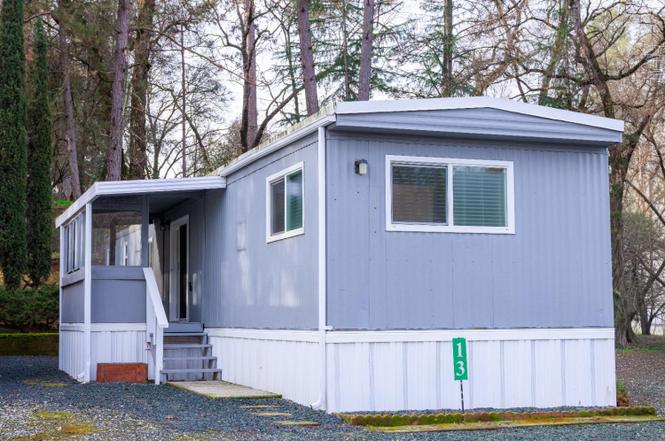
10251 Combie Rd #13 · Lake of the Pines, CA
Flood risk 7/10 · Major
- FEMA flood zone
- X (unshaded)
- Chance of flooding over 30 yrs
- 0.99%
- Est. flood insurance / yr
- $507 – $1,088
Fire risk 8/10 · Major
- Est. fire insurance / yr
- $659 – $1,223
Heat risk 6/10 · Moderate
- Hot days now (above 98°F)
- 7 days/yr
- Hot days in 30 yrs
- 15 days/yr
Wind risk 1/10 · Minimal
- Chance of severe wind over 30 yrs
- —
Air-quality risk 10/10 · Severe
- Unhealthy air days now
- 32 days/yr
- Unhealthy air days in 30 yrs
- 41 days/yr
Risk factors via First Street. Map © Google.
Why this score? — see what drove the B- grade
The composite is a weighted blend of 9 inputs, each scored 0–100. Each bar is that input's sub-score; the figure is the points it added to the 100-point composite (weight × sub-score).
- Cash flow +30.0/30.0
- 1% rule +10.0/10.0
- DSCR +10.0/10.0
- ARV discount +7.5/15.0
- Schools +3.8/10.0
- Livability +2.9/5.0
- Rent growth +2.5/5.0
- Condition / age +2.5/5.0
- Appreciation +0.0/10.0
$59,900
🖨 Deal sheet 📄 Offer letter ✓ Due diligence
Listing remarks
Price Improved - An Irresistible Opportunity! Beautifully updated 2-bedroom, 1.5-bath home in a quiet, well-maintained community, conveniently located near Starbucks, CVS, shopping, and freeway access. This move-in ready home features fresh interior and exterior paint, new laminate flooring and carpet, updated light fixtures, and new blinds throughout, plus energy-efficient thermal windows for year-round comfort. Enjoy a covered patio/porch and small yard for easy outdoor living. The kitchen offers a double oven, and the home includes a washer and dryer. Both bathrooms have been refreshed with modern updates. Seller is motivated and open to reasonable offers don't miss your chance to make
Key facts
- New carpet
- Double oven
- New blinds
Tags
Property features AI
Finance
- Financial info: Land lease amount $1,095/month
- HOA & community: No homeowners association; Land lease in place (monthly land lease applies)
Exterior
- Parking: Assigned parking; Off‑street parking; Boat storage available; Guest parking available
- Utilities: Cable available; Internet available; Propane service; Individual gas meter; 220V in kitchen; Water from district; Sewer: other
- Home design: Manufactured in park (single wide); Updated/remodeled; Made by Skyline; Skirted with aluminum
- Construction: Built in 1974; Other roof
- Exterior features: Backyard with landscaping in back; Covered deck
Interior
- Kitchen: Gas cook top; Hood over range; Double oven; Disposal; Pantry cabinet; Stone countertops
- Bedrooms: 2 bedrooms — master approx. 12x9, second approx. 10x8
- Flooring: Carpet; Laminate; Wood
- Bathrooms: 1 full bathroom; 1 half bathroom; Tub with shower over
- Heating & cooling: Central heating; Propane heating; Evaporative cooler
- Interior features: Covered deck; Weather‑stripped windows; Updated/remodeled condition; 6 total rooms (including living room, dining room, kitchen, laundry, bath, master bedroom)
- Laundry & utility: Washer and dryer included; Washer/dryer stacked option; Laundry located inside (inside room/area)
Neighborhood map
What this means for you Summary
Snapshot
- This is a 2-bed/1.5-bath manufactured listed at $60k.
Deal economics
- At list price, monthly cash flow is $1k ($13k/yr) — positive.
- The deal already cash-flows at list — no discount required.
- Meets the 1% rule at list price ($2k rent vs $60k).
- Recommended offer: $55k (9.0% below list) — sets the bar for market timing.
- Cap rate 28.9% vs local median 1.7% in Lake of the Pines — top-decile yield for the area; either an underpriced asset or a hidden risk that comps aren't pricing in. Stress-test before assuming the spread holds.
Location & tenants
- Location reads 58/100 on livability (#683 in CA) — a working-class tenant base; expect higher turnover. Strengths: employment A+, housing A, crime B+; Watch: amenities F, commute F, cost of living F.
- Nevada Joint Union High (town): math 25% / reading 61% proficiency, ranked #201 of 517 in CA (top 39%) — families likely to look elsewhere, expect single-tenant / working-renter base with shorter leases.
- Market conditions: 186 active listings in the ZIP; solid renter incomes; 215 units permitted in Nevada County in 2024 (0 in 5+ unit buildings).
Forward outlook
- Local home prices are declining (-3.0%/yr); year-one equity from $414 of loan paydown is wiped out by about $2k of value loss. Plan a longer hold.
- Nevada County population projected at -14% by 2050 — secular population decline; favor cash flow + early exit over multi-decade hold.
- At projected returns (-3.0% appreciation + 3.0% rent growth), your $17k cash investment doubles in ~2 years — after that, you're playing with house money.
Negotiation context
- It's been on market 106 days — a 9% lower offer ($55k) is reasonable based on typical stale-listing flexibility.
Risks & watch-outs
- Watch-outs: flood insurance adds $66/mo.
- Climate carrying-cost: major flood risk; severe wildfire risk; extreme-heat days projected 7→15/yr by 2055 (HVAC capex compounding) — expect insurance premiums to compound above CPI over the hold.
Questions for the listing agent
- It's been on market 106 days. Have you received any prior offers? Is the seller open to a 9% concession, seller financing, or rate buy-down credit?
- Built in 1974 — when were the roof, HVAC, electrical panel, plumbing, and water heater last replaced?
- What's the actual annual flood-insurance premium (NFIP or private), and is the property in a SFHA with mandatory coverage?
- Why hasn't it sold? Are there any deal-killer items the seller is aware of (foundation, flood, title, zoning, code violations)?
- Is there a deadline driving the sale (1031 exchange, divorce, estate, relocation)? That informs how much negotiation room exists.
- What's the average days-on-market for RENTAL listings here right now (not sales)? A rising rental-DOM trend means longer vacancies and softer asking-rent achievability than the comps imply.
- What's the recent tenant-quality profile in this submarket — average credit score on applications, eviction rate, late-payment / NSF rate, and stable-employment percentage? A property-management company in the area should have these aggregated.
- How much new for-sale + rental construction is in the pipeline within 1–3 miles? Heavy new supply typically softens prices + rents 12–24 months out; constrained supply supports both.
Investment metrics
- 1% rule
- 3.26% ✓
- Cap rate
- 28.88%
- Cash-on-cash
- 80.65%
- DSCR
- 4.59
- GRM
- 2.6
CMA / ARV
No comps found within radius.
Projected returns pro-forma
-3.0% appreciation · 3.0% rent growth · sell at horizon
- IRR
- 75.9%
- Equity multiple
- 4.45×
- Total profit
- $57,929
- Equity at exit
- $8,931
- IRR
- 79.5%
- Equity multiple
- 9.21×
- Total profit
- $137,729
- Equity at exit
- $5,179
Cash invested: $16,772 (down + closing). Projections, not guarantees.
Landlord ↔ Tenant lean methodology
- Overall (STATE)
- 18 Strongly Tenant-Friendly
- State California
- 18 Strongly Tenant-Friendly · D+13
- County
- — inherits STATE
- City
- — inherits STATE
ZIP-level market 95602
- Active inventory
- 186
- Price-to-rent
- 2.6×
Monthly cashflow live
- Estimated rent
- $1,951 medium interval (Pro) →
- Mortgage (P&I)
- −$314
- Tax est. 1.5%
- −$75 /mo · $898/yr
- Insurance
- −$25
- Flood insurance flood zone
- −$66 /mo · $798/yr
- HOA
- −$0
- Vacancy / Maint / Mgmt
- −$410
- Net cashflow
- $1,061
Break-even live
UW: 25.0% down · 7.5% · 30yr · 1.5% tax · 5.0% vac · 8.0% maint · 8.0% mgmt
Financing live
Cash to close
- Down payment
- $14,975
- Closing costs
- $1,797
- Reserves months
- —
- Total cash needed
- —
Loan-product check · same deal, 3 products live
Conventional
25% down · 7.5% · 30yr
- Down + closing
- —
- Monthly P&I
- —
- Monthly cashflow
- —
- DSCR
- —
- Eligible?
- —
Personal DTI + credit; lowest rate.
DSCR
20% down · 8.5% · 30yr
- Down + closing
- —
- Monthly P&I
- —
- Monthly cashflow
- —
- DSCR
- —
- Eligible?
- —
No personal income docs; deal must DSCR.
Hard money
10% down · 12.0% · 12mo
- Down + closing
- —
- Monthly P&I
- —
- Monthly cashflow
- —
- DSCR
- —
- Eligible?
- —
Short-term bridge; refi at stabilization.
Listing history 16 events
-
2026-06-19days on market $59,900 Active 106 DOM
-
2026-06-18days on market $59,900 Active 105 DOM
-
2026-06-17days on market $59,900 Active 104 DOM
-
2026-06-16days on market $59,900 Active 103 DOM
-
2026-06-15days on market $59,900 Active 102 DOM
-
2026-06-13days on market $59,900 Active 100 DOM
-
2026-06-13days on market $59,900 Active 99 DOM
-
2026-06-10days on market $59,900 Active 97 DOM
-
2026-06-09days on market $59,900 Active 96 DOM
-
2026-06-08days on market $59,900 Active 95 DOM
-
2026-06-07days on market $59,900 Active 94 DOM
-
2026-06-05days on market $59,900 Active 91 DOM
-
2026-06-03days on market $59,900 Active 90 DOM
-
2026-06-02days on market $59,900 Active 89 DOM
-
2026-06-01days on market $59,900 Active 88 DOM
-
2026-05-31days on market $59,900 Active 87 DOM
ⓘ Source: listings_history table (triggers on properties + properties_extension) + one-shot
backfill from property_details.listing_events for pre-trigger history.
Climate risk First Street
- Flood 7/10 Severe FEMA zone X (unshaded) · 99% chance over 30 yrs
- Wildfire 8/10 Severe
- Heat 6/10 Major 7 d/yr ≥98°F today · 15 d/yr by 30 yrs out
- Wind 1/10 Low
- Air quality 10/10 Extreme 32 unhealthy d/yr today · 41 by 30 yrs out
Nearby sold comps map
Loading sold comps map…
Walkable amenities ~0.75 mi
Loading nearby amenities…
Taxation est. · year 1
- Rental income
- $23,411
- − Mortgage interest
- −$3,355
- − Property taxes
- −$898
- − Insurance
- −$1,097
- − Repairs & maintenance
- −$1,873
- − Management
- −$1,873
- − Depreciation
- −$1,743
- Taxable income
- $12,572
- Est. tax owed @ 24.0%
- −$3,017
- After-tax cash flow
- $9,713/yr
For passive investors: Depreciation is non-cash, so a rental often shows a tax loss while cash-flowing — sheltering income. Rental losses are passive: they offset passive income freely, and up to $25,000/yr can offset ordinary (W-2) income if you actively participate and your MAGI is under $100k (phasing out to $0 by $150k); unused losses carry forward. On sale, claimed depreciation is recaptured at up to 25%, and gains may owe capital-gains tax (a 1031 exchange can defer both). Figures are a year-1 estimate at your 24.0% rate — not tax advice; consult a CPA.
Schools (NCES district)
- District
- Nevada Joint Union High
- NCES district ID
- 0626880
- Math proficiency
- 25% ▼ -14.00%
- Reading proficiency
- 61% ▼ -7.00%
- Median HH income
- $57,336
- Composite
- 37.53/100
- National rank
- #4393
- State rank
- #201 of 517 in CA
Livability — Lake of the Pines
- Score
- 58/100
- State rank
- #683
- US rank
- #20863
Category grades
Schools grade is shown separately in the Schools card above.
Census & demographics
- County
- Placer County · 390,510 people
- Metro
- Sacramento-Roseville-Folsom, CA
- Population (ZIP)
- 19,701
- Household income
- $97,466
- Rent vs Own
- Severe rent burden
- 521.0
Population outlook (Nevada County) Hauer SSP2
- Today (2025)
- 98,490 people
- By 2030
- 97,295 · -1.2%
- By 2040
- 92,041 · -6.5%
- By 2050
- 85,164 · -13.5%
- By 2075
- 68,436 · -30.5%
- By 2100
- 49,536 · -49.7%
Race, ethnicity, and origin ACS 2023
- Neighborhood character
- Predominantly White (78%)
- Race & ethnicity
- White 78% Hispanic / Latino 14% Two or more races 7% Asian 1%
- Hispanic origin (detail)
- Mexican 10%
- Common ancestry
- Italian 6% Portuguese 3% Lithuanian 3%
- Foreign-born
- 8% · Canada
- Languages at home
- 90% English-only · Spanish 7% Other Indo-European 1% German/W. Germanic 0%
Political lean MEDSL · Nevada
- 2024 margin
- D (+12.2) · D 54.4% · R 42.1% · Other 3.5%
- 2008→2024 swing
- +6.9pp toward D · 2008: 5.3pp · 2024: 12.2pp
- All cycles
- 2024: D+12.2 2020: D+14.8 2016: D+4.5 2012: R+4.7 2008: D+5.3
Not yet ingested
- Civics
- —
Market trends
- HPI YoY
- ▼ -426.11%
- Current HPI
- 257.0087
- Rent YoY
- —
- Metro
- Sacramento-Roseville-Folsom, CA
- State GDP YoY
- ▲ 3.21%
- F500 in state
- 116
Industry mix (Fortune 500 HQ in CA)
| Industry | F500 HQs | Revenue |
|---|---|---|
| Technology | 27 | $1,492B |
|
||
| Financial Services | 3 | $174B |
|
||
| Retail | 3 | $44B |
|
||
| Insurance | 3 | $26B |
|
||
| Media / Entertainment | 2 | $115B |
|
||
| Pharmaceuticals / Biotech | 2 | $62B |
|
||
Property tax history
-6.2%/yrLatest (2023): $25 · -24.3% YoY. Source: county tax records.
Cash-flow waterfall
monthlySold comps — $/sqft
last 12 mo · ≤1 miLoading sold comps…