18601 Newland St #67 · Huntington Beach, CA
Flood risk 4/10 · Minor
- FEMA flood zone
- X
- Chance of flooding over 30 yrs
- 0.22%
- Est. flood insurance / yr
- $507 – $1,088
Fire risk 1/10 · Minimal
- Est. fire insurance / yr
- $659 – $1,223
Heat risk 5/10 · Moderate
- Hot days now (above 85°F)
- 7 days/yr
- Hot days in 30 yrs
- 24 days/yr
Wind risk 1/10 · Minimal
- Chance of severe wind over 30 yrs
- —
Air-quality risk 4/10 · Minor
- Unhealthy air days now
- 5 days/yr
- Unhealthy air days in 30 yrs
- 7 days/yr
Risk factors via First Street. Map © Google.
Why this score? — see what drove the B+ grade
The composite is a weighted blend of 9 inputs, each scored 0–100. Each bar is that input's sub-score; the figure is the points it added to the 100-point composite (weight × sub-score).
- Cash flow +30.0/30.0
- DSCR +10.0/10.0
- 1% rule +9.6/10.0
- ARV discount +8.9/15.0
- Schools +6.5/10.0
- Condition / age +4.0/5.0
- Livability +3.4/5.0
- Rent growth +2.8/5.0
- Appreciation +0.0/10.0
$229,000
🖨 Deal sheet 📄 Offer letter ✓ Due diligence
Listing remarks
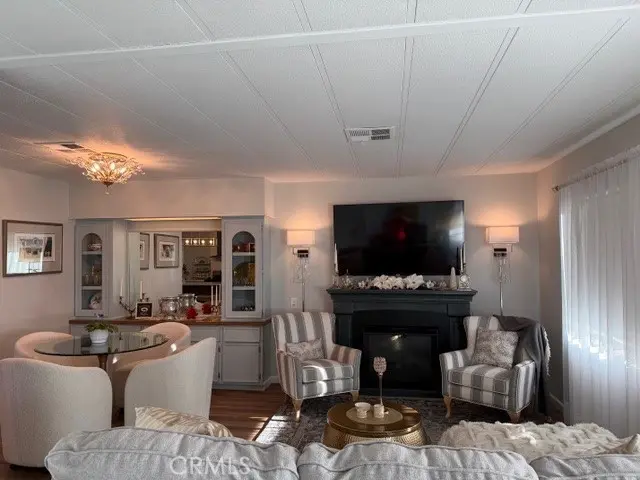
Fully remodeled home with a desirable open floor plan and newer roof, offering the perfect blend of comfort and style. Bright and airy living spaces flow seamlessly into the dining area and updated kitchen, creating an ideal layout for both everyday living and entertaining. The home features upgraded finishes throughout, including newer flooring, modern fixtures, and refreshed interior and exterior paint. Spacious bedrooms provide comfort and flexibility, while the primary suite offers a relaxing retreat with an updated ensuite bathroom. Step outside to a covered front porch—perfect for morning coffee or evening relaxation—plus a private yard with room for gardening or outdoor e
Key facts
- Open floor plan
- Newer flooring
- Newer roof
Tags
Property features AI
Finance
- Other: Living area is estimated; Lot characterized as 0–1 unit per acre; Elevation measured in feet; Park name: Los Amigos
- Financial info: Monthly land lease of $1,975 (park-managed)
- HOA & community: Senior community; Manager approval required for park residency; Pets allowed — contact manager
Exterior
- Parking: Located in Los Amigos park
- Utilities: Public sewer; District/public water
- Home design: Single-story property; Mobile home (24 ft wide x 60 ft long); Mobile home remains on site; Model AHRTG
- Construction: Year built by builder
- Exterior features: Community pool; Suburban community
Interior
- Bathrooms: 2 full bathrooms
- Interior features: Front door entry; Entry level is first floor
- Laundry & utility: Laundry inside
Neighborhood map
What this means for you Summary
Snapshot
- This is a 2-bed/2.0-bath manufactured listed at $229k. Condition is rated good.
Deal economics
- At list price, monthly cash flow is $1k ($13k/yr) — positive.
- The deal already cash-flows at list — no discount required.
- Meets the 1% rule at list price ($3k rent vs $229k).
- Recommended offer: $215k (6.0% below list) — sets the bar for market timing.
- Cap rate 11.8% vs local median 1.6% in Huntington Beach — top-decile yield for the area; either an underpriced asset or a hidden risk that comps aren't pricing in. Stress-test before assuming the spread holds.
Location & tenants
- Location reads 67/100 on livability (#306 in CA) — a middle-class / working-renter tenant base. Strengths: employment A+, commute A-, schools B+; Watch: amenities C-, cost of living F, health & safety F.
- Huntington Beach Union High (suburban): math 65% / reading 82% proficiency, ranked #39 of 517 in CA (top 8%) — strong family-tenant draw, lease renewals of 3-5y typical.
- Market conditions: Rents rising (+1.2%/yr); 116 active listings in the ZIP; 40 comparable units currently listed for rent nearby; rentals leasing fast (median 1d on market — plan ~1-2 weeks tenant-placement turnaround); high-income renter base; 6,974 units permitted in Orange County in 2024 (3,839 in 5+ unit buildings).
- This rent runs 31% of the median local income ($131k/yr) — at the standard rent-burdened threshold; future hikes will face affordability resistance.
Forward outlook
- Local home prices are declining (-3.0%/yr); year-one equity from $2k of loan paydown is wiped out by about $7k of value loss. Plan a longer hold.
- Orange County population projected at +14% by 2050 — modest demand growth; plan on rents tracking national, not racing it.
- At projected returns (-3.0% appreciation + 1.2% rent growth), your $64k cash investment doubles in ~7 years — after that, you're playing with house money.
Negotiation context
- It's been on market 64 days — a 6% lower offer ($215k) is reasonable based on typical stale-listing flexibility.
Risks & watch-outs
- Climate carrying-cost: extreme-heat days projected 7→24/yr by 2055 (HVAC capex compounding) — expect insurance premiums to compound above CPI over the hold.
Questions for the listing agent
- It's been on market 64 days. Have you received any prior offers? Is the seller open to a 6% concession, seller financing, or rate buy-down credit?
- Built in 1976 — when were the roof, HVAC, electrical panel, plumbing, and water heater last replaced?
- Why hasn't it sold? Are there any deal-killer items the seller is aware of (foundation, flood, title, zoning, code violations)?
- Is there a deadline driving the sale (1031 exchange, divorce, estate, relocation)? That informs how much negotiation room exists.
- Schools are B-rated — typically a magnet for longer-tenancy family renters. What's the average tenant stay here, and is there a school-zone premium baked into asking?
- What's the average days-on-market for RENTAL listings here right now (not sales)? A rising rental-DOM trend means longer vacancies and softer asking-rent achievability than the comps imply.
- What's the recent tenant-quality profile in this submarket — average credit score on applications, eviction rate, late-payment / NSF rate, and stable-employment percentage? A property-management company in the area should have these aggregated.
- How much new for-sale + rental construction is in the pipeline within 1–3 miles? Heavy new supply typically softens prices + rents 12–24 months out; constrained supply supports both.
Investment metrics
- 1% rule
- 1.46% ✓
- Cap rate
- 11.85%
- Cash-on-cash
- 19.84%
- DSCR
- 1.88
- GRM
- 5.7
CMA / ARV
- ARV (on-the-fly)
- $236,160
- Comps found
- 8
Show comp detail 8 sales within ~0.75 mi
| Address | Dist | Beds/Ba | Sqft | Sold | Price | $/sf | Match |
|---|---|---|---|---|---|---|---|
| 18601 Newland St SPC 5 | 0.07mi | 2/2.0 | 1,440 (0%) | 10mo | $290,000 | $201 | 88 |
| 18601 Newland St #89 | 0.07mi | 2/2.0 | 1,440 (0%) | 17mo | $165,000 | $115 | 82 |
| 18601 Newland St #95 | 0.07mi | 2/2.0 | 1,440 (0%) | 20mo | $140,000 | $97 | 80 |
| 18601 Newland St | 0.10mi | 2/2.0 | 1,440 (0%) | 20mo | $125,000 | $87 | 78 |
| 18601 Newland St #32 | 0.07mi | 3/2.0 (+1) | 1,440 (0%) | 18mo | $140,000 | $97 | 77 |
| 18601 Newland St #8 | 0.07mi | 3/2.0 (+1) | 1,440 (0%) | 22mo | $300,000 | $208 | 74 |
| 18601 Newland #38 | 0.07mi | 2/2.0 | 1,652 (+15%) | 4mo | $319,000 | $193 | 69 |
| 18601 Newland St #130 | 0.07mi | 2/2.0 | 1,344 (-7%) | 21mo | $220,000 | $164 | 68 |
Match score weights: distance 35% · size 25% · config 20% · recency 20%. Top-matched comps best support the ARV.
Projected returns pro-forma
-3.0% appreciation · 1.2% rent growth · sell at horizon
- IRR
- 9.9%
- Equity multiple
- 1.38×
- Total profit
- $24,498
- Equity at exit
- $34,145
- IRR
- 17.5%
- Equity multiple
- 2.32×
- Total profit
- $84,909
- Equity at exit
- $19,800
Cash invested: $64,120 (down + closing). Projections, not guarantees.
Landlord ↔ Tenant lean methodology
- Overall (STATE)
- 18 Strongly Tenant-Friendly
- State California
- 18 Strongly Tenant-Friendly · D+13
- County
- — inherits STATE
- City
- — inherits STATE
ZIP-level market 92646
- Rents YoY
- 1.2%
- Active inventory
- 116
- Price-to-rent
- 5.7×
Monthly cashflow live
- Estimated rent
- $3,345 high interval (Pro) →
- Mortgage (P&I)
- −$1,201
- Tax est. 1.5%
- −$286 /mo · $3,435/yr
- Insurance
- −$95
- HOA
- −$0
- Vacancy / Maint / Mgmt
- −$702
- Net cashflow
- $1,060
Break-even live
UW: 25.0% down · 7.5% · 30yr · 1.5% tax · 5.0% vac · 8.0% maint · 8.0% mgmt
Financing live
Cash to close
- Down payment
- $57,250
- Closing costs
- $6,870
- Reserves months
- —
- Total cash needed
- —
Loan-product check · same deal, 3 products live
Conventional
25% down · 7.5% · 30yr
- Down + closing
- —
- Monthly P&I
- —
- Monthly cashflow
- —
- DSCR
- —
- Eligible?
- —
Personal DTI + credit; lowest rate.
DSCR
20% down · 8.5% · 30yr
- Down + closing
- —
- Monthly P&I
- —
- Monthly cashflow
- —
- DSCR
- —
- Eligible?
- —
No personal income docs; deal must DSCR.
Hard money
10% down · 12.0% · 12mo
- Down + closing
- —
- Monthly P&I
- —
- Monthly cashflow
- —
- DSCR
- —
- Eligible?
- —
Short-term bridge; refi at stabilization.
Rent comps 40 comps
| Address | Beds | Baths | Sqft | Rent | $/sqft | DOM | Units | Dist |
|---|---|---|---|---|---|---|---|---|
| 18671 Libra Cir Apt 3 Huntington Beach, CA | 2.0 | 2.0 | 900 | $2,500 | $2.78 | 3d | 1 | 0.32mi |
| 18341 Gum Tree Ln Huntington Beach, CA | 3.0 | 2.5 | 1658 | $4,500 | $2.71 | 2d | 1 | 0.32mi |
| 18661 Libra Cir Apt 3 Huntington Beach, CA | 2.0 | 2.0 | 900 | $2,500 | $2.78 | 15d | 1 | 0.32mi |
| 8072 Constantine Dr Unit A Huntington Beach, CA | 3.0 | 2.0 | 1200 | $3,295 | $2.75 | 15d | 1 | 0.38mi |
| 8579 Volga River Cir Fountain Valley, CA | 3.0 | 2.0 | 1425 | $3,500 | $2.46 | 24d | 1 | 0.40mi |
| 7881 Beachpoint Cir Unit BD19 Huntington Beach, CA | 2.0 | 2.0 | 1006 | $3,225 | $3.21 | 14d | 1 | 0.50mi |
| 7891 Ellis Ave Huntington Beach, CA | 2.0 | 1.0 | 1000 | $2,800 | $2.80 | 1d | 1 | 0.51mi |
| 18832 Florida St Huntington Beach, CA | 2.0 | 1.0 | 725 | $2,795 | $3.86 | 1d | 5 | 0.55mi |
| 18750 Delaware St Huntington Beach, CA | 3.0 | 1.0–2.0 | 1202 | $8,621 | $7.17 | 1d | 108 | 0.57mi |
| 7802 Shaffer Cir Huntington Beach, CA | 2.0 | 1.5 | 1000 | $2,695 | $2.69 | 1d | 1 | 0.64mi |
| 7802 Shaffer Cir Apt 4 Huntington Beach, CA | 2.0 | 1.5 | 1000 | $2,695 | $2.69 | 1d | 1 | 0.64mi |
| 7702 Amberleaf Cir Unit 1-4 Huntington Beach, CA | 2.0 | 1.0 | 900 | $2,450 | $2.72 | 1d | 1 | 0.69mi |
| 7702 Amberleaf Cir Unit 4 Huntington Beach, CA | 2.0 | 1.0 | 900 | $2,450 | $2.72 | 22d | 1 | 0.69mi |
| 7882 Orchid Dr Huntington Beach, CA | 3.0 | 2.5 | 1868 | $4,995 | $2.67 | 10d | 1 | 0.73mi |
| 18662 Park Meadow Ln Huntington Beach, CA | 3.0 | 3.0 | 1543 | $5,100 | $3.31 | 1d | 1 | 0.78mi |
| 18635 Park Meadow Ln Huntington Beach, CA | 3.0 | 2.5 | 1543 | $4,650 | $3.01 | 16d | 1 | 0.80mi |
| 7562 Ellis Ave Huntington Beach, CA | 2.0–3.0 | 1.5–2.5 | 1223 | $2,800 | $2.29 | 3d | 1 | 0.83mi |
| 18131 S 3rd St Fountain Valley, CA | 3.0 | 2.0 | 1254 | $5,000 | $3.99 | 1d | 1 | 0.84mi |
| 504 Clay Ave Unit 5 Huntington Beach, CA | 2.0 | 2.0 | 950 | $2,495 | $2.63 | 1d | 1 | 0.89mi |
| 7811 Talbert Ave Huntington Beach, CA | 2.0 | 1.0 | 950 | $2,969 | $3.13 | 1d | 1 | 0.90mi |
| 17972 Baron Cir Unit 4 Huntington Beach, CA | 2.0 | 1.0 | 876 | $2,695 | $3.08 | 1d | 1 | 0.90mi |
| 718 Williams Dr Apt C Huntington Beach, CA | 2.0 | 1.0 | 1025 | $3,195 | $3.12 | 1d | 1 | 0.91mi |
| 2614 Florida St Unit C Huntington Beach, CA | 2.0 | 1.0 | 1000 | $3,750 | $3.75 | 1d | 1 | 0.91mi |
| 2620 England St Unit 2 Huntington Beach, CA | 2.0 | 1.0 | 1000 | $2,790 | $2.79 | 1d | 1 | 0.94mi |
| 2620 England St Unit 3 Huntington Beach, CA | 2.0 | 1.0 | 1000 | $2,400 | $2.40 | 19d | 1 | 0.94mi |
| 19343 McLaren Ln Huntington Beach, CA | 3.0 | 2.0 | 1654 | $4,000 | $2.42 | 24d | 1 | 0.95mi |
| 2724 17th St Huntington Beach, CA | 3.0 | 2.5 | 1847 | $4,700 | $2.54 | 1d | 1 | 0.97mi |
| 2517 Florida St Unit 7 Huntington Beach, CA | 2.0 | 2.0 | 1000 | $2,600 | $2.60 | 1d | 1 | 0.98mi |
| 2604 Delaware St Apt 4 Huntington Beach, CA | 2.0 | 1.0 | 1024 | $2,495 | $2.44 | 24d | 1 | 1.01mi |
| 7901 Newman Ave Apt C Huntington Beach, CA | 2.0 | 2.0 | 900 | $2,425 | $2.69 | 1d | 1 | 1.03mi |
| 19071 Main St #105 Huntington Beach, CA | 2.0 | 2.5 | 1300 | $4,500 | $3.46 | 3d | 1 | 1.04mi |
| 7822 Newman Ave Unit B Huntington Beach, CA | 2.0 | 1.5 | 950 | $2,500 | $2.63 | 1d | 1 | 1.04mi |
| 17610 Cameron Ln Unit H Huntington Beach, CA | 2.0 | 2.5 | 1020 | $2,700 | $2.65 | 1d | 1 | 1.08mi |
| 17570 Van Buren Ln Huntington Beach, CA | 3.0 | 2.5 | 1269 | $3,950 | $3.11 | 1d | 1 | 1.09mi |
| 8402 Slater Ave Huntington Beach, CA | 2.0 | 1.0 | 900 | $3,200 | $3.56 | 1d | 1 | 1.11mi |
| 9213 El Tango Cir Fountain Valley, CA | 3.0 | 3.0 | 1670 | $4,800 | $2.87 | 1d | 1 | 1.13mi |
| 7802 Speer Dr Unit C Huntington Beach, CA | 2.0 | 2.0 | 900 | $2,595 | $2.88 | 1d | 1 | 1.15mi |
| 19122 Cole Ln Huntington Beach, CA | 3.0 | 2.5 | 1350 | $4,500 | $3.33 | 1d | 1 | 1.15mi |
| 2418 Huntington St Unit 2420-A Huntington Beach, CA | 2.0 | 2.0 | 1045 | $3,095 | $2.96 | 1d | 1 | 1.18mi |
| 2323 Huntington St #902 Huntington Beach, CA | 2.0 | 2.0 | 1100 | $3,200 | $2.91 | 1d | 1 | 1.23mi |
Listing history 16 events
-
2026-06-18days on market $229,000 Active 64 DOM
-
2026-06-17days on market $229,000 Active 63 DOM
-
2026-06-16days on market $229,000 Active 62 DOM
-
2026-06-15days on market $229,000 Active 61 DOM
-
2026-06-13days on market $229,000 Active 59 DOM
-
2026-06-13days on market $229,000 Active 58 DOM
-
2026-06-09days on market $229,000 Active 55 DOM
-
2026-06-08days on market $229,000 Active 54 DOM
-
2026-06-07days on market $229,000 Active 53 DOM
-
2026-06-04days on market $229,000 Active 50 DOM
-
2026-06-03days on market $229,000 Active 49 DOM
-
2026-06-02days on market $229,000 Active 48 DOM
-
2026-06-01days on market $229,000 Active 47 DOM
-
2026-05-31days on market $229,000 Active 46 DOM
-
2026-05-23price $229,000
-
2026-04-15$242,000 Active
ⓘ Source: listings_history table (triggers on properties + properties_extension) + one-shot
backfill from property_details.listing_events for pre-trigger history.
Climate risk First Street
- Flood 4/10 Moderate FEMA zone X · 22% chance over 30 yrs
- Wildfire 1/10 Low
- Heat 5/10 Major 7 d/yr ≥85°F today · 24 d/yr by 30 yrs out
- Wind 1/10 Low
- Air quality 4/10 Moderate 5 unhealthy d/yr today · 7 by 30 yrs out
Nearby sold comps map
Loading sold comps map…
Walkable amenities ~0.75 mi
Loading nearby amenities…
Taxation est. · year 1
- Rental income
- $40,139
- − Mortgage interest
- −$12,828
- − Property taxes
- −$3,435
- − Insurance
- −$1,145
- − Repairs & maintenance
- −$3,211
- − Management
- −$3,211
- − Depreciation
- −$6,662
- Taxable income
- $9,647
- Est. tax owed @ 24.0%
- −$2,315
- After-tax cash flow
- $10,404/yr
For passive investors: Depreciation is non-cash, so a rental often shows a tax loss while cash-flowing — sheltering income. Rental losses are passive: they offset passive income freely, and up to $25,000/yr can offset ordinary (W-2) income if you actively participate and your MAGI is under $100k (phasing out to $0 by $150k); unused losses carry forward. On sale, claimed depreciation is recaptured at up to 25%, and gains may owe capital-gains tax (a 1031 exchange can defer both). Figures are a year-1 estimate at your 24.0% rate — not tax advice; consult a CPA.
Condition & rehab AI · 12 photos
This fully remodeled home offers a bright and airy open floor plan with modern finishes and a desirable location. It is move-in ready with minimal maintenance required.
Value-add opportunities
- Both landscaping — enhances curb appeal and adds value
- Both ceiling fans — improves air circulation and comfort
- Both lamp shades — refreshes the interior and adds a touch of elegance
Renovation cost estimate screening
Value-add ROI direction
- Both landscaping — enhances curb appeal and adds value ↑
- Both ceiling fans — improves air circulation and comfort ↑
- Both lamp shades — refreshes the interior and adds a touch of elegance ↑
ⓘ Cost ranges are severity-bucket heuristics (US national rule-of-thumb). Get contractor quotes + a written scope before underwriting a rehab budget.
Schools (NCES district)
- District
- Huntington Beach Union High
- NCES district ID
- 0618060
- Math proficiency
- 65% ▲ 17.00%
- Reading proficiency
- 82% ▲ 8.00%
- Median HH income
- $78,159
- Composite
- 64.9/100
- National rank
- #511
- State rank
- #39 of 517 in CA
Livability — Huntington Beach
- Score
- 67/100
- State rank
- #306
- US rank
- #10298
Category grades
Schools grade is shown separately in the Schools card above.
Census & demographics
- Census place
- Huntington Beach, CA
- County
- Orange County · 3,096,323 people
- City population
- 194,835
- Metro
- Los Angeles-Long Beach-Anaheim, CA
- Population (ZIP)
- 54,615
- Household income
- $130,672
- Rent vs Own
- Severe rent burden
- 1226.0
Population outlook (Orange County) Hauer SSP2
- Today (2025)
- 3,477,456 people
- By 2030
- 3,613,117 · +3.9%
- By 2040
- 3,835,945 · +10.3%
- By 2050
- 3,968,736 · +14.1%
- By 2075
- 4,097,053 · +17.8%
- By 2100
- 3,903,633 · +12.3%
Race, ethnicity, and origin ACS 2023
- Neighborhood character
- Diverse neighborhood (Simpson 0.56)
- Race & ethnicity
- White 63% Hispanic / Latino 16% Asian 13% Two or more races 13%
- Hispanic origin (detail)
- Mexican 11%
- Common ancestry
- Italian 3% Romanian 2% Lithuanian 2%
- Foreign-born
- 15% · Vietnam, Canada, China
- Languages at home
- 80% English-only · Spanish 7% Vietnamese 5% Chinese 2%
Political lean MEDSL · Orange
- 2024 margin
- Toss-up / Even · D 49.7% · R 47.1% · Other 3.2%
- 2008→2024 swing
- +5.2pp toward D · 2008: -2.6pp · 2024: 2.6pp
- All cycles
- 2024: D+2.6 2020: D+9.0 2016: D+7.7 2012: R+8.3 2008: R+2.6
Not yet ingested
- Civics
- —
Market trends
- HPI YoY
- ▼ -1082.92%
- Current HPI
- 459.3987
- Rent YoY
- ▲ 1.20%
- Metro
- Los Angeles-Long Beach-Anaheim, CA
- State GDP YoY
- ▲ 3.21%
- F500 in state
- 116
Industry mix (Fortune 500 HQ in CA)
| Industry | F500 HQs | Revenue |
|---|---|---|
| Technology | 27 | $1,492B |
|
||
| Financial Services | 3 | $174B |
|
||
| Retail | 3 | $44B |
|
||
| Insurance | 3 | $26B |
|
||
| Media / Entertainment | 2 | $115B |
|
||
| Pharmaceuticals / Biotech | 2 | $62B |
|
||
Price history
-5.4% since first listed2 events — show timeline
- 2026-05-23 Price Changed $229,000 CRMLS
- 2026-04-15 Listed $242,000 CRMLS
Cash-flow waterfall
monthlySold comps — $/sqft
last 12 mo · ≤1 miLoading sold comps…