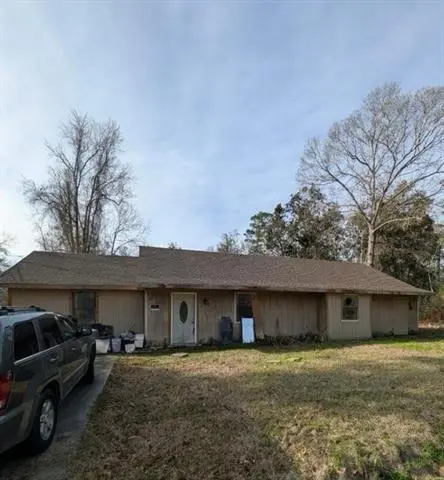
28442 Holly Dr · Lacombe, LA
Flood risk 1/10 · Minimal
- FEMA flood zone
- X
- Chance of flooding over 30 yrs
- 0.0%
- Est. flood insurance / yr
- $507 – $1,088
Fire risk 5/10 · Moderate
- Est. fire insurance / yr
- $1,269 – $2,357
Heat risk 10/10 · Severe
- Hot days now (above 109°F)
- 7 days/yr
- Hot days in 30 yrs
- 21 days/yr
Wind risk 9/10 · Severe
- Chance of severe wind over 30 yrs
- 99.0%
Air-quality risk 3/10 · Minor
- Unhealthy air days now
- 2 days/yr
- Unhealthy air days in 30 yrs
- 3 days/yr
Risk factors via First Street. Map © Google.
Why this score? — see what drove the B grade
The composite is a weighted blend of 9 inputs, each scored 0–100. Each bar is that input's sub-score; the figure is the points it added to the 100-point composite (weight × sub-score).
- Cash flow +30.0/30.0
- ARV discount +15.0/15.0
- DSCR +10.0/10.0
- 1% rule +7.4/10.0
- Schools +4.3/10.0
- Livability +3.2/5.0
- Rent growth +2.5/5.0
- Condition / age +2.5/5.0
- Appreciation +0.0/10.0
$139,000
🖨 Deal sheet 📄 Offer letter ✓ Due diligence
Listing remarks MLS
Welcome to 28442 Holly Drive in the heart of Lacombe! This spacious home offers nearly 2300 square feet of living space and presents a fantastic opportunity for homeowners, investors, or anyone looking to enjoy the peaceful Northshore lifestyle. Situated on a nice lot in a quiet setting, this property combines the charm of country living with convenient access to schools, shopping, dining, and major commuter routes. Inside, you'll find ample living space with plenty of potential to make it your own. Whether you're searching for a primary residence, rental investment, or renovation project, this property offers flexibility and value. Enjoy the tranquility of Lacombe while still being just minutes from Slidell, Mandeville, and all that St. Tammany Parish has to offer. Don't miss your chance to own a piece of the Northshore at an affordable price. Schedule your private showing today!
Key facts
- Minutes from slidell
- Ample living space
- Quiet setting
Tags
Property features AI
Exterior
- Parking: Driveway
- Utilities: Well water; Septic sewer
- Home design: Single-story home; Entry on main level
- Construction: Shingle roof; Slab foundation; Built in average condition
- Exterior features: City lot; Rectangular lot; Lot dimensions approximately 50 x 150
Interior
- Bathrooms: 2 full bathrooms
- Heating & cooling: Central heating; Central air conditioning
- Interior features: Average condition; Total of 5 rooms
Neighborhood map
What this means for you Summary
Snapshot
- This is a 3-bed/2.0-bath single-family listed at $139k.
Deal economics
- At list price, monthly cash flow is $536 ($6k/yr) — positive.
- The deal already cash-flows at list — no discount required.
- Meets the 1% rule at list price ($2k rent vs $139k).
- Cap rate 10.9% vs local median 4.2% in Lacombe — top-decile yield for the area; either an underpriced asset or a hidden risk that comps aren't pricing in. Stress-test before assuming the spread holds.
Location & tenants
- Location reads 63/100 on livability (#188 in LA) — a middle-class / working-renter tenant base. Strengths: cost of living A+, housing A+, crime B; Watch: employment C-, amenities F, commute F.
- St. Tammany Parish (suburban): math 43% / reading 55% proficiency, ranked #11 of 98 in LA (top 11%) — families likely to look elsewhere, expect single-tenant / working-renter base with shorter leases.
- Market conditions: 219 active listings in the ZIP; 1,064 units permitted in St. Tammany Parish in 2024 (0 in 5+ unit buildings).
Forward outlook
- Local home prices are declining (-3.0%/yr); year-one equity from $961 of loan paydown is wiped out by about $4k of value loss. Plan a longer hold.
- St. Tammany County population projected at +27% by 2050 — long-run rental-demand tailwind backs the buy-and-hold thesis.
- At projected returns (-3.0% appreciation + 3.0% rent growth), your $39k cash investment doubles in ~8 years — after that, you're playing with house money.
Negotiation context
- Only 7 days on market — expect competitive offers; lowballing is unlikely to land.
- 4 sale attempts since 3y ago with the ask held roughly flat each time — persistent listings suggest the price (not the market) is what's stuck; bring a comps-based counter.
- Current owner paid $35k; list at $139k implies a 297% gain — meaningful room to come down on a strong offer.
Risks & watch-outs
- Climate carrying-cost: severe wind risk, 99% chance of damaging wind over 30y; moderate wildfire risk; extreme-heat days projected 7→21/yr by 2055 (HVAC capex compounding) — expect insurance premiums to compound above CPI over the hold.
Questions for the listing agent
- Is there a deadline driving the sale (1031 exchange, divorce, estate, relocation)? That informs how much negotiation room exists.
- Schools are B-rated — typically a magnet for longer-tenancy family renters. What's the average tenant stay here, and is there a school-zone premium baked into asking?
- What's the average days-on-market for RENTAL listings here right now (not sales)? A rising rental-DOM trend means longer vacancies and softer asking-rent achievability than the comps imply.
- What's the recent tenant-quality profile in this submarket — average credit score on applications, eviction rate, late-payment / NSF rate, and stable-employment percentage? A property-management company in the area should have these aggregated.
- How much new for-sale + rental construction is in the pipeline within 1–3 miles? Heavy new supply typically softens prices + rents 12–24 months out; constrained supply supports both.
Investment metrics
- 1% rule
- 1.24% ✓
- Cap rate
- 10.92%
- Cash-on-cash
- 16.53%
- DSCR
- 1.74
- GRM
- 6.7
CMA / ARV
- ARV (on-the-fly)
- $219,820
- Comps found
- 1
Show comp detail 1 sale within ~0.75 mi
| Address | Dist | Beds/Ba | Sqft | Sold | Price | $/sf | Match |
|---|---|---|---|---|---|---|---|
| 28525 Highway 190 | 0.63mi | 2/2.0 (-1) | 1,850 (-2%) | 16mo | $215,000 | $116 | 48 |
Match score weights: distance 35% · size 25% · config 20% · recency 20%. Top-matched comps best support the ARV.
Projected returns pro-forma
-3.0% appreciation · 3.0% rent growth · sell at horizon
- IRR
- 7.6%
- Equity multiple
- 1.30×
- Total profit
- $11,566
- Equity at exit
- $20,725
- IRR
- 16.9%
- Equity multiple
- 2.38×
- Total profit
- $53,812
- Equity at exit
- $12,018
Cash invested: $38,920 (down + closing). Projections, not guarantees.
Landlord ↔ Tenant lean methodology
- Overall (STATE)
- 90 Strongly Landlord-Friendly
- State Louisiana
- 90 Strongly Landlord-Friendly · R+12
- County
- — inherits STATE
- City
- — inherits STATE
ZIP-level market 70445
- Home prices YoY
- -24.4%
- Active inventory
- 219
- Price-to-rent
- 6.7×
Monthly cashflow live
- Estimated rent
- $1,726 medium interval (Pro) →
- Mortgage (P&I)
- −$729
- Tax from tax record
- −$40 /mo · $482/yr
- Insurance
- −$58
- HOA
- −$0
- Vacancy / Maint / Mgmt
- −$362
- Net cashflow
- $536
Break-even live
UW: 25.0% down · 7.5% · 30yr · 1.5% tax · 5.0% vac · 8.0% maint · 8.0% mgmt
Financing live
Cash to close
- Down payment
- $34,750
- Closing costs
- $4,170
- Reserves months
- —
- Total cash needed
- —
Loan-product check · same deal, 3 products live
Conventional
25% down · 7.5% · 30yr
- Down + closing
- —
- Monthly P&I
- —
- Monthly cashflow
- —
- DSCR
- —
- Eligible?
- —
Personal DTI + credit; lowest rate.
DSCR
20% down · 8.5% · 30yr
- Down + closing
- —
- Monthly P&I
- —
- Monthly cashflow
- —
- DSCR
- —
- Eligible?
- —
No personal income docs; deal must DSCR.
Hard money
10% down · 12.0% · 12mo
- Down + closing
- —
- Monthly P&I
- —
- Monthly cashflow
- —
- DSCR
- —
- Eligible?
- —
Short-term bridge; refi at stabilization.
Listing history 6 events
-
2026-06-18days on market $139,000 Active 7 DOM
-
2026-06-17days on market $139,000 Active 6 DOM
-
2026-06-16days on market $139,000 Active 5 DOM
-
2026-06-15days on market $139,000 Active 4 DOM
-
2026-06-13remarks 699-char remark
-
2026-06-13$139,000 Active 2 DOM
ⓘ Source: listings_history table (triggers on properties + properties_extension) + one-shot
backfill from property_details.listing_events for pre-trigger history.
Tax reassessment forecast LA · Resets to sale price
- Current annual tax
- $482 · $40/mo
- Projected year-2 tax
- $764 · $64/mo
- Expected delta
- +$282/yr (+$24/mo · 58.5%)
ⓘ Screening estimate from a state-policy table — verify with the county assessor before closing.
Climate risk First Street
- Flood 1/10 Low FEMA zone X · 0% chance over 30 yrs
- Wildfire 5/10 Major
- Heat 10/10 Extreme 7 d/yr ≥109°F today · 21 d/yr by 30 yrs out
- Wind 9/10 Extreme 99% chance of damaging wind over 30 yrs
- Air quality 3/10 Moderate 2 unhealthy d/yr today · 3 by 30 yrs out
Nearby sold comps map
Loading sold comps map…
Walkable amenities ~0.75 mi
Loading nearby amenities…
Taxation est. · year 1
- Rental income
- $20,706
- − Mortgage interest
- −$7,786
- − Property taxes
- −$482
- − Insurance
- −$695
- − Repairs & maintenance
- −$1,656
- − Management
- −$1,656
- − Depreciation
- −$4,044
- Taxable income
- $4,386
- Est. tax owed @ 24.0%
- −$1,053
- After-tax cash flow
- $5,381/yr
For passive investors: Depreciation is non-cash, so a rental often shows a tax loss while cash-flowing — sheltering income. Rental losses are passive: they offset passive income freely, and up to $25,000/yr can offset ordinary (W-2) income if you actively participate and your MAGI is under $100k (phasing out to $0 by $150k); unused losses carry forward. On sale, claimed depreciation is recaptured at up to 25%, and gains may owe capital-gains tax (a 1031 exchange can defer both). Figures are a year-1 estimate at your 24.0% rate — not tax advice; consult a CPA.
Schools (NCES district)
- District
- St. Tammany Parish
- NCES district ID
- 2201650
- Math proficiency
- 43% ▼ -32.00%
- Reading proficiency
- 55% ▼ -26.00%
- Median HH income
- $61,752
- Composite
- 43.04/100
- National rank
- #3098
- State rank
- #11 of 98 in LA
Livability — Lacombe
- Score
- 63/100
- State rank
- #188
- US rank
- #15034
Category grades
Schools grade is shown separately in the Schools card above.
Census & demographics
- Census place
- Lacombe, LA
- Population (ZIP)
- 9,421
Population outlook (St. Tammany County) Hauer SSP2
- Today (2025)
- 286,725 people
- By 2030
- 304,175 · +6.1%
- By 2040
- 336,203 · +17.3%
- By 2050
- 364,590 · +27.2%
- By 2075
- 433,362 · +51.1%
- By 2100
- 470,333 · +64.0%
Race, ethnicity, and origin ACS 2023
- Neighborhood character
- Diverse neighborhood (Simpson 0.61)
- Race & ethnicity
- White 56% Black 25% Two or more races 15% Hispanic / Latino 12% Asian 1%
- Hispanic origin (detail)
- Mexican 4%
- Common ancestry
- Lithuanian 13% Italian 2% Iranian 1%
- Foreign-born
- 3% · Canada
- Languages at home
- 91% English-only · Spanish 6% French/Haitian/Cajun 2% Other Indo-European 1%
Political lean MEDSL · St. Tammany
- 2024 margin
- Solid R (+43.8) · D 27.3% · R 71.1% · Other 1.6%
- 2008→2024 swing
- +9.6pp toward D · 2008: -53.4pp · 2024: -43.8pp
- All cycles
- 2024: R+43.8 2020: R+44.2 2016: R+50.8 2012: R+52.2 2008: R+53.4
Not yet ingested
- Civics
- —
Market trends
- HPI YoY
- ▼ -57.75%
- Current HPI
- 178.5418
- Rent YoY
- —
- Metro
- —
- State GDP YoY
- ▲ 3.29%
- F500 in state
- 10
Industry mix (Fortune 500 HQ in LA)
| Industry | F500 HQs | Revenue |
|---|---|---|
| Telecommunications | 2 | $23B |
|
||
| Utilities | 1 | $12B |
|
||
| Wholesale / Distribution | 1 | $5B |
|
||
| Advertising | 1 | $2B |
|
||
Price history
+297.1% since first listed6 events — show timeline
- 2026-06-11 Listed $139,000 AcadianaMLS
- 2026-06-11 Listed $139,000 GSREIN
- 2023-09-22 Sold (MLS) $35,000 GSREIN
- 2023-09-18 Pending — GSREIN
- 2023-09-08 Listed $35,000 AcadianaMLS
- 2023-09-08 Listed $35,000 GSREIN
Property tax history
-11.6%/yrLatest (2025): $482 · -75.4% YoY. Source: county tax records.
Cash-flow waterfall
monthlySold comps — $/sqft
last 12 mo · ≤1 miLoading sold comps…