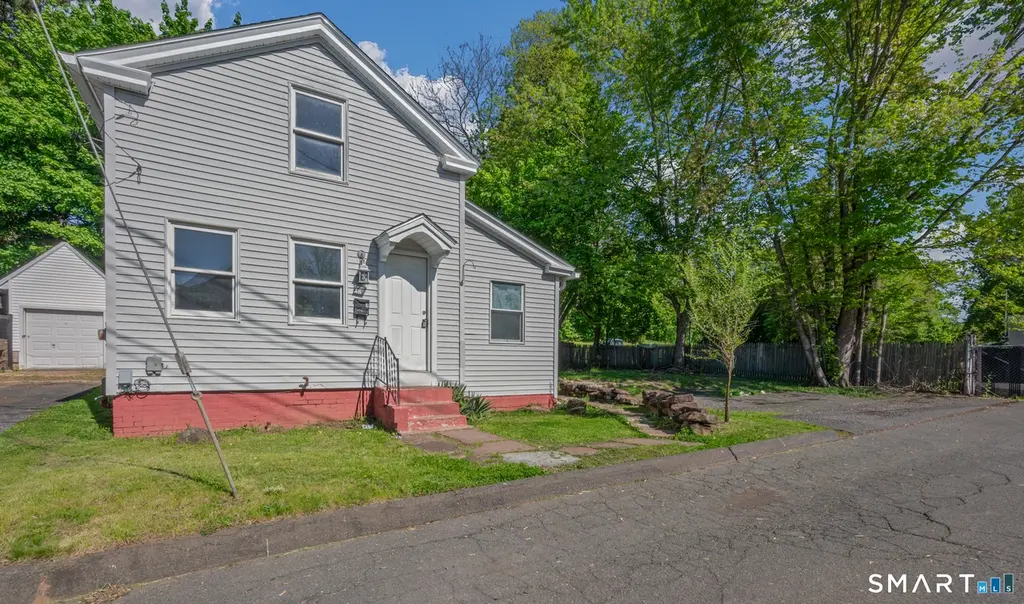
2 Hillside Ct · Middletown, CT
Flood risk 1/10 · Minimal
- FEMA flood zone
- X (unshaded)
- Chance of flooding over 30 yrs
- 0.0%
- Est. flood insurance / yr
- $473 – $860
Fire risk 1/10 · Minimal
- Est. fire insurance / yr
- $829 – $1,539
Heat risk 6/10 · Moderate
- Hot days now (above 96°F)
- 7 days/yr
- Hot days in 30 yrs
- 17 days/yr
Wind risk 6/10 · Moderate
- Chance of severe wind over 30 yrs
- 27.0%
Air-quality risk 4/10 · Minor
- Unhealthy air days now
- 3 days/yr
- Unhealthy air days in 30 yrs
- 5 days/yr
Risk factors via First Street. Map © Google.
Why this score? — see what drove the D grade
The composite is a weighted blend of 9 inputs, each scored 0–100. Each bar is that input's sub-score; the figure is the points it added to the 100-point composite (weight × sub-score).
- Cash flow +13.5/30.0
- ARV discount +9.8/15.0
- DSCR +4.1/10.0
- Livability +4.0/5.0
- 1% rule +3.3/10.0
- Schools +3.0/10.0
- Rent growth +2.6/5.0
- Condition / age +2.5/5.0
- Appreciation +0.0/10.0
$250,000
🖨 Deal sheet 📄 Offer letter ✓ Due diligence
Listing remarks MLS
Great price! Located at the end of the street with plenty of parking! Home has new windows, woodwork, electric and more! There are beautiful flower gardens. Alloffers considered and can close fast!!!
Key facts
- New siding
- Renovated bathrooms
- New gutters
Tags
Property features AI
Exterior
- Parking: Off-street parking and driveway; 3 parking spaces
- Utilities: Public water connected; Public sewer connected; Electric service (electric heat and hot water)
- Home design: Single-family home; Grey exterior color
- Construction: Frame and brick construction; Brick and concrete foundation; Asphalt shingle roof
- Exterior features: Vinyl siding; Gutters; Garden area; Level, cleared lot on a cul-de-sac; Private paved driveway
Interior
- Kitchen: Oven/Range
- Bedrooms: 3 bedrooms
- Bathrooms: 1 full bath; 1 half bath
- Heating & cooling: Electric baseboard heat
- Interior features: Ceiling fans; Full unfinished basement with interior access, concrete floor and full hatchway; 6 total rooms
- Laundry & utility: 40-gallon electric hot water tank
Neighborhood map
What this means for you Summary
Snapshot
- This is a 3-bed/2.0-bath single-family listed at $250k.
Deal economics
- At list price, monthly cash flow is $11 ($132/yr) — positive.
- The deal already cash-flows at list — no discount required.
- To meet the 1% rule (rent ≥ 1% of price), the offer needs to be $208k (16.8% below list).
- Recommended offer: $208k (16.8% below list) — sets the bar for 1% rule.
- Cap rate 6.3% vs local median 3.7% in Middletown — top-decile yield for the area; either an underpriced asset or a hidden risk that comps aren't pricing in. Stress-test before assuming the spread holds.
Location & tenants
- Location reads 81/100 on livability (#17 in CT, #1,390 nationally) — a professional / high-income tenant draw. Strengths: crime A+, amenities A+, health & safety A+; Watch: commute F.
- Middletown School District (urban): math 24% / reading 44% proficiency, ranked #113 of 153 in CT (top 74%) — families likely to look elsewhere, expect single-tenant / working-renter base with shorter leases.
- Zoned schools: Middletown High School (math 25% / reading 52%, grade F, #111 of 194 statewide, top 57%, 1,214 students, 49% FRL).
- Market conditions: Rents flat; 143 active listings in the ZIP; 14 comparable units currently listed for rent nearby; rentals at typical pace (median 24d on market — plan ~3-4 weeks tenant-placement turnaround); solid renter incomes; 278 units permitted in Lower Connecticut River Valley Planning Region in 2024 (89 in 5+ unit buildings).
- This rent runs 31% of the median local income ($79k/yr) — at the standard rent-burdened threshold; future hikes will face affordability resistance.
Forward outlook
- Local home prices are declining (-3.0%/yr); year-one equity from $2k of loan paydown is wiped out by about $8k of value loss. Plan a longer hold.
Negotiation context
- It's been on market 35 days — a 3% lower offer ($242k) is reasonable based on typical stale-listing flexibility.
- 3 sale attempts since 23y ago; this cycle's ask has dropped $20k (7%) from the opening price — seller is motivated, your offer sets the floor, not the list.
- Current owner paid $110k; list at $250k implies a 127% gain — meaningful room to come down on a strong offer.
Risks & watch-outs
- Watch-outs: built in 1859 — expect roof / HVAC / electrical / plumbing capex.
- Climate carrying-cost: major wind risk, 27% chance of damaging wind over 30y; extreme-heat days projected 7→17/yr by 2055 (HVAC capex compounding) — expect insurance premiums to compound above CPI over the hold.
Questions for the listing agent
- It's been on market 35 days. Have you received any prior offers? Is the seller open to a 17% concession, seller financing, or rate buy-down credit?
- Built in 1859 — when were the roof, HVAC, electrical panel, plumbing, and water heater last replaced?
- Is there a deadline driving the sale (1031 exchange, divorce, estate, relocation)? That informs how much negotiation room exists.
- The area grade is low — what's the realistic commute time and amenity access for the typical tenant pool here? Any planned neighborhood developments (good or bad) we should know about?
- What's the average days-on-market for RENTAL listings here right now (not sales)? A rising rental-DOM trend means longer vacancies and softer asking-rent achievability than the comps imply.
- What's the recent tenant-quality profile in this submarket — average credit score on applications, eviction rate, late-payment / NSF rate, and stable-employment percentage? A property-management company in the area should have these aggregated.
- How much new for-sale + rental construction is in the pipeline within 1–3 miles? Heavy new supply typically softens prices + rents 12–24 months out; constrained supply supports both.
Investment metrics
- 1% rule
- 0.83% ✗
- Cap rate
- 6.35%
- Cash-on-cash
- 0.19%
- DSCR
- 1.01
- GRM
- 10.0
CMA / ARV
- ARV (median comp)
- $263,190
- List price
- $250,000
- Delta
- -5.01%
- Verdict
- FAIR
- Comps
- 20 within 1.0 mi
Show comp detail 12 sales within ~0.75 mi
| Address | Dist | Beds/Ba | Sqft | Sold | Price | $/sf | Match |
|---|---|---|---|---|---|---|---|
| 184 Frisbie St | 0.25mi | 2/1.0 (-1) | 874 (-2%) | 9mo | $240,000 | $275 | 68 |
| 63 Bidwell St | 0.19mi | 3/1.0 | 960 (+8%) | 11mo | $355,000 | $370 | 66 |
| 155 Dorothy Dr | 0.32mi | 3/2.0 | 960 (+8%) | 12mo | $320,000 | $333 | 63 |
| 9 Crown St | 0.39mi | 2/1.0 (-1) | 907 (+2%) | 11mo | $272,500 | $300 | 61 |
| 5 Wall St | 0.29mi | 2/1.5 (-1) | 1,010 (+13%) | 2mo | $268,000 | $265 | 56 |
| 120 Saybrook Rd | 0.19mi | 2/1.0 (-1) | 1,008 (+13%) | 8mo | $250,000 | $248 | 54 |
| 78 Chestnut St | 0.61mi | 2/1.0 (-1) | 941 (+5%) | 9mo | $195,200 | $207 | 46 |
| 235 Hunting Hill Ave | 0.60mi | 2/1.0 (-1) | 879 (-2%) | 18mo | $281,000 | $320 | 45 |
| 161 Frisbie St | 0.28mi | 2/1.0 (-1) | 816 (-9%) | 23mo | $205,000 | $251 | 44 |
| 19 Fairlawn Ave | 0.70mi | 2/1.0 (-1) | 960 (+8%) | 6mo | $290,000 | $302 | 41 |
| 302 Fowler Ave | 0.49mi | 3/1.0 | 992 (+11%) | 21mo | $300,000 | $302 | 37 |
| 426 Fowler Ave | 0.72mi | 3/1.0 | 960 (+8%) | 21mo | $315,000 | $328 | 32 |
Match score weights: distance 35% · size 25% · config 20% · recency 20%. Top-matched comps best support the ARV.
Projected returns pro-forma
-3.0% appreciation · 0.22% rent growth · sell at horizon
- IRR
- -19.0%
- Equity multiple
- 0.35×
- Total profit
- $-45,497
- Equity at exit
- $37,276
- IRR
- -18.2%
- Equity multiple
- 0.13×
- Total profit
- $-60,797
- Equity at exit
- $21,615
Cash invested: $70,000 (down + closing). Projections, not guarantees.
Landlord ↔ Tenant lean methodology
- Overall (STATE)
- 27 Tenant-Leaning
- State Connecticut
- 27 Tenant-Leaning · D+7
- County
- — inherits STATE
- City
- — inherits STATE
ZIP-level market 06457
- Rents YoY
- 0.2%
- Active inventory
- 143
- Price-to-rent
- 10.0×
Monthly cashflow live
- Estimated rent
- $2,080 high interval (Pro) →
- Mortgage (P&I)
- −$1,311
- Tax from tax record
- −$217 /mo · $2,604/yr
- Insurance
- −$104
- HOA
- −$0
- Vacancy / Maint / Mgmt
- −$437
- Net cashflow
- $11
Break-even live
UW: 25.0% down · 7.5% · 30yr · 1.5% tax · 5.0% vac · 8.0% maint · 8.0% mgmt
Financing live
Cash to close
- Down payment
- $62,500
- Closing costs
- $7,500
- Reserves months
- —
- Total cash needed
- —
Loan-product check · same deal, 3 products live
Conventional
25% down · 7.5% · 30yr
- Down + closing
- —
- Monthly P&I
- —
- Monthly cashflow
- —
- DSCR
- —
- Eligible?
- —
Personal DTI + credit; lowest rate.
DSCR
20% down · 8.5% · 30yr
- Down + closing
- —
- Monthly P&I
- —
- Monthly cashflow
- —
- DSCR
- —
- Eligible?
- —
No personal income docs; deal must DSCR.
Hard money
10% down · 12.0% · 12mo
- Down + closing
- —
- Monthly P&I
- —
- Monthly cashflow
- —
- DSCR
- —
- Eligible?
- —
Short-term bridge; refi at stabilization.
Rent comps 14 comps
| Address | Beds | Baths | Sqft | Rent | $/sqft | DOM | Units | Dist |
|---|---|---|---|---|---|---|---|---|
| 5 Hillside Ct Middletown, CT | 2.0 | 1.5 | 874 | $2,200 | $2.52 | 23d | 1 | 0.05mi |
| 63 Maynard St Middletown, CT | 2.0 | 1.0 | 950 | $1,600 | $1.68 | 44d | 1 | 0.24mi |
| 203 E Main St Middletown, CT | 2.0 | 1.0 | 813 | $1,800 | $2.21 | 3d | 1 | 0.45mi |
| 43 McKenzie St Middletown, CT | 2.0 | 1.0 | 981 | $1,800 | $1.83 | 43d | 1 | 0.46mi |
| 75 Birdsey Ave Middletown, CT | 2.0 | 1.0 | 750 | $2,800 | $3.73 | 43d | 1 | 0.68mi |
| 305 S Main St Middletown, CT | 1.0–2.0 | 1.0 | 950 | $1,850 | $1.95 | 1d | 1 | 0.77mi |
| 84 Mill St Unit 1 Middletown, CT | 2.0 | 1.0 | 700 | $1,482 | $2.12 | 23d | 1 | 0.77mi |
| 84 Mill St Unit 1 Middletown, CT | 2.0 | 1.0 | 700 | $1,482 | $2.12 | 14d | 1 | 0.77mi |
| 11 Huber Ave Middletown, CT | 3.0 | 1.0 | 1102 | $2,300 | $2.09 | 23d | 1 | 1.03mi |
| 61 Main St Unit 2 Middletown, CT | 2.0 | 1.0 | 913 | $1,800 | $1.97 | 44d | 1 | 1.04mi |
| 166 College St Unit 2 Middletown, CT | 2.0 | 1.0 | 975 | $1,700 | $1.74 | 16d | 1 | 1.20mi |
| 40 Ferry St Unit 4A Middletown, CT | 2.0 | 2.0 | 1100 | $1,750 | $1.59 | 1d | 1 | 1.49mi |
| 40 Ferry St Middletown, CT | 2.0 | 2.0 | 1100 | $1,750 | $1.59 | 14d | 1 | 1.49mi |
| 60 Ferry St Unit 1A Middletown, CT | 2.0 | 1.0 | 950 | $1,750 | $1.84 | 14d | 1 | 1.49mi |
Listing history 21 events
-
2026-06-18days on market $250,000 Active 35 DOM
-
2026-06-17days on market $250,000 Active 34 DOM
-
2026-06-16days on market $250,000 Active 33 DOM
-
2026-06-15days on market $250,000 Active 32 DOM
-
2026-06-13days on market $250,000 Active 30 DOM
-
2026-06-13days on market $250,000 Active 29 DOM
-
2026-06-10days on market $250,000 Active 27 DOM
-
2026-06-09days on market $250,000 Active 26 DOM
-
2026-06-08days on market $250,000 Active 25 DOM
-
2026-06-07days on market $250,000 Active 24 DOM
-
2026-06-03days on market $250,000 Active 20 DOM
-
2026-06-02days on market $250,000 Active 19 DOM
-
2026-06-01days on market $250,000 Active 18 DOM
-
2026-05-31days on market $250,000 Active 17 DOM
-
2026-05-14$269,900 Active 816-char remark
-
2022-04-28soldstatus $110,000
-
2022-03-21historical
-
2022-03-18$130,000 Active
-
2003-05-12soldstatus $95,000
-
2003-05-09soldstatus $95,000
Show marketing remark (199 chars)
Great price! Located at the end of the street with plenty of parking! Home has new windows, woodwork, electric and more! There are beautiful flower gardens. Alloffers considered and can close fast!!!
-
2003-02-17$99,900
Show marketing remark (199 chars)
Great price! Located at the end of the street with plenty of parking! Home has new windows, woodwork, electric and more! There are beautiful flower gardens. Alloffers considered and can close fast!!!
ⓘ Source: listings_history table (triggers on properties + properties_extension) + one-shot
backfill from property_details.listing_events for pre-trigger history.
Tax reassessment forecast CT · Partial reset (capped growth)
- Current annual tax
- $2,604 · $217/mo
- Projected year-2 tax
- $3,977 · $331/mo
- Expected delta
- +$1,373/yr (+$114/mo · 52.7%)
ⓘ Screening estimate from a state-policy table — verify with the county assessor before closing.
Climate risk First Street
- Flood 1/10 Low FEMA zone X (unshaded) · 0% chance over 30 yrs
- Wildfire 1/10 Low
- Heat 6/10 Major 7 d/yr ≥96°F today · 17 d/yr by 30 yrs out
- Wind 6/10 Major 27% chance of damaging wind over 30 yrs
- Air quality 4/10 Moderate 3 unhealthy d/yr today · 5 by 30 yrs out
Nearby sold comps map
Loading sold comps map…
Walkable amenities ~0.75 mi
Loading nearby amenities…
Taxation est. · year 1
- Rental income
- $24,960
- − Mortgage interest
- −$14,004
- − Property taxes
- −$2,604
- − Insurance
- −$1,250
- − Repairs & maintenance
- −$1,997
- − Management
- −$1,997
- − Depreciation
- −$7,273
- Taxable loss
- −$4,164
- Est. tax savings @ 24.0%
- +$999
- After-tax cash flow
- $1,132/yr
For passive investors: Depreciation is non-cash, so a rental often shows a tax loss while cash-flowing — sheltering income. Rental losses are passive: they offset passive income freely, and up to $25,000/yr can offset ordinary (W-2) income if you actively participate and your MAGI is under $100k (phasing out to $0 by $150k); unused losses carry forward. On sale, claimed depreciation is recaptured at up to 25%, and gains may owe capital-gains tax (a 1031 exchange can defer both). Figures are a year-1 estimate at your 24.0% rate — not tax advice; consult a CPA.
Schools (NCES district)
- District
- Middletown School District
- NCES district ID
- 0902490
- Math proficiency
- 24% ▼ -15.00%
- Reading proficiency
- 44% ▼ -8.00%
- Median HH income
- $60,733
- Composite
- 30.47/100
- National rank
- #6224
- State rank
- #113 of 153 in CT
Livability — Middletown
- Score
- 81/100
- State rank
- #17
- US rank
- #1390
Category grades
Schools grade is shown separately in the Schools card above.
Census & demographics
- Census place
- Middletown, CT
- County
- Middlesex County · 63,941 people
- City population
- 46,720
- Metro
- Hartford-East Hartford-Middletown, CT
- Population (ZIP)
- 46,720
- Household income
- $79,463
- Rent vs Own
- Severe rent burden
- 2196.0
Population outlook (Lower Connecticut River Valley County) Hauer SSP2
- By 2040
- 188,651
Race, ethnicity, and origin ACS 2023
- Neighborhood character
- Majority White (65%)
- Race & ethnicity
- White 65% Black 13% Hispanic / Latino 12% Two or more races 9% Asian 5%
- Hispanic origin (detail)
- Mexican 1% Puerto Rican 7%
- Common ancestry
- Romanian 9% Lithuanian 5% Slovak 2%
- Foreign-born
- 12% · Canada, China
- Languages at home
- 82% English-only · Spanish 6% Other Indo-European 4% Russian/Polish/Slavic 2%
Political lean MEDSL · Lower Connecticut River Valley
- 2024 margin
- D (+13.4) · D 55.9% · R 42.4% · Other 1.7%
- All cycles
- 2024: D+13.4
Not yet ingested
- Civics
- —
Market trends
- HPI YoY
- ▼ -470.20%
- Current HPI
- 255.1597
- Rent YoY
- ▲ 0.22%
- Metro
- Hartford-East Hartford-Middletown, CT
- State GDP YoY
- ▲ 1.06%
- F500 in state
- 38
Industry mix (Fortune 500 HQ in CT)
| Industry | F500 HQs | Revenue |
|---|---|---|
| Industrial Machinery | 4 | $38B |
|
||
| Insurance | 3 | $71B |
|
||
| Financial Services | 2 | $25B |
|
||
| Transportation / Logistics | 2 | $18B |
|
||
| Healthcare | 1 | $247B |
|
||
| Telecommunications | 1 | $55B |
|
||
Price history
+150.3% since first listed8 events — show timeline
- 2026-05-26 Price Changed $250,000 Smart MLS
- 2026-05-14 Listed $269,900 Smart MLS
- 2022-04-28 Sold (Public Records) $110,000 Public Records
- 2022-03-21 Listing Removed — Smart MLS
- 2022-03-18 Listed $130,000 Smart MLS
- 2003-05-12 Sold (Public Records) $95,000 Public Records
- 2003-05-09 Sold (MLS) $95,000 Smart MLS
- 2003-02-17 Listed $99,900 Smart MLS
Property tax history
-1.2%/yrLatest (2022): $2,604 · +0.5% YoY. Source: county tax records.
Cash-flow waterfall
monthlySold comps — $/sqft
last 12 mo · ≤1 miLoading sold comps…