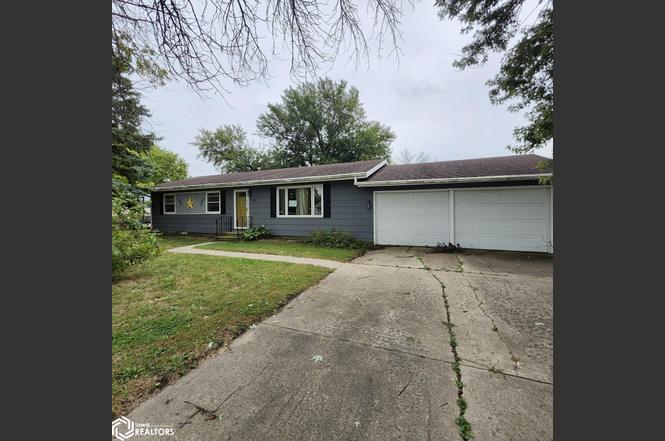
2434 Elm Dr Dr · Coalville, IA
Flood risk 1/10 · Minimal
- FEMA flood zone
- X (unshaded)
- Chance of flooding over 30 yrs
- 0.0%
- Est. flood insurance / yr
- $473 – $860
Fire risk 4/10 · Minor
- Est. fire insurance / yr
- $902 – $1,676
Heat risk 2/10 · Minimal
- Hot days now (above 102°F)
- 7 days/yr
- Hot days in 30 yrs
- 15 days/yr
Wind risk 2/10 · Minimal
- Chance of severe wind over 30 yrs
- —
Air-quality risk 1/10 · Minimal
- Unhealthy air days now
- 0 days/yr
- Unhealthy air days in 30 yrs
- 0 days/yr
Risk factors via First Street. Map © Google.
Why this score? — see what drove the C+ grade
The composite is a weighted blend of 9 inputs, each scored 0–100. Each bar is that input's sub-score; the figure is the points it added to the 100-point composite (weight × sub-score).
- Cash flow +30.0/30.0
- 1% rule +10.0/10.0
- DSCR +10.0/10.0
- Schools +4.1/10.0
- Livability +3.3/5.0
- Rent growth +2.5/5.0
- Condition / age +2.5/5.0
- ARV discount +0.0/15.0
- Appreciation +0.0/10.0
$76,728
🖨 Deal sheet 📄 Offer letter ✓ Due diligence
Listing remarks
3 bdrm Ranch home located in a quiet neighborhood located south of Fort Dodge with quick access to Fort Dodge, Humboldt or Webster City. Fenced backyard with space for a garden and room to hang out.
Key facts
- Ranch home
- Quiet neighborhood
- Fenced backyard
Tags
Neighborhood map
What this means for you Summary
Snapshot
- This is a 3-bed/1.5-bath single-family listed at $77k.
Deal economics
- At list price, monthly cash flow is $343 ($4k/yr) — positive.
- The deal already cash-flows at list — no discount required.
- Meets the 1% rule at list price ($1k rent vs $77k).
- Recommended offer: $68k (12.0% below list) — sets the bar for market timing.
Location & tenants
- Location reads 66/100 on livability (#539 in IA) — a middle-class / working-renter tenant base. Strengths: cost of living A+, housing A+; Watch: schools D-, amenities F, commute F.
- Fort Dodge Community School District (town): math 44% / reading 53% proficiency, ranked #285 of 289 in IA (top 99%) — families likely to look elsewhere, expect single-tenant / working-renter base with shorter leases.
- Market conditions: 36 active listings in the ZIP; 25 units permitted in Webster County in 2024 (0 in 5+ unit buildings).
Forward outlook
- Local home prices are declining (-3.0%/yr); year-one equity from $530 of loan paydown is wiped out by about $2k of value loss. Plan a longer hold.
- Webster County population projected to shrink 7% by 2050 — rents likely to lag national; underwrite the cash flow, not the appreciation.
- At projected returns (-3.0% appreciation + 3.0% rent growth), your $21k cash investment doubles in ~7 years — after that, you're playing with house money.
Negotiation context
- It's been on market 154 days — a 12% lower offer ($68k) is reasonable based on typical stale-listing flexibility.
Questions for the listing agent
- It's been on market 154 days. Have you received any prior offers? Is the seller open to a 12% concession, seller financing, or rate buy-down credit?
- Built in 1975 — when were the roof, HVAC, electrical panel, plumbing, and water heater last replaced?
- Why hasn't it sold? Are there any deal-killer items the seller is aware of (foundation, flood, title, zoning, code violations)?
- Is there a deadline driving the sale (1031 exchange, divorce, estate, relocation)? That informs how much negotiation room exists.
- Schools are D-rated, which usually means shorter tenancies and higher turnover. Who's the typical renter profile here, and what's been the actual vacancy rate?
- What's the average days-on-market for RENTAL listings here right now (not sales)? A rising rental-DOM trend means longer vacancies and softer asking-rent achievability than the comps imply.
- What's the recent tenant-quality profile in this submarket — average credit score on applications, eviction rate, late-payment / NSF rate, and stable-employment percentage? A property-management company in the area should have these aggregated.
- How much new for-sale + rental construction is in the pipeline within 1–3 miles? Heavy new supply typically softens prices + rents 12–24 months out; constrained supply supports both.
Investment metrics
- 1% rule
- 1.53% ✓
- Cap rate
- 11.66%
- Cash-on-cash
- 19.18%
- DSCR
- 1.85
- GRM
- 5.5
CMA / ARV
- ARV (on-the-fly)
- $64,328
- Comps found
- 1
Show comp detail 1 sale within ~0.75 mi
| Address | Dist | Beds/Ba | Sqft | Sold | Price | $/sf | Match |
|---|---|---|---|---|---|---|---|
| 23863 Hays St | 0.59mi | 3/1.5 | 1,347 (-10%) | 19mo | $58,000 | $43 | 40 |
Match score weights: distance 35% · size 25% · config 20% · recency 20%. Top-matched comps best support the ARV.
Projected returns pro-forma
-3.0% appreciation · 3.0% rent growth · sell at horizon
- IRR
- 11.1%
- Equity multiple
- 1.44×
- Total profit
- $9,485
- Equity at exit
- $11,440
- IRR
- 20.2%
- Equity multiple
- 2.70×
- Total profit
- $36,622
- Equity at exit
- $6,634
Cash invested: $21,484 (down + closing). Projections, not guarantees.
Landlord ↔ Tenant lean methodology
- Overall (STATE)
- 83 Strongly Landlord-Friendly
- State Iowa
- 83 Strongly Landlord-Friendly · R+6
- County
- — inherits STATE
- City
- — inherits STATE
ZIP-level market 50501
- Home prices YoY
- -33.1%
- Active inventory
- 36
- Price-to-rent
- 5.5×
Monthly cashflow live
- Estimated rent
- $1,173 medium interval (Pro) →
- Mortgage (P&I)
- −$402
- Tax from tax record
- −$149 /mo · $1,784/yr
- Insurance
- −$32
- HOA
- −$0
- Vacancy / Maint / Mgmt
- −$246
- Net cashflow
- $343
Break-even live
UW: 25.0% down · 7.5% · 30yr · 1.5% tax · 5.0% vac · 8.0% maint · 8.0% mgmt
Financing live
Cash to close
- Down payment
- $19,182
- Closing costs
- $2,302
- Reserves months
- —
- Total cash needed
- —
Loan-product check · same deal, 3 products live
Conventional
25% down · 7.5% · 30yr
- Down + closing
- —
- Monthly P&I
- —
- Monthly cashflow
- —
- DSCR
- —
- Eligible?
- —
Personal DTI + credit; lowest rate.
DSCR
20% down · 8.5% · 30yr
- Down + closing
- —
- Monthly P&I
- —
- Monthly cashflow
- —
- DSCR
- —
- Eligible?
- —
No personal income docs; deal must DSCR.
Hard money
10% down · 12.0% · 12mo
- Down + closing
- —
- Monthly P&I
- —
- Monthly cashflow
- —
- DSCR
- —
- Eligible?
- —
Short-term bridge; refi at stabilization.
Listing history 7 events
-
2026-02-19status Pending
-
2026-01-26price $76,728
-
2025-11-21price $86,319
-
2025-10-23price $91,115
-
2025-09-17$95,910 Active
-
2015-02-05soldstatus $90,000
-
2007-08-15soldstatus $75,000
ⓘ Source: listings_history table (triggers on properties + properties_extension) + one-shot
backfill from property_details.listing_events for pre-trigger history.
Tax reassessment forecast IA · Partial reset (capped growth)
- Current annual tax
- $1,784 · $149/mo
- Projected year-2 tax
- $1,784 · $149/mo
- Expected delta
- $0/yr ($0/mo · 0.0%)
ⓘ Screening estimate from a state-policy table — verify with the county assessor before closing.
Climate risk First Street
- Flood 1/10 Low FEMA zone X (unshaded) · 0% chance over 30 yrs
- Wildfire 4/10 Moderate
- Heat 2/10 Low 7 d/yr ≥102°F today · 15 d/yr by 30 yrs out
- Wind 2/10 Low
- Air quality 1/10 Low 0 unhealthy d/yr today · 0 by 30 yrs out
Nearby sold comps map
Loading sold comps map…
Walkable amenities ~0.75 mi
Loading nearby amenities…
Taxation est. · year 1
- Rental income
- $14,071
- − Mortgage interest
- −$4,298
- − Property taxes
- −$1,784
- − Insurance
- −$384
- − Repairs & maintenance
- −$1,126
- − Management
- −$1,126
- − Depreciation
- −$2,232
- Taxable income
- $3,122
- Est. tax owed @ 24.0%
- −$749
- After-tax cash flow
- $3,371/yr
For passive investors: Depreciation is non-cash, so a rental often shows a tax loss while cash-flowing — sheltering income. Rental losses are passive: they offset passive income freely, and up to $25,000/yr can offset ordinary (W-2) income if you actively participate and your MAGI is under $100k (phasing out to $0 by $150k); unused losses carry forward. On sale, claimed depreciation is recaptured at up to 25%, and gains may owe capital-gains tax (a 1031 exchange can defer both). Figures are a year-1 estimate at your 24.0% rate — not tax advice; consult a CPA.
Schools (NCES district)
- District
- Fort Dodge Community School District
- NCES district ID
- 1911820
- Math proficiency
- 44% ▼ -3.00%
- Reading proficiency
- 53% ▼ -2.00%
- Median HH income
- $39,807
- Composite
- 40.54/100
- National rank
- #3700
- State rank
- #285 of 289 in IA
Livability — Coalville
- Score
- 66/100
- State rank
- #539
- US rank
- #12041
Category grades
Schools grade is shown separately in the Schools card above.
Census & demographics
- Census place
- Coalville, IA
- County
- Webster County · 28,823 people
- Metro
- Fort Dodge, IA
- Population (ZIP)
- 28,823
- Household income
- $66,888
- Rent vs Own
- Severe rent burden
- 673.0
Population outlook (Webster County) Hauer SSP2
- Today (2025)
- 35,895 people
- By 2030
- 35,334 · -1.6%
- By 2040
- 34,073 · -5.1%
- By 2050
- 33,264 · -7.3%
- By 2075
- 32,560 · -9.3%
- By 2100
- 30,786 · -14.2%
Race, ethnicity, and origin ACS 2023
- Neighborhood character
- Predominantly White (82%)
- Race & ethnicity
- White 82% Two or more races 8% Hispanic / Latino 7% Black 4% Asian 1%
- Hispanic origin (detail)
- Mexican 4%
- Common ancestry
- Portuguese 7% Slovak 2% Iranian 1%
- Foreign-born
- 4% · Canada, South Korea, China
- Languages at home
- 93% English-only · Spanish 4% German/W. Germanic 1% French/Haitian/Cajun 0%
Political lean MEDSL · Webster
- 2024 margin
- Solid R (+31.2) · D 33.8% · R 65.0% · Other 1.3%
- 2008→2024 swing
- -39.7pp toward R · 2008: 8.5pp · 2024: -31.2pp
- All cycles
- 2024: R+31.2 2020: R+24.3 2016: R+21.8 2012: D+5.5 2008: D+8.5
Not yet ingested
- Civics
- —
Market trends
- HPI YoY
- ▼ -95.63%
- Current HPI
- 193.5846
- Rent YoY
- —
- Metro
- Fort Dodge, IA
- State GDP YoY
- ▲ 2.48%
- F500 in state
- 4
Industry mix (Fortune 500 HQ in IA)
| Industry | F500 HQs | Revenue |
|---|---|---|
| Financial Services | 1 | $16B |
|
||
| Retail / Convenience | 1 | $15B |
|
||
Price history
+2.3% since first listed7 events — show timeline
- 2026-02-19 Pending — IAR
- 2026-01-26 Price Changed $76,728 IAR
- 2025-11-21 Price Changed $86,319 IAR
- 2025-10-23 Price Changed $91,115 IAR
- 2025-09-17 Listed $95,910 IAR
- 2015-02-05 Sold (Public Records) $90,000 Public Records
- 2007-08-15 Sold (Public Records) $75,000 Public Records
Property tax history
+4.1%/yrLatest (2025): $1,784 · +7.0% YoY. Source: county tax records.
Cash-flow waterfall
monthlySold comps — $/sqft
last 12 mo · ≤1 miLoading sold comps…