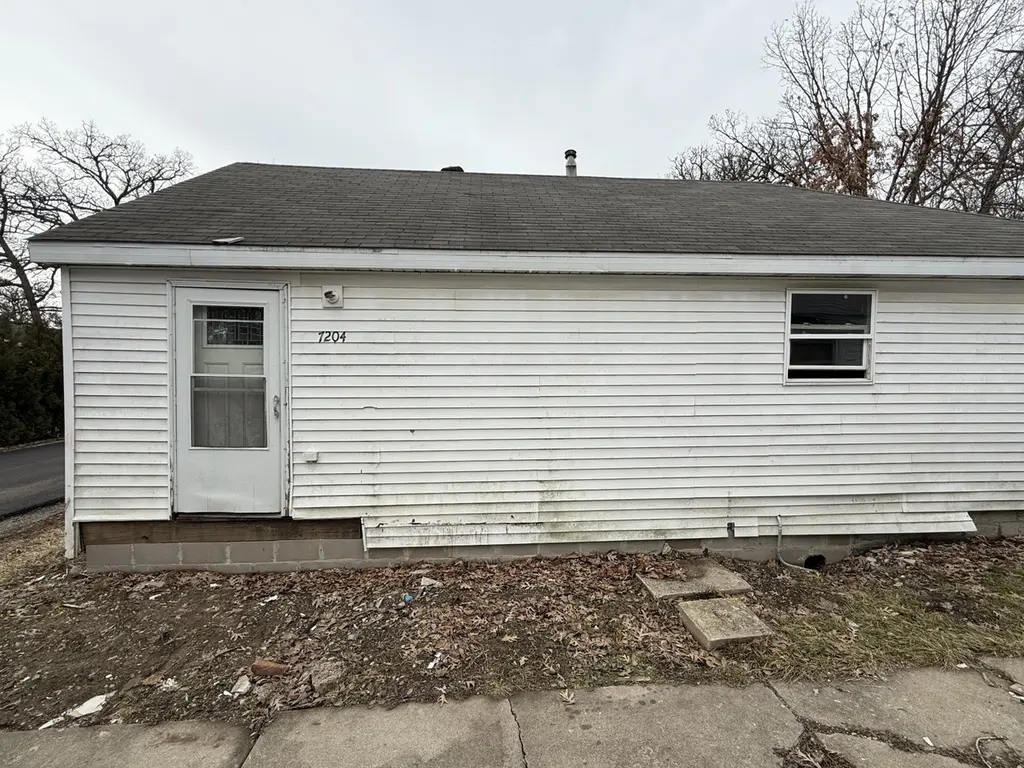
7204 W 129th Ln · Cedar Lake, IN
Flood risk 1/10 · Minimal
- FEMA flood zone
- X (unshaded)
- Chance of flooding over 30 yrs
- 0.0%
- Est. flood insurance / yr
- $507 – $1,088
Fire risk 2/10 · Minimal
- Est. fire insurance / yr
- $717 – $1,331
Heat risk 2/10 · Minimal
- Hot days now (above 100°F)
- 7 days/yr
- Hot days in 30 yrs
- 15 days/yr
Wind risk 2/10 · Minimal
- Chance of severe wind over 30 yrs
- 0.0%
Air-quality risk 2/10 · Minimal
- Unhealthy air days now
- 1 days/yr
- Unhealthy air days in 30 yrs
- 1 days/yr
Risk factors via First Street. Map © Google.
Why this score? — see what drove the B grade
The composite is a weighted blend of 9 inputs, each scored 0–100. Each bar is that input's sub-score; the figure is the points it added to the 100-point composite (weight × sub-score).
- Cash flow +30.0/30.0
- 1% rule +10.0/10.0
- DSCR +10.0/10.0
- ARV discount +7.5/15.0
- Schools +5.0/10.0
- Livability +3.2/5.0
- Rent growth +2.5/5.0
- Condition / age +2.5/5.0
- Appreciation +0.0/10.0
$65,000
🖨 Deal sheet (PDF) 📄 Offer letter ✓ Due diligence
Listing remarks MLS
Come see this fixer-upper in Cedar Lake. Property has lots of potential. Seller is selling this property "AS IS". Buyer is responsible for making sure any past or future repairs on the property are up to local city codes.
Key facts
- 4,700 sq ft lot
- 2 garage spots
- Built 1912
Neighborhood map
What this means for you Summary
Snapshot
- This is a 2-bed/1.0-bath single-family listed at $65k.
Deal economics
- At list price, monthly cash flow is $743 ($9k/yr) — positive.
- The deal already cash-flows at list — no discount required.
- Meets the 1% rule at list price ($2k rent vs $65k).
- Recommended offer: $59k (9.0% below list) — sets the bar for market timing.
- Cap rate 20.0% vs local median 3.5% in Cedar Lake — top-decile yield for the area; either an underpriced asset or a hidden risk that comps aren't pricing in. Stress-test before assuming the spread holds.
Location & tenants
- Location reads 65/100 on livability (#354 in IN) — a middle-class / working-renter tenant base. Strengths: crime A+, cost of living A+, housing A+; Watch: amenities F, commute F, health & safety F.
- Crown Point Community School Corporation (suburban): math 51% / reading 61% proficiency, ranked #23 of 301 in IN (top 8%) — acceptable for families but not a draw, mixed tenant base, ~2y average lease; only 18% free/reduced lunch — higher-income household profile.
- Zoned schools: Douglas Macarthur Elem School (math 50% / reading 51%, grade D+, #269 of 994 statewide, top 27%, 439 students, 33% FRL); Robert Taft Middle School (math 37% / reading 57%, grade D+, #65 of 330 statewide, top 21%, 1,091 students, 23% FRL); Crown Point High School (math 51% / reading 80%, grade B, #29 of 369 statewide, top 8%, 2,948 students, 22% FRL).
- Market conditions: 270 active listings in the ZIP; 2 comparable units currently listed for rent nearby; solid renter incomes; 1,642 units permitted in Lake County in 2024 (14 in 5+ unit buildings).
Forward outlook
- Local home prices are declining (-3.0%/yr); year-one equity from $449 of loan paydown is wiped out by about $2k of value loss. Plan a longer hold.
- Lake County population projected to shrink 7% by 2050 — rents likely to lag national; underwrite the cash flow, not the appreciation.
- At projected returns (-3.0% appreciation + 3.0% rent growth), your $18k cash investment doubles in ~3 years — after that, you're playing with house money.
Negotiation context
- It's been on market 95 days — a 9% lower offer ($59k) is reasonable based on typical stale-listing flexibility.
- 8 sale attempts since 27y ago; this cycle's ask has dropped $15k (19%) from the opening price — seller is motivated, your offer sets the floor, not the list.
Risks & watch-outs
- Watch-outs: property tax is 2.7% of price; built in 1912 — expect roof / HVAC / electrical / plumbing capex.
Questions for the listing agent
- It's been on market 95 days. Have you received any prior offers? Is the seller open to a 9% concession, seller financing, or rate buy-down credit?
- Built in 1912 — when were the roof, HVAC, electrical panel, plumbing, and water heater last replaced?
- Property tax is high relative to price — has the assessment been appealed recently, and will the sale trigger a re-assessment?
- Why hasn't it sold? Are there any deal-killer items the seller is aware of (foundation, flood, title, zoning, code violations)?
- Is there a deadline driving the sale (1031 exchange, divorce, estate, relocation)? That informs how much negotiation room exists.
- What's the average days-on-market for RENTAL listings here right now (not sales)? A rising rental-DOM trend means longer vacancies and softer asking-rent achievability than the comps imply.
- What's the recent tenant-quality profile in this submarket — average credit score on applications, eviction rate, late-payment / NSF rate, and stable-employment percentage? A property-management company in the area should have these aggregated.
- How much new for-sale + rental construction is in the pipeline within 1–3 miles? Heavy new supply typically softens prices + rents 12–24 months out; constrained supply supports both.
Investment metrics
- 1% rule
- 2.45% ✓
- Cap rate
- 20.02%
- Cash-on-cash
- 49.01%
- DSCR
- 3.18
- GRM
- 3.4
CMA / ARV
- ARV (median comp)
- $190,925
- List price
- $65,000
- Delta
- -65.96%
- Verdict
- UNDERPRICED
- Comps
- 20 within 1.0 mi
Show comp detail 12 sales within ~0.75 mi
| Address | Dist | Beds/Ba | Sqft | Sold | Price | $/sf | Match |
|---|---|---|---|---|---|---|---|
| 7125 W 128th Ln | 0.11mi | 2/1.0 | 908 (+6%) | 13mo | $205,000 | $226 | 75 |
| 7529 W 126th Ave | 0.39mi | 2/1.0 | 875 (+2%) | 8mo | $105,000 | $120 | 72 |
| 6915 W 130th Pl | 0.27mi | 1/1.0 (-1) | 872 (+2%) | 11mo | $105,000 | $120 | 70 |
| 12805 Hilltop St | 0.27mi | 3/1.0 (+1) | 882 (+3%) | 15mo | $183,680 | $208 | 65 |
| 7522 W 129th Ave | 0.19mi | 2/1.0 | 908 (+6%) | 21mo | $197,000 | $217 | 64 |
| 6819 W 128th Pl | 0.28mi | 3/1.0 (+1) | 800 (-7%) | 12mo | $170,000 | $213 | 60 |
| 13129 Morse St | 0.28mi | 2/1.0 | 968 (+13%) | 9mo | $167,000 | $173 | 58 |
| 7409 W 129th Ave | 0.14mi | 2/1.0 | 738 (-14%) | 15mo | $198,000 | $268 | 58 |
| 7216 W 128th Ln | 0.12mi | 2/1.0 | 751 (-12%) | 22mo | $130,000 | $173 | 56 |
| 12732 Edison St | 0.27mi | 2/1.0 | 744 (-13%) | 13mo | $206,000 | $277 | 54 |
| 13341 Fulton St | 0.59mi | 2/2.0 | 952 (+11%) | 5mo | $292,000 | $307 | 46 |
| 12624 Sunnyside Pl | 0.64mi | 3/1.0 (+1) | 966 (+13%) | 5mo | $203,000 | $210 | 40 |
Match score weights: distance 35% · size 25% · config 20% · recency 20%. Top-matched comps best support the ARV.
Projected returns pro-forma
-3.0% appreciation · 3.0% rent growth · sell at horizon
- IRR
- 46.6%
- Equity multiple
- 3.03×
- Total profit
- $36,875
- Equity at exit
- $9,692
- IRR
- 52.4%
- Equity multiple
- 6.13×
- Total profit
- $93,330
- Equity at exit
- $5,620
Cash invested: $18,200 (down + closing). Projections, not guarantees.
Landlord ↔ Tenant lean methodology
- Overall (STATE)
- 90 Strongly Landlord-Friendly
- State Indiana
- 90 Strongly Landlord-Friendly · R+11
- County
- — inherits STATE
- City
- — inherits STATE
ZIP-level market 46303
- Active inventory
- 270
- Price-to-rent
- 3.4×
Monthly cashflow live
- Estimated rent
- $1,590 medium interval (Pro) →
- Mortgage (P&I)
- −$341
- Tax from tax record
- −$145 /mo · $1,740/yr
- Insurance
- −$27
- HOA
- −$0
- Vacancy / Maint / Mgmt
- −$334
- Net cashflow
- $743
Break-even live
Sensitivity live
| Price | -10% $780 | -5% $762 | +0% $743 | +5% $725 | +10% $707 |
|---|---|---|---|---|---|
| Rent | -10% $618 | -5% $681 | +0% $743 | +5% $806 | +10% $869 |
| Rate | -1.0pp $776 | -0.5pp $760 | base $743 | +0.5pp $727 | +1.0pp $709 |
UW: 25.0% down · 7.5% · 30yr · 1.5% tax · 5.0% vac · 8.0% maint · 8.0% mgmt
Financing live
Cash to close
- Down payment
- $16,250
- Closing costs
- $1,950
- Reserves months
- —
- Total cash needed
- —
Loan-product check · same deal, 3 products live
Conventional
25% down · 7.5% · 30yr
- Down + closing
- —
- Monthly P&I
- —
- Monthly cashflow
- —
- DSCR
- —
- Eligible?
- —
Personal DTI + credit; lowest rate.
DSCR
20% down · 8.5% · 30yr
- Down + closing
- —
- Monthly P&I
- —
- Monthly cashflow
- —
- DSCR
- —
- Eligible?
- —
No personal income docs; deal must DSCR.
Hard money
10% down · 12.0% · 12mo
- Down + closing
- —
- Monthly P&I
- —
- Monthly cashflow
- —
- DSCR
- —
- Eligible?
- —
Short-term bridge; refi at stabilization.
Rent comps 2 comps
| Address | Beds | Baths | Sqft | Rent | $/sqft | DOM | Units | Dist |
|---|---|---|---|---|---|---|---|---|
| 12910 S Cline Ave Apt C Cedar Lake, IN | 2.0 | 1.0 | 1056 | $1,150 | $1.09 | 0d | 1 | 0.49mi |
| 13328 Edison St Cedar Lake, IN | 3.0 | 2.0 | 1125 | $2,095 | $1.86 | 0d | 1 | 0.61mi |
Listing history 35 events
-
2026-06-21days on market $65,000 Active 95 DOM
-
2026-06-18days on market $65,000 Active 92 DOM
-
2026-06-17days on market $65,000 Active 91 DOM
-
2026-06-16days on market $65,000 Active 90 DOM
-
2026-06-15days on market $65,000 Active 89 DOM
-
2026-06-13days on market $65,000 Active 87 DOM
-
2026-06-13days on market $65,000 Active 86 DOM
-
2026-06-09days on market $65,000 Active 83 DOM
-
2026-06-08days on market $65,000 Active 82 DOM
-
2026-06-07days on market $65,000 Active 81 DOM
-
2026-06-04days on market $65,000 Active 78 DOM
-
2026-06-03days on market $65,000 Active 77 DOM
-
2026-06-02days on market $65,000 Active 76 DOM
-
2026-06-01days on market $65,000 Active 75 DOM
-
2026-05-31days on market $65,000 Active 74 DOM
-
2026-05-06price $65,000 231-char remark
Show marketing remark (231 chars)
Come see this fixer-upper in Cedar Lake. Property has lots of potential. Seller is selling this property "AS IS". Buyer is responsible for making sure any past or future repairs on the property are up to local city codes.
-
2026-04-25price $70,000 231-char remark
Show marketing remark (231 chars)
Come see this fixer-upper in Cedar Lake. Property has lots of potential. Seller is selling this property "AS IS". Buyer is responsible for making sure any past or future repairs on the property are up to local city codes.
-
2026-03-27price $78,000 231-char remark
Show marketing remark (231 chars)
Come see this fixer-upper in Cedar Lake. Property has lots of potential. Seller is selling this property "AS IS". Buyer is responsible for making sure any past or future repairs on the property are up to local city codes.
-
2026-03-18$80,000 Active 231-char remark
Show marketing remark (231 chars)
Come see this fixer-upper in Cedar Lake. Property has lots of potential. Seller is selling this property "AS IS". Buyer is responsible for making sure any past or future repairs on the property are up to local city codes.
-
2025-06-09soldstatus $60,000 Closed 263-char remark
Show marketing remark (263 chars)
3 Bedroom, 1 bathroom ranch style home. This property is just a few blocks away from the Lake! Fixer Upper!! Could be a great flip or a rental property for an investor. Buyers are encouraged to perform all due diligence prior to making an offer. CASH OFFERS ONLY!
-
2025-05-23status Pending 263-char remark
Show marketing remark (263 chars)
3 Bedroom, 1 bathroom ranch style home. This property is just a few blocks away from the Lake! Fixer Upper!! Could be a great flip or a rental property for an investor. Buyers are encouraged to perform all due diligence prior to making an offer. CASH OFFERS ONLY!
-
2025-05-10price $75,000 263-char remark
Show marketing remark (263 chars)
3 Bedroom, 1 bathroom ranch style home. This property is just a few blocks away from the Lake! Fixer Upper!! Could be a great flip or a rental property for an investor. Buyers are encouraged to perform all due diligence prior to making an offer. CASH OFFERS ONLY!
-
2025-04-23price $79,000 263-char remark
Show marketing remark (263 chars)
3 Bedroom, 1 bathroom ranch style home. This property is just a few blocks away from the Lake! Fixer Upper!! Could be a great flip or a rental property for an investor. Buyers are encouraged to perform all due diligence prior to making an offer. CASH OFFERS ONLY!
-
2025-04-16$80,000 Active 263-char remark
Show marketing remark (263 chars)
3 Bedroom, 1 bathroom ranch style home. This property is just a few blocks away from the Lake! Fixer Upper!! Could be a great flip or a rental property for an investor. Buyers are encouraged to perform all due diligence prior to making an offer. CASH OFFERS ONLY!
-
2002-11-01$39,500
-
2002-10-31historical
-
2002-03-21$41,500
-
2001-12-11historical
-
2001-10-12$52,500
-
2001-09-19historical
-
2001-08-08$72,500
-
2001-05-18historical
-
2001-03-01$52,500
-
1999-10-29historical
-
1999-07-29$57,000
ⓘ Source: listings_history table (triggers on properties + properties_extension) + one-shot
backfill from property_details.listing_events for pre-trigger history.
Tax reassessment forecast IN · Partial reset (capped growth)
- Current annual tax
- $1,740 · $145/mo
- Projected year-2 tax
- $1,740 · $145/mo
- Expected delta
- $0/yr ($0/mo · 0.0%)
ⓘ Screening estimate from a state-policy table — verify with the county assessor before closing.
Climate risk First Street
- Flood 1/10 Low FEMA zone X (unshaded) · 0% chance over 30 yrs
- Wildfire 2/10 Low
- Heat 2/10 Low 7 d/yr ≥100°F today · 15 d/yr by 30 yrs out
- Wind 2/10 Low 0% chance of damaging wind over 30 yrs
- Air quality 2/10 Low 1 unhealthy d/yr today · 1 by 30 yrs out
Nearby sold comps map
Loading sold comps map…
Walkable amenities ~0.75 mi
Loading nearby amenities…
Taxation est. · year 1
- Rental income
- $19,083
- − Mortgage interest
- −$3,641
- − Property taxes
- −$1,740
- − Insurance
- −$325
- − Repairs & maintenance
- −$1,527
- − Management
- −$1,527
- − Depreciation
- −$1,891
- Taxable income
- $8,433
- Est. tax owed @ 24.0%
- −$2,024
- After-tax cash flow
- $6,896/yr
For passive investors: Depreciation is non-cash, so a rental often shows a tax loss while cash-flowing — sheltering income. Rental losses are passive: they offset passive income freely, and up to $25,000/yr can offset ordinary (W-2) income if you actively participate and your MAGI is under $100k (phasing out to $0 by $150k); unused losses carry forward. On sale, claimed depreciation is recaptured at up to 25%, and gains may owe capital-gains tax (a 1031 exchange can defer both). Figures are a year-1 estimate at your 24.0% rate — not tax advice; consult a CPA.
Schools (NCES district)
- District
- Crown Point Community School Corporation
- NCES district ID
- 1802490
- Math proficiency
- 51% ▼ -9.00%
- Reading proficiency
- 61% ▼ -8.00%
- Median HH income
- $69,148
- Composite
- 49.55/100
- National rank
- #1990
- State rank
- #23 of 301 in IN
Livability — Cedar Lake
- Score
- 65/100
- State rank
- #354
- US rank
- #13482
Category grades
Schools grade is shown separately in the Schools card above.
Census & demographics
- Census place
- Cedar Lake, IN
- County
- Lake County · 422,878 people
- City population
- 17,680
- Metro
- Chicago-Naperville-Elgin, IL-IN-WI
- Population (ZIP)
- 17,680
- Household income
- $84,211
- Rent vs Own
- Severe rent burden
- 84.0
Population outlook (Lake County) Hauer SSP2
- Today (2025)
- 484,026 people
- By 2030
- 478,091 · -1.2%
- By 2040
- 462,974 · -4.3%
- By 2050
- 449,894 · -7.1%
- By 2075
- 436,169 · -9.9%
- By 2100
- 426,607 · -11.9%
Race, ethnicity, and origin ACS 2023
- Neighborhood character
- Predominantly White (88%)
- Race & ethnicity
- White 88% Hispanic / Latino 8% Two or more races 7%
- Hispanic origin (detail)
- Mexican 7%
- Common ancestry
- Romanian 16% Iranian 9% Italian 1%
- Foreign-born
- 2% · China
- Languages at home
- 95% English-only · Other Indo-European 2% Russian/Polish/Slavic 2% Spanish 2%
Political lean MEDSL · Lake
- 2024 margin
- Lean D (+5.6) · D 52.1% · R 46.5% · Other 1.5%
- 2008→2024 swing
- -28.6pp toward R · 2008: 34.3pp · 2024: 5.6pp
- All cycles
- 2024: D+5.6 2020: D+15.1 2016: D+20.6 2012: D+31.0 2008: D+34.3
Not yet ingested
- Civics
- —
Market trends
- HPI YoY
- ▼ -182.94%
- Current HPI
- 267.4434
- Rent YoY
- —
- Metro
- Chicago-Naperville-Elgin, IL-IN-WI
- State GDP YoY
- ▲ 2.90%
- F500 in state
- 18
Industry mix (Fortune 500 HQ in IN)
| Industry | F500 HQs | Revenue |
|---|---|---|
| Industrial Machinery | 2 | $37B |
|
||
| Healthcare | 1 | $177B |
|
||
| Pharmaceuticals | 1 | $45B |
|
||
| Metals / Steel | 1 | $18B |
|
||
| Agriculture | 1 | $17B |
|
||
| Packaging | 1 | $12B |
|
||
Price history
+14.0% since first listed20 events — show timeline
- 2026-05-06 Price Changed $65,000 NIRA MLS as Distributed by MLS Grid
- 2026-04-25 Price Changed $70,000 NIRA MLS as Distributed by MLS Grid
- 2026-03-27 Price Changed $78,000 NIRA MLS as Distributed by MLS Grid
- 2026-03-18 Listed $80,000 NIRA MLS as Distributed by MLS Grid
- 2025-06-09 Sold (MLS) $60,000 NIRA MLS as Distributed by MLS Grid
- 2025-05-23 Pending — NIRA MLS as Distributed by MLS Grid
- 2025-05-10 Price Changed $75,000 NIRA MLS as Distributed by MLS Grid
- 2025-04-23 Price Changed $79,000 NIRA MLS as Distributed by MLS Grid
- 2025-04-16 Listed $80,000 NIRA MLS as Distributed by MLS Grid
- 2002-11-01 Listed $39,500 NIRA MLS as Distributed by MLS Grid
- 2002-10-31 Listing Removed — NIRA MLS as Distributed by MLS Grid
- 2002-03-21 Listed $41,500 NIRA MLS as Distributed by MLS Grid
- 2001-12-11 Listing Removed — NIRA MLS as Distributed by MLS Grid
- 2001-10-12 Listed $52,500 NIRA MLS as Distributed by MLS Grid
- 2001-09-19 Listing Removed — NIRA MLS as Distributed by MLS Grid
- 2001-08-08 Listed $72,500 NIRA MLS as Distributed by MLS Grid
- 2001-05-18 Listing Removed — NIRA MLS as Distributed by MLS Grid
- 2001-03-01 Listed $52,500 NIRA MLS as Distributed by MLS Grid
- 1999-10-29 Listing Removed — NIRA MLS as Distributed by MLS Grid
- 1999-07-29 Listed $57,000 NIRA MLS as Distributed by MLS Grid
Property tax history
+2.8%/yrLatest (2024): $1,740 · +5.1% YoY. Source: county tax records.
Cash-flow waterfall
monthlySold comps — $/sqft
last 12 mo · ≤1 miLoading sold comps…