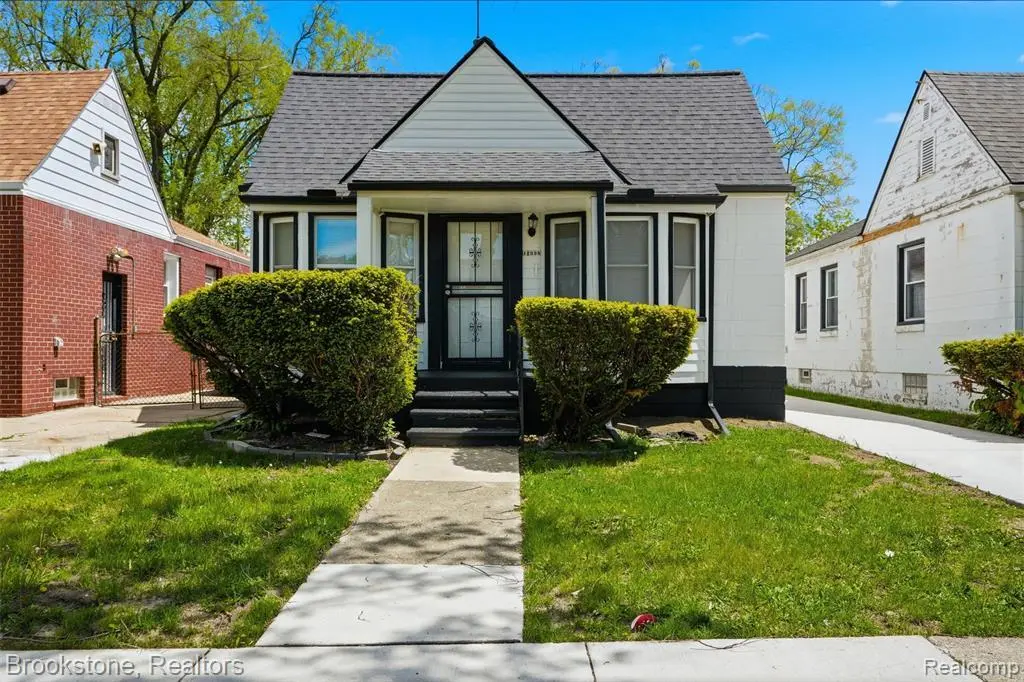
11338 Memorial St · Detroit, MI
Flood risk 1/10 · Minimal
- FEMA flood zone
- X (unshaded)
- Chance of flooding over 30 yrs
- 0.0%
- Est. flood insurance / yr
- $473 – $860
Fire risk 1/10 · Minimal
- Est. fire insurance / yr
- $784 – $1,456
Heat risk 3/10 · Minor
- Hot days now (above 98°F)
- 7 days/yr
- Hot days in 30 yrs
- 15 days/yr
Wind risk 2/10 · Minimal
- Chance of severe wind over 30 yrs
- —
Air-quality risk 3/10 · Minor
- Unhealthy air days now
- 2 days/yr
- Unhealthy air days in 30 yrs
- 5 days/yr
Risk factors via First Street. Map © Google.
Why this score? — see what drove the C+ grade
The composite is a weighted blend of 9 inputs, each scored 0–100. Each bar is that input's sub-score; the figure is the points it added to the 100-point composite (weight × sub-score).
- Cash flow +27.0/30.0
- DSCR +9.4/10.0
- ARV discount +7.5/15.0
- 1% rule +6.3/10.0
- Rent growth +3.9/5.0
- Livability +3.7/5.0
- Condition / age +2.5/5.0
- Schools +1.3/10.0
- Appreciation +0.0/10.0
$120,000
🖨 Deal sheet 📄 Offer letter ✓ Due diligence
Listing remarks MLS
* * * Welcome to your new HOME * * * Come take a look at this newly updated home. Painted with new flooring throughout. Kitchen and bathroom updates that are waiting for your decorating touch. Come drive-up in your newly cemented driveway and a huge backyard ready for your relaxation and celebration. Located near major freeways and schools, local businesses for your convenience come tour and make an offer today!
Key facts
- Near schools
- Local businesses
- Huge backyard
Tags
Property features AI
Finance
- Other:
- Financial info:
- HOA & community:
Exterior
- Parking: Driveway parking; Basement access; no garage
- Security:
- Utilities: Public water; Public sewer
- Home design: Single-family residence; One level; Approximately 1,100 above-grade square feet
- Construction: Block construction; Block foundation
- Exterior features: Paved road access
Interior
- Kitchen:
- Bedrooms:
- Flooring:
- Bathrooms: 1 full bathroom
- Heating & cooling: Forced air heating; Hot water heating; Natural gas heating; No central cooling
- Interior features: Total of 6 rooms; Unfinished basement with sump pump; Ground-level entry with steps
- Laundry & utility:
Neighborhood map
What this means for you Summary
Snapshot
- This is a 3-bed/1.0-bath single-family listed at $120k.
Deal economics
- At list price, monthly cash flow is $337 ($4k/yr) — positive.
- The deal already cash-flows at list — no discount required.
- Meets the 1% rule at list price ($1k rent vs $120k).
Location & tenants
- Location reads 73/100 on livability (#218 in MI) — a middle-class / working-renter tenant base. Strengths: amenities A+, commute A+, cost of living A+; Watch: schools F, crime F, employment F.
- Detroit Public Schools Community District (urban): math 10% / reading 24% proficiency, ranked #499 of 540 in MI (top 92%) — low school quality limits family demand, transient renter base, plan for 1-2y turnover; 90% free/reduced lunch — lower-income household profile, screen leases tightly.
- Market conditions: Rents rising fast (+5.6%/yr); 385 active listings in the ZIP; 40 comparable units currently listed for rent nearby; rentals at typical pace (median 24d on market — plan ~3-4 weeks tenant-placement turnaround); lower-income renter base — watch delinquency; 2,639 units permitted in Wayne County in 2024 (1,216 in 5+ unit buildings).
- This rent runs 45% of the median local income ($37k/yr) — at the standard rent-burdened threshold; future hikes will face affordability resistance.
Forward outlook
- Local home prices are declining (-3.0%/yr); year-one equity from $830 of loan paydown is wiped out by about $4k of value loss. Plan a longer hold.
- Wayne County population projected at -17% by 2050 — secular population decline; favor cash flow + early exit over multi-decade hold.
- At projected returns (-3.0% appreciation + 5.6% rent growth), your $34k cash investment doubles in ~8 years — after that, you're playing with house money.
Negotiation context
- Only 10 days on market — expect competitive offers; lowballing is unlikely to land.
- 3 sale attempts since 19y ago with the ask held roughly flat each time — persistent listings suggest the price (not the market) is what's stuck; bring a comps-based counter.
Risks & watch-outs
- Watch-outs: built in 1943 — expect roof / HVAC / electrical / plumbing capex.
Questions for the listing agent
- Built in 1943 — when were the roof, HVAC, electrical panel, plumbing, and water heater last replaced?
- Is there a deadline driving the sale (1031 exchange, divorce, estate, relocation)? That informs how much negotiation room exists.
- Schools are F-rated, which usually means shorter tenancies and higher turnover. Who's the typical renter profile here, and what's been the actual vacancy rate?
- Crime grade is F in this area — have there been break-ins, vandalism, or insurance claims at this property in the last 3 years? What carrier currently insures it and at what premium?
- What's the average days-on-market for RENTAL listings here right now (not sales)? A rising rental-DOM trend means longer vacancies and softer asking-rent achievability than the comps imply.
- What's the recent tenant-quality profile in this submarket — average credit score on applications, eviction rate, late-payment / NSF rate, and stable-employment percentage? A property-management company in the area should have these aggregated.
- How much new for-sale + rental construction is in the pipeline within 1–3 miles? Heavy new supply typically softens prices + rents 12–24 months out; constrained supply supports both.
Investment metrics
- 1% rule
- 1.13% ✓
- Cap rate
- 9.67%
- Cash-on-cash
- 12.05%
- DSCR
- 1.54
- GRM
- 7.4
CMA / ARV
- ARV (on-the-fly)
- $65,554
- Comps found
- 12
Show comp detail 12 sales within ~0.75 mi
| Address | Dist | Beds/Ba | Sqft | Sold | Price | $/sf | Match |
|---|---|---|---|---|---|---|---|
| 9352 Rutland St | 0.45mi | 3/1.0 | 915 (+2%) | 6mo | $15,000 | $16 | 71 |
| 12124 Asbury Park | 0.47mi | 3/1.5 | 919 (+2%) | 2mo | $130,000 | $141 | 71 |
| 9965 Asbury Park | 0.26mi | 3/1.0 | 824 (-8%) | 5mo | $60,000 | $73 | 70 |
| 12203 Grandmont Ave | 0.45mi | 3/1.5 | 861 (-4%) | 1mo | $95,000 | $110 | 70 |
| 9580 Mansfield St | 0.52mi | 2/1.0 (-1) | 890 (-1%) | 0mo | $23,000 | $26 | 69 |
| 10017 Mansfield St | 0.42mi | 2/1.0 (-1) | 862 (-4%) | 8mo | $45,000 | $52 | 62 |
| 9973 Winthrop St | 0.67mi | 3/1.0 | 960 (+7%) | 5mo | $75,000 | $78 | 53 |
| 12057 Forrer St | 0.62mi | 3/1.0 | 1,000 (+11%) | 1mo | $45,000 | $45 | 51 |
| 11717 Montrose St | 0.64mi | 2/1.5 (-1) | 939 (+5%) | 8mo | $42,000 | $45 | 49 |
| 9555 Montrose St | 0.67mi | 3/1.0 | 999 (+11%) | 3mo | $45,000 | $45 | 48 |
| 12660 Grandmont Ave | 0.71mi | 3/1.0 | 1,019 (+14%) | 1mo | $85,000 | $83 | 43 |
| 11694 Forrer St | 0.60mi | 3/1.0 | 768 (-14%) | 6mo | $58,000 | $76 | 43 |
Match score weights: distance 35% · size 25% · config 20% · recency 20%. Top-matched comps best support the ARV.
Projected returns pro-forma
-3.0% appreciation · 5.59% rent growth · sell at horizon
- IRR
- 4.2%
- Equity multiple
- 1.17×
- Total profit
- $5,636
- Equity at exit
- $17,892
- IRR
- 15.8%
- Equity multiple
- 2.43×
- Total profit
- $48,141
- Equity at exit
- $10,375
Cash invested: $33,600 (down + closing). Projections, not guarantees.
Landlord ↔ Tenant lean methodology
- Overall (STATE)
- 62 Landlord-Friendly
- State Michigan
- 62 Landlord-Friendly · EVEN
- County
- — inherits STATE
- City
- — inherits STATE
ZIP-level market 48227
- Rents YoY
- 5.6%
- Active inventory
- 385
- Price-to-rent
- 7.4×
Monthly cashflow live
- Estimated rent
- $1,359 high interval (Pro) →
- Mortgage (P&I)
- −$629
- Tax from tax record
- −$57 /mo · $680/yr
- Insurance
- −$50
- HOA
- −$0
- Vacancy / Maint / Mgmt
- −$285
- Net cashflow
- $337
Break-even live
UW: 25.0% down · 7.5% · 30yr · 1.5% tax · 5.0% vac · 8.0% maint · 8.0% mgmt
Financing live
Cash to close
- Down payment
- $30,000
- Closing costs
- $3,600
- Reserves months
- —
- Total cash needed
- —
Loan-product check · same deal, 3 products live
Conventional
25% down · 7.5% · 30yr
- Down + closing
- —
- Monthly P&I
- —
- Monthly cashflow
- —
- DSCR
- —
- Eligible?
- —
Personal DTI + credit; lowest rate.
DSCR
20% down · 8.5% · 30yr
- Down + closing
- —
- Monthly P&I
- —
- Monthly cashflow
- —
- DSCR
- —
- Eligible?
- —
No personal income docs; deal must DSCR.
Hard money
10% down · 12.0% · 12mo
- Down + closing
- —
- Monthly P&I
- —
- Monthly cashflow
- —
- DSCR
- —
- Eligible?
- —
Short-term bridge; refi at stabilization.
Rent comps 40 comps
| Address | Beds | Baths | Sqft | Rent | $/sqft | DOM | Units | Dist |
|---|---|---|---|---|---|---|---|---|
| 11741 Penrod St Detroit, MI | 3.0 | 1.0 | 1124 | $1,400 | $1.25 | 16d | 1 | 0.50mi |
| 11704 Greenview Ave Detroit, MI | 4.0 | 1.0 | 1046 | $1,300 | $1.24 | 24d | 1 | 0.58mi |
| 18450 W Chicago Detroit, MI | 1.0–2.0 | 1.0 | 687 | $1,117 | $1.62 | 1d | 15 | 0.62mi |
| 9936 Montrose St Detroit, MI | 3.0 | 1.0 | 963 | $1,200 | $1.25 | 16d | 1 | 0.66mi |
| 9345 Rutherford St Unit 3 Detroit, MI | 2.0 | 1.0 | 850 | $1,050 | $1.24 | 24d | 1 | 0.66mi |
| 9973 Winthrop St Detroit, MI | 3.0 | 1.0 | 960 | $1,400 | $1.46 | 43d | 1 | 0.69mi |
| 9108 Archdale St Detroit, MI | 3.0 | 1.0 | 1000 | $1,300 | $1.30 | 5d | 1 | 0.69mi |
| 12121 Montrose St Detroit, MI | 3.0 | 1.0 | 874 | $1,373 | $1.57 | 21d | 1 | 0.70mi |
| 11345 Greenfield Rd Detroit, MI | 2.0 | 1.0 | 700 | $1,050 | $1.50 | 12d | 1 | 0.73mi |
| 12711 Grandmont Ave Detroit, MI | 3.0 | 1.0 | 1000 | $1,400 | $1.40 | 17d | 1 | 0.73mi |
| 11393 Prest St Detroit, MI | 3.0 | 1.0 | 900 | $1,550 | $1.72 | 16d | 1 | 0.79mi |
| 9222 Forrer St Detroit, MI | 3.0 | 1.0 | 947 | $1,450 | $1.53 | 16d | 1 | 0.82mi |
| 12840 Grandmont Ave Detroit, MI | 3.0 | 1.0 | 1100 | $1,200 | $1.09 | 43d | 1 | 0.83mi |
| 11397 Whitcomb St Detroit, MI | 3.0 | 1.0 | 1070 | $1,400 | $1.31 | 16d | 1 | 0.84mi |
| 8850 Rosemont Ave Detroit, MI | 3.0 | 1.0 | 933 | $1,100 | $1.18 | 17d | 1 | 0.92mi |
| 9917 Sussex St Detroit, MI | 2.0 | 1.0 | 800 | $1,375 | $1.72 | 43d | 1 | 0.92mi |
| 11634 Sussex St Detroit, MI | 3.0 | 1.0 | 1091 | $1,326 | $1.22 | 24d | 1 | 0.93mi |
| 9090 Stahelin Ave Detroit, MI | 2.0 | 1.0 | 787 | $1,250 | $1.59 | 43d | 1 | 0.96mi |
| 12944 Rosemont Ave Detroit, MI | 2.0 | 1.0 | 800 | $1,050 | $1.31 | 5d | 1 | 0.98mi |
| 12875 Faust Ave Detroit, MI | 2.0 | 1.0 | 735 | $1,200 | $1.63 | 5d | 1 | 0.99mi |
| 9546 Sussex St Detroit, MI | 3.0 | 1.0 | 1000 | $1,400 | $1.40 | 43d | 1 | 0.99mi |
| 12941 Penrod St Detroit, MI | 2.0 | 1.0 | 1000 | $1,275 | $1.27 | 43d | 1 | 1.01mi |
| 10015 Robson St Detroit, MI | 3.0 | 2.0 | 1000 | $1,400 | $1.40 | 17d | 1 | 1.01mi |
| 13600 Southfield Fwy Detroit, MI | 2.0 | 1.0 | 848 | $1,100 | $1.30 | 5d | 1 | 1.06mi |
| 9386 Coyle St Detroit, MI | 3.0 | 1.0 | 1000 | $1,300 | $1.30 | 1d | 1 | 1.08mi |
| 12950 Glastonbury Ave Detroit, MI | 3.0 | 1.0 | 1000 | $1,400 | $1.40 | 24d | 1 | 1.10mi |
| 19449 W Chicago St Detroit, MI | 3.0 | 1.5 | 950 | $1,500 | $1.58 | 43d | 1 | 1.12mi |
| 13591 Faust Ave Detroit, MI | 2.0 | 1.0 | 1000 | $1,275 | $1.27 | 43d | 1 | 1.14mi |
| 12039 Lauder St Detroit, MI | 3.0 | 1.5 | 1000 | $1,500 | $1.50 | 24d | 1 | 1.15mi |
| 8451 Rosemont Ave Detroit, MI | 3.0 | 1.0 | 867 | $1,150 | $1.33 | 43d | 1 | 1.16mi |
| 13514 Stahelin Ave Detroit, MI | 3.0 | 1.0 | 1000 | $1,400 | $1.40 | 17d | 1 | 1.16mi |
| 14740 W Chicago Unit B Detroit, MI | 2.0 | 1.0 | 900 | $845 | $0.94 | 43d | 1 | 1.21mi |
| 19050 W Davison St Detroit, MI | 3.0 | 1.0 | 1118 | $1,400 | $1.25 | 43d | 1 | 1.24mi |
| 9590 Marlowe St Detroit, MI | 2.0 | 1.0 | 877 | $1,430 | $1.63 | 43d | 1 | 1.24mi |
| 8262 Rosemont Ave Detroit, MI | 3.0 | 1.0 | 836 | $1,200 | $1.44 | 5d | 1 | 1.26mi |
| 8604 Whitcomb St Detroit, MI | 3.0 | 2.0 | 1033 | $1,300 | $1.26 | 43d | 1 | 1.30mi |
| 19301 Joy Rd Apt 1 Detroit, MI | 2.0 | 1.0 | 750 | $1,100 | $1.47 | 43d | 1 | 1.32mi |
| 12084 Vaughan St Detroit, MI | 3.0 | 1.0 | 1000 | $1,200 | $1.20 | 16d | 1 | 1.33mi |
| 12754 Marlowe St Detroit, MI | 3.0 | 2.0 | 1008 | $1,400 | $1.39 | 16d | 1 | 1.41mi |
| 11652 Fielding St Detroit, MI | 3.0 | 1.0 | 1000 | $1,386 | $1.39 | 43d | 1 | 1.49mi |
Listing history 4 events
-
2026-05-17$120,000 Active
Show marketing remark (421 chars)
* * * Welcome to your new HOME * * * Come take a look at this newly updated home. Painted with new flooring throughout. Kitchen and bathroom updates that are waiting for your decorating touch. Come drive-up in your newly cemented driveway and a huge backyard ready for your relaxation and celebration. Located near major freeways and schools, local businesses for your convenience come tour and make an offer today!
-
2026-05-17$120,000 Active 421-char remark
Show marketing remark (421 chars)
* * * Welcome to your new HOME * * * Come take a look at this newly updated home. Painted with new flooring throughout. Kitchen and bathroom updates that are waiting for your decorating touch. Come drive-up in your newly cemented driveway and a huge backyard ready for your relaxation and celebration. Located near major freeways and schools, local businesses for your convenience come tour and make an offer today!
-
2008-03-07historical
-
2007-12-07$90,000
ⓘ Source: listings_history table (triggers on properties + properties_extension) + one-shot
backfill from property_details.listing_events for pre-trigger history.
Tax reassessment forecast MI · Partial reset (capped growth)
- Current annual tax
- $680 · $57/mo
- Projected year-2 tax
- $1,264 · $105/mo
- Expected delta
- +$584/yr (+$49/mo · 85.8%)
ⓘ Screening estimate from a state-policy table — verify with the county assessor before closing.
Climate risk First Street
- Flood 1/10 Low FEMA zone X (unshaded) · 0% chance over 30 yrs
- Wildfire 1/10 Low
- Heat 3/10 Moderate 7 d/yr ≥98°F today · 15 d/yr by 30 yrs out
- Wind 2/10 Low
- Air quality 3/10 Moderate 2 unhealthy d/yr today · 5 by 30 yrs out
Nearby sold comps map
Loading sold comps map…
Walkable amenities ~0.75 mi
Loading nearby amenities…
Taxation est. · year 1
- Rental income
- $16,304
- − Mortgage interest
- −$6,722
- − Property taxes
- −$680
- − Insurance
- −$600
- − Repairs & maintenance
- −$1,304
- − Management
- −$1,304
- − Depreciation
- −$3,491
- Taxable income
- $2,202
- Est. tax owed @ 24.0%
- −$528
- After-tax cash flow
- $3,520/yr
For passive investors: Depreciation is non-cash, so a rental often shows a tax loss while cash-flowing — sheltering income. Rental losses are passive: they offset passive income freely, and up to $25,000/yr can offset ordinary (W-2) income if you actively participate and your MAGI is under $100k (phasing out to $0 by $150k); unused losses carry forward. On sale, claimed depreciation is recaptured at up to 25%, and gains may owe capital-gains tax (a 1031 exchange can defer both). Figures are a year-1 estimate at your 24.0% rate — not tax advice; consult a CPA.
Schools (NCES district)
- District
- Detroit Public Schools Community District
- NCES district ID
- 2601103
- Math proficiency
- 10% ▼ -2.00%
- Reading proficiency
- 24% ▲ 6.00%
- Median HH income
- $25,815
- Composite
- 13.06/100
- National rank
- #9564
- State rank
- #499 of 540 in MI
Livability — Detroit
- Score
- 73/100
- State rank
- #218
- US rank
- #5427
Category grades
Schools grade is shown separately in the Schools card above.
Census & demographics
- Census place
- Detroit, MI
- County
- Wayne County · 1,562,939 people
- City population
- 572,865
- Metro
- Detroit-Warren-Dearborn, MI
- Population (ZIP)
- 40,302
- Household income
- $36,527
- Rent vs Own
- Severe rent burden
- 2371.0
Population outlook (Wayne County) Hauer SSP2
- Today (2025)
- 1,675,273 people
- By 2030
- 1,620,300 · -3.3%
- By 2040
- 1,502,341 · -10.3%
- By 2050
- 1,384,039 · -17.4%
- By 2075
- 1,124,592 · -32.9%
- By 2100
- 881,193 · -47.4%
Race, ethnicity, and origin ACS 2023
- Neighborhood character
- Predominantly Black (95%)
- Race & ethnicity
- Black 95% Two or more races 3% White 1%
- Foreign-born
- 1%
- Languages at home
- 98% English-only · Spanish 1% French/Haitian/Cajun 1%
Political lean MEDSL · Wayne
- 2024 margin
- Strong D (+29.0) · D 62.7% · R 33.7% · Other 3.6%
- 2008→2024 swing
- -20.5pp toward R · 2008: 49.5pp · 2024: 29.0pp
- All cycles
- 2024: D+29.0 2020: D+38.1 2016: D+37.3 2012: D+46.9 2008: D+49.5
Not yet ingested
- Civics
- —
Market trends
- HPI YoY
- ▼ -125.00%
- Current HPI
- 186.4158
- Rent YoY
- ▲ 5.59%
- Metro
- Detroit-Warren-Dearborn, MI
- State GDP YoY
- ▲ 1.37%
- F500 in state
- 28
Industry mix (Fortune 500 HQ in MI)
| Industry | F500 HQs | Revenue |
|---|---|---|
| Automotive Parts | 3 | $48B |
|
||
| Automotive | 2 | $372B |
|
||
| Chemicals | 1 | $45B |
|
||
| Automotive Retail | 1 | $29B |
|
||
| Healthcare / Medical Devices | 1 | $23B |
|
||
| Automotive Technology | 1 | $20B |
|
||
Price history
+33.3% since first listed4 events — show timeline
- 2026-05-17 Listed $120,000 REALCOMP
- 2026-05-17 Listed $120,000 MiRealSource-MiMLS
- 2008-03-07 Listing Removed — REALCOMP
- 2007-12-07 Listed $90,000 REALCOMP
Property tax history
-3.0%/yrLatest (2025): $680 · -35.8% YoY. Source: county tax records.
Cash-flow waterfall
monthlySold comps — $/sqft
last 12 mo · ≤1 miLoading sold comps…