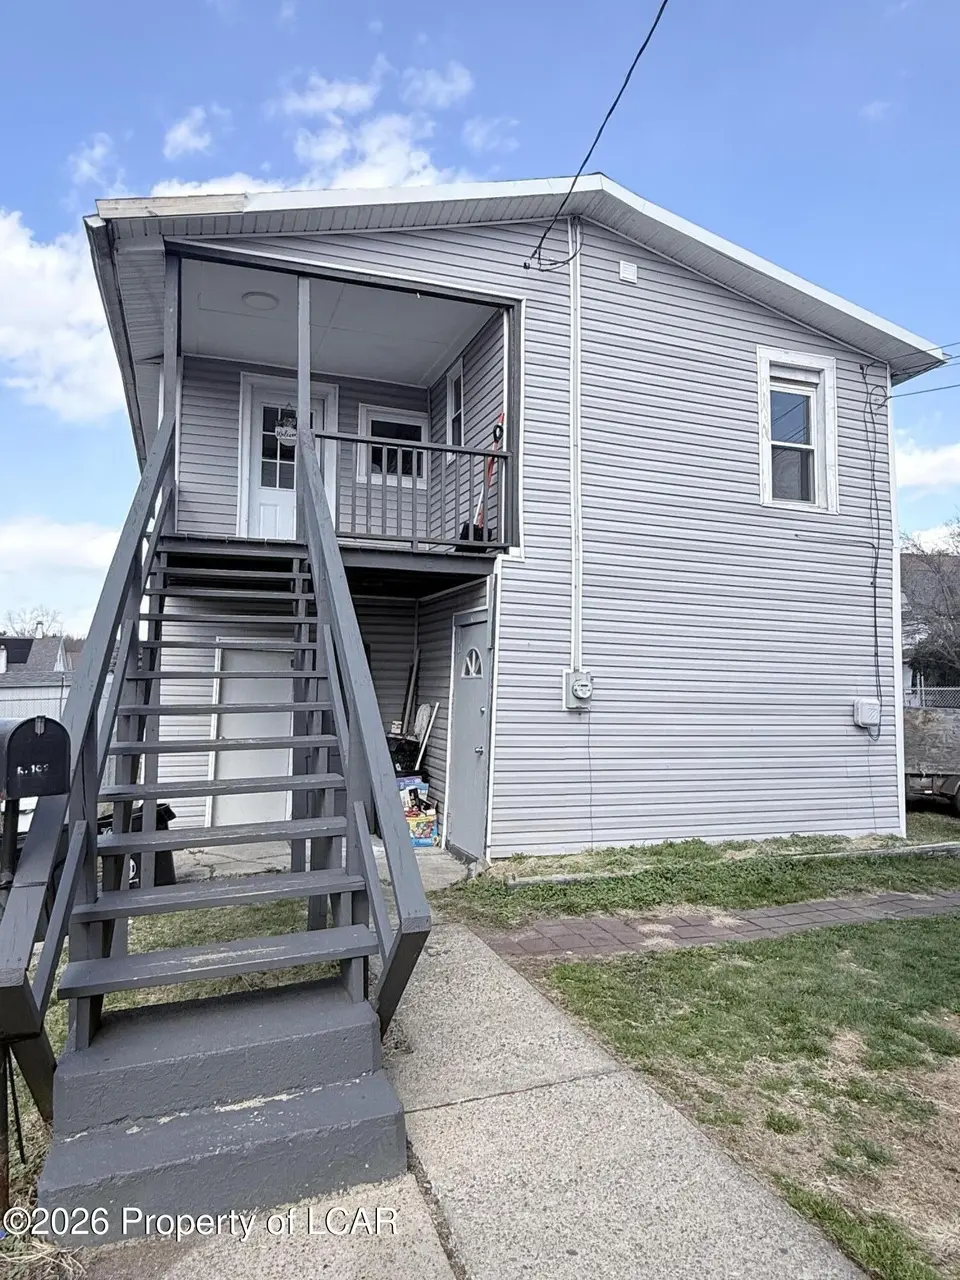
102 E Main Rear St · Wilkes-Barre, PA
Flood risk 1/10 · Minimal
- FEMA flood zone
- X (unshaded)
- Chance of flooding over 30 yrs
- 0.0%
- Est. flood insurance / yr
- $507 – $1,088
Fire risk 1/10 · Minimal
- Est. fire insurance / yr
- $511 – $949
Heat risk 4/10 · Minor
- Hot days now (above 93°F)
- 7 days/yr
- Hot days in 30 yrs
- 17 days/yr
Wind risk 3/10 · Minor
- Chance of severe wind over 30 yrs
- 4.0%
Air-quality risk 2/10 · Minimal
- Unhealthy air days now
- 1 days/yr
- Unhealthy air days in 30 yrs
- 2 days/yr
Risk factors via First Street. Map © Google.
Why this score? — see what drove the B grade
The composite is a weighted blend of 9 inputs, each scored 0–100. Each bar is that input's sub-score; the figure is the points it added to the 100-point composite (weight × sub-score).
- Cash flow +30.0/30.0
- ARV discount +15.0/15.0
- 1% rule +10.0/10.0
- DSCR +10.0/10.0
- Rent growth +2.5/5.0
- Livability +2.5/5.0
- Condition / age +2.5/5.0
- Schools +2.1/10.0
- Appreciation +0.0/10.0
$89,999
🖨 Deal sheet 📄 Offer letter ✓ Due diligence
Listing remarks MLS
Turnkey investment opportunity! This 3-bedroom, 1-bath single-family home, Features include an open first-floor layout, efficient use of space, and low-maintenance living. Located in a desirable area with steady rental demand. Ideal for investors seeking reliable income and minimal upkeep.
Key facts
- Listed 95 days
Tags
Neighborhood map
What this means for you Summary
Snapshot
- This is a 3-bed/1.0-bath single-family listed at $90k.
Deal economics
- At list price, monthly cash flow is $495 ($6k/yr) — positive.
- The deal already cash-flows at list — no discount required.
- Meets the 1% rule at list price ($1k rent vs $90k).
- Recommended offer: $82k (9.0% below list) — sets the bar for market timing.
- Cap rate 12.9% vs local median 5.7% in Wilkes-Barre — top-decile yield for the area; either an underpriced asset or a hidden risk that comps aren't pricing in. Stress-test before assuming the spread holds.
Location & tenants
- Location reads: area grade B — affects rentability + tenant quality, not the cash-flow math above.
- Wilkes-Barre Area SD (urban): math 19% / reading 32% proficiency, ranked #469 of 539 in PA (top 87%) — low school quality limits family demand, transient renter base, plan for 1-2y turnover; 61% free/reduced lunch — lower-income household profile, screen leases tightly.
- Market conditions: 74 active listings in the ZIP; 10 comparable units currently listed for rent nearby; rentals lingering (median 44d on market — plan ~5-8 weeks vacancy on turnover, expect pricing pressure); 60% of comp listings sitting > 30 days — soft ceiling on asking rent; 349 units permitted in Luzerne County in 2024 (16 in 5+ unit buildings).
Forward outlook
- Local home prices are declining (-3.0%/yr); year-one equity from $622 of loan paydown is wiped out by about $3k of value loss. Plan a longer hold.
- Luzerne County population projected at +4% by 2050 — modest demand growth; plan on rents tracking national, not racing it.
- At projected returns (-3.0% appreciation + 3.0% rent growth), your $25k cash investment doubles in ~6 years — after that, you're playing with house money.
Negotiation context
- It's been on market 95 days — a 9% lower offer ($82k) is reasonable based on typical stale-listing flexibility.
- 2 sale attempts; this cycle's ask has dropped $10k (10%) from the opening price — seller is motivated, your offer sets the floor, not the list.
Risks & watch-outs
- Watch-outs: built in 1900 — expect roof / HVAC / electrical / plumbing capex.
Questions for the listing agent
- It's been on market 95 days. Have you received any prior offers? Is the seller open to a 9% concession, seller financing, or rate buy-down credit?
- Built in 1900 — when were the roof, HVAC, electrical panel, plumbing, and water heater last replaced?
- Why hasn't it sold? Are there any deal-killer items the seller is aware of (foundation, flood, title, zoning, code violations)?
- Is there a deadline driving the sale (1031 exchange, divorce, estate, relocation)? That informs how much negotiation room exists.
- What's the average days-on-market for RENTAL listings here right now (not sales)? A rising rental-DOM trend means longer vacancies and softer asking-rent achievability than the comps imply.
- What's the recent tenant-quality profile in this submarket — average credit score on applications, eviction rate, late-payment / NSF rate, and stable-employment percentage? A property-management company in the area should have these aggregated.
- How much new for-sale + rental construction is in the pipeline within 1–3 miles? Heavy new supply typically softens prices + rents 12–24 months out; constrained supply supports both.
Investment metrics
- 1% rule
- 1.57% ✓
- Cap rate
- 12.89%
- Cash-on-cash
- 23.56%
- DSCR
- 2.05
- GRM
- 5.3
CMA / ARV
- ARV (median comp)
- $141,948
- List price
- $89,999
- Delta
- -36.60%
- Verdict
- UNDERPRICED
- Comps
- 20 within 1.0 mi
Show comp detail 12 sales within ~0.75 mi
| Address | Dist | Beds/Ba | Sqft | Sold | Price | $/sf | Match |
|---|---|---|---|---|---|---|---|
| 120 Cleveland St | 0.12mi | 3/1.0 | 1,410 (+2%) | 15mo | $95,000 | $67 | 78 |
| 21 Kelly Ave | 0.23mi | 3/1.5 | 1,494 (+8%) | 11mo | $190,000 | $127 | 64 |
| 19 Cottage Ave | 0.37mi | 3/1.5 | 1,280 (-7%) | 5mo | $190,000 | $148 | 64 |
| 10 Stanton St | 0.70mi | 3/1.5 | 1,376 (-0%) | 1mo | $210,000 | $153 | 64 |
| 26 Delaware St | 0.53mi | 3/1.5 | 1,456 (+6%) | 0mo | $250,000 | $172 | 64 |
| 221 E Thomas St | 0.31mi | 3/2.0 | 1,536 (+11%) | 4mo | $182,500 | $119 | 60 |
| 103 Henry St | 0.43mi | 3/1.0 | 1,506 (+9%) | 9mo | $228,000 | $151 | 58 |
| 48 Skidmore St | 0.60mi | 4/1.5 (+1) | 1,481 (+7%) | 2mo | $212,000 | $143 | 51 |
| 330 E Thomas St | 0.50mi | 3/1.5 | 1,175 (-15%) | 4mo | $245,000 | $209 | 47 |
| 202 Austin Ave | 0.70mi | 2/1.5 (-1) | 1,450 (+5%) | 9mo | $185,000 | $128 | 45 |
| 109 Cook St | 0.69mi | 3/1.0 | 1,240 (-10%) | 8mo | $140,000 | $113 | 44 |
| 185 Main St | 0.73mi | 2/2.0 (-1) | 1,499 (+9%) | 3mo | $260,000 | $173 | 40 |
Match score weights: distance 35% · size 25% · config 20% · recency 20%. Top-matched comps best support the ARV.
Projected returns pro-forma
-3.0% appreciation · 3.0% rent growth · sell at horizon
- IRR
- 16.7%
- Equity multiple
- 1.67×
- Total profit
- $16,945
- Equity at exit
- $13,419
- IRR
- 25.2%
- Equity multiple
- 3.20×
- Total profit
- $55,414
- Equity at exit
- $7,781
Cash invested: $25,200 (down + closing). Projections, not guarantees.
Landlord ↔ Tenant lean methodology
- Overall (STATE)
- 62 Landlord-Friendly
- State Pennsylvania
- 62 Landlord-Friendly · EVEN
- County
- — inherits STATE
- City
- — inherits STATE
ZIP-level market 18705
- Home prices YoY
- -22.7%
- Active inventory
- 74
- Price-to-rent
- 5.3×
Monthly cashflow live
- Estimated rent
- $1,414 high interval (Pro) →
- Mortgage (P&I)
- −$472
- Tax est. 1.5%
- −$112 /mo · $1,350/yr
- Insurance
- −$37
- HOA
- −$0
- Vacancy / Maint / Mgmt
- −$297
- Net cashflow
- $495
Break-even live
UW: 25.0% down · 7.5% · 30yr · 1.5% tax · 5.0% vac · 8.0% maint · 8.0% mgmt
Financing live
Cash to close
- Down payment
- $22,500
- Closing costs
- $2,700
- Reserves months
- —
- Total cash needed
- —
Loan-product check · same deal, 3 products live
Conventional
25% down · 7.5% · 30yr
- Down + closing
- —
- Monthly P&I
- —
- Monthly cashflow
- —
- DSCR
- —
- Eligible?
- —
Personal DTI + credit; lowest rate.
DSCR
20% down · 8.5% · 30yr
- Down + closing
- —
- Monthly P&I
- —
- Monthly cashflow
- —
- DSCR
- —
- Eligible?
- —
No personal income docs; deal must DSCR.
Hard money
10% down · 12.0% · 12mo
- Down + closing
- —
- Monthly P&I
- —
- Monthly cashflow
- —
- DSCR
- —
- Eligible?
- —
Short-term bridge; refi at stabilization.
Rent comps 10 comps
| Address | Beds | Baths | Sqft | Rent | $/sqft | DOM | Units | Dist |
|---|---|---|---|---|---|---|---|---|
| 214 Mayock St Unit 3 Wilkes-Barre, PA | 2.0 | 1.0 | 1000 | $1,150 | $1.15 | 43d | 1 | 0.13mi |
| 210 E Thomas St Wilkes-Barre, PA | 4.0 | 2.0 | 1300 | $1,650 | $1.27 | 43d | 1 | 0.27mi |
| 19 Center St Plains, PA | 2.0 | 1.5 | 1100 | $1,295 | $1.18 | 43d | 1 | 0.43mi |
| 42 Cleveland St Wilkes Barre, PA | 4.0 | 1.5 | 1700 | $1,600 | $0.94 | 43d | 1 | 0.47mi |
| 26 E Carey St Apt 4 Wilkes-Barre, PA | 3.0 | 1.0 | 1050 | $1,300 | $1.24 | 13d | 1 | 0.57mi |
| 17 E Carey St Unit 3 Wilkes-Barre, PA | 2.0 | 1.0 | 1000 | $1,200 | $1.20 | 43d | 1 | 0.59mi |
| 13 Charles St Unit 15 Wilkes-Barre, PA | 3.0 | 1.0 | 1300 | $1,550 | $1.19 | 13d | 1 | 0.67mi |
| 123 W Carey St Wilkes Barre, PA | 3.0 | 2.0 | 1375 | $1,650 | $1.20 | 13d | 1 | 0.97mi |
| 13 E Chestnut St Unit 1 Wilkes-Barre, PA | 3.0 | 1.0 | 900 | $1,195 | $1.33 | 43d | 1 | 1.28mi |
| 746 N Washington St Unit 1 Wilkes-Barre, PA | 3.0 | 2.0 | 1573 | $1,500 | $0.95 | 21d | 1 | 1.30mi |
Listing history 6 events
-
2026-05-31status $89,999 Pending 95 DOM
-
2026-05-30days on market $89,999 Active 95 DOM
-
2026-04-15status Active 290-char remark
Show marketing remark (290 chars)
Turnkey investment opportunity! This 3-bedroom, 1-bath single-family home, Features include an open first-floor layout, efficient use of space, and low-maintenance living. Located in a desirable area with steady rental demand. Ideal for investors seeking reliable income and minimal upkeep.
-
2026-04-04status Pending 290-char remark
Show marketing remark (290 chars)
Turnkey investment opportunity! This 3-bedroom, 1-bath single-family home, Features include an open first-floor layout, efficient use of space, and low-maintenance living. Located in a desirable area with steady rental demand. Ideal for investors seeking reliable income and minimal upkeep.
-
2026-02-13$99,999 Active 290-char remark
Show marketing remark (290 chars)
Turnkey investment opportunity! This 3-bedroom, 1-bath single-family home, Features include an open first-floor layout, efficient use of space, and low-maintenance living. Located in a desirable area with steady rental demand. Ideal for investors seeking reliable income and minimal upkeep.
-
2025-03-10price $114,999
ⓘ Source: listings_history table (triggers on properties + properties_extension) + one-shot
backfill from property_details.listing_events for pre-trigger history.
Climate risk First Street
- Flood 1/10 Low FEMA zone X (unshaded) · 0% chance over 30 yrs
- Wildfire 1/10 Low
- Heat 4/10 Moderate 7 d/yr ≥93°F today · 17 d/yr by 30 yrs out
- Wind 3/10 Moderate 4% chance of damaging wind over 30 yrs
- Air quality 2/10 Low 1 unhealthy d/yr today · 2 by 30 yrs out
Nearby sold comps map
Loading sold comps map…
Walkable amenities ~0.75 mi
Loading nearby amenities…
Taxation est. · year 1
- Rental income
- $16,962
- − Mortgage interest
- −$5,041
- − Property taxes
- −$1,350
- − Insurance
- −$450
- − Repairs & maintenance
- −$1,357
- − Management
- −$1,357
- − Depreciation
- −$2,618
- Taxable income
- $4,789
- Est. tax owed @ 24.0%
- −$1,149
- After-tax cash flow
- $4,787/yr
For passive investors: Depreciation is non-cash, so a rental often shows a tax loss while cash-flowing — sheltering income. Rental losses are passive: they offset passive income freely, and up to $25,000/yr can offset ordinary (W-2) income if you actively participate and your MAGI is under $100k (phasing out to $0 by $150k); unused losses carry forward. On sale, claimed depreciation is recaptured at up to 25%, and gains may owe capital-gains tax (a 1031 exchange can defer both). Figures are a year-1 estimate at your 24.0% rate — not tax advice; consult a CPA.
Schools (NCES district)
- District
- Wilkes-Barre Area SD
- NCES district ID
- 4226300
- Math proficiency
- 19% ▼ -2.00%
- Reading proficiency
- 32% ▼ -9.00%
- Median HH income
- $37,420
- Composite
- 21.22/100
- National rank
- #8409
- State rank
- #469 of 539 in PA
Livability — Wilkes-Barre
No livability data for this city. (Only ~50 U.S. cities are tracked.)
Census & demographics
- Census place
- Wilkes-Barre, PA
- County
- Luzerne County · 118,885 people
- City population
- 73,981
- Metro
- Scranton--Wilkes-Barre, PA
- Population (ZIP)
- 15,624
- Household income
- $59,344
- Rent vs Own
- Severe rent burden
- 549.0
Population outlook (Luzerne County) Hauer SSP2
- Today (2025)
- 319,505 people
- By 2030
- 319,943 · +0.1%
- By 2040
- 322,643 · +1.0%
- By 2050
- 330,817 · +3.5%
- By 2075
- 379,145 · +18.7%
- By 2100
- 431,908 · +35.2%
Race, ethnicity, and origin ACS 2023
- Neighborhood character
- Predominantly White (68%)
- Race & ethnicity
- White 68% Hispanic / Latino 22% Two or more races 11% Black 4%
- Hispanic origin (detail)
- Mexican 7% Puerto Rican 5% Dominican 9%
- Common ancestry
- Romanian 19% Scotch-Irish 3% Polish 2%
- Foreign-born
- 11% · Canada
- Languages at home
- 79% English-only · Spanish 17% Other Indo-European 2% Russian/Polish/Slavic 1%
Political lean MEDSL · Luzerne
- 2024 margin
- R (+19.2) · D 40.0% · R 59.2%
- 2008→2024 swing
- -27.6pp toward R · 2008: 8.4pp · 2024: -19.2pp
- All cycles
- 2024: R+19.2 2020: R+14.4 2016: R+19.6 2012: D+4.8 2008: D+8.4
Not yet ingested
- Civics
- —
Market trends
- HPI YoY
- ▼ -71.77%
- Current HPI
- 243.9176
- Rent YoY
- —
- Metro
- Scranton--Wilkes-Barre, PA
- State GDP YoY
- ▲ 1.68%
- F500 in state
- 34
Industry mix (Fortune 500 HQ in PA)
| Industry | F500 HQs | Revenue |
|---|---|---|
| Healthcare | 2 | $309B |
|
||
| Insurance | 2 | $27B |
|
||
| Telecommunications / Media | 1 | $124B |
|
||
| Industrial Distribution | 1 | $22B |
|
||
| Financial Services | 1 | $20B |
|
||
| Chemicals / Materials | 1 | $18B |
|
||
Price history
-13.0% since first listed4 events — show timeline
- 2026-04-15 Relisted — LCAR
- 2026-04-04 Pending — LCAR
- 2026-02-13 Listed $99,999 LCAR
- 2025-03-10 Price Changed $114,999 LCAR
Property tax history
+20.4%/yrLatest (2026): $9,425 · +0.1% YoY. Source: county tax records.
Cash-flow waterfall
monthlySold comps — $/sqft
last 12 mo · ≤1 miLoading sold comps…