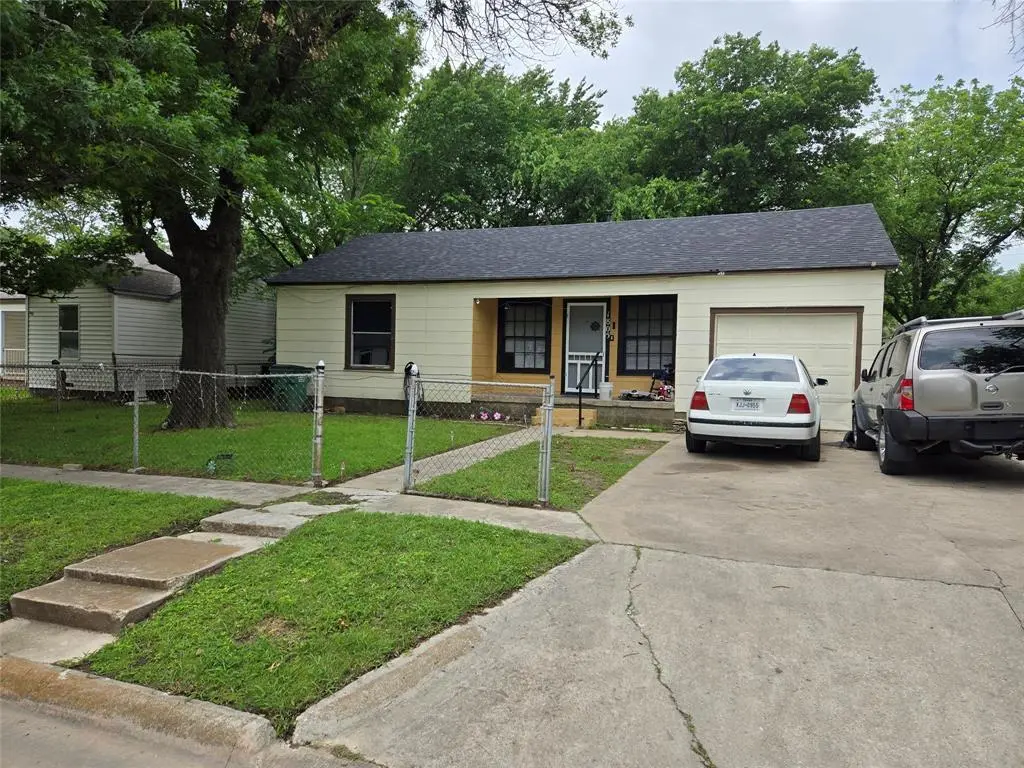
1805 Mill St · Gainesville, TX
Flood risk 1/10 · Minimal
- FEMA flood zone
- X (unshaded)
- Chance of flooding over 30 yrs
- 0.0%
- Est. flood insurance / yr
- $507 – $1,088
Fire risk 7/10 · Major
- Est. fire insurance / yr
- $1,222 – $2,270
Heat risk 7/10 · Major
- Hot days now (above 110°F)
- 7 days/yr
- Hot days in 30 yrs
- 22 days/yr
Wind risk 4/10 · Minor
- Chance of severe wind over 30 yrs
- 16.0%
Air-quality risk 3/10 · Minor
- Unhealthy air days now
- 3 days/yr
- Unhealthy air days in 30 yrs
- 3 days/yr
Risk factors via First Street. Map © Google.
Why this score? — see what drove the B- grade
The composite is a weighted blend of 9 inputs, each scored 0–100. Each bar is that input's sub-score; the figure is the points it added to the 100-point composite (weight × sub-score).
- Cash flow +25.7/30.0
- ARV discount +15.0/15.0
- DSCR +8.5/10.0
- 1% rule +7.3/10.0
- Livability +3.3/5.0
- Schools +2.6/10.0
- Rent growth +2.5/5.0
- Condition / age +2.5/5.0
- Appreciation +0.0/10.0
$99,750
🖨 Deal sheet 📄 Offer letter ✓ Due diligence
Listing remarks MLS
Buyer or Buyer's agent to verify all information
Key facts
- 8,407 sq ft lot
- Garage
- Built 1949
Property features AI
Finance
- Other: Possession at closing/funding; Listing status: Active
- Financial info: Listing terms: Cash or Conventional
- HOA & community: No homeowners association
Exterior
- Parking: Attached 1-car garage; Covered parking for 1 vehicle; Driveway
- Utilities: City water; City sewer; No municipal utility district
- Home design: Single family residence; Residential property; Built in 1949; One story; Not attached to another property
- Construction: Siding construction; Year built 1949
- Exterior features: Siding exterior; Lot under 0.5 acre; Subdivision: Berend; Directions: Use your favorite GPS
Interior
- Kitchen: Electric range
- Bedrooms: 2 bedrooms (both on the main level)
- Bathrooms: 1 full bathroom
- Heating & cooling: Electric heating; Ceiling fans; Window air unit(s)
- Interior features: Natural woodwork; One living area; One dining area; 5 total rooms; One-level layout
- Laundry & utility: No specific laundry details provided
Neighborhood map
What this means for you Summary
Snapshot
- This is a 2-bed/2.0-bath single-family listed at $100k.
Deal economics
- At list price, monthly cash flow is $238 ($3k/yr) — positive.
- The deal already cash-flows at list — no discount required.
- Meets the 1% rule at list price ($1k rent vs $100k).
- Recommended offer: $97k (3.0% below list) — sets the bar for market timing.
- Cap rate 9.2% vs local median 3.7% in Gainesville — top-decile yield for the area; either an underpriced asset or a hidden risk that comps aren't pricing in. Stress-test before assuming the spread holds.
Location & tenants
- Location reads 66/100 on livability (#602 in TX) — a middle-class / working-renter tenant base. Strengths: cost of living A+, housing A+, crime B+; Watch: amenities F, commute F, employment F.
- Gainesville ISD (rural): math 33% / reading 29% proficiency, ranked #606 of 826 in TX (top 73%) — families likely to look elsewhere, expect single-tenant / working-renter base with shorter leases; 72% free/reduced lunch — lower-income household profile, screen leases tightly.
- Zoned schools: W E Chalmers El (math 28% / reading 24%, grade F, #2,954 of 4,322 statewide, top 69%, 716 students, 67% FRL) — zoned schools at 67% FRL track the district average.
- Market conditions: 462 active listings in the ZIP; 190 units permitted in Cooke County in 2024 (0 in 5+ unit buildings).
Forward outlook
- Local home prices are declining (-3.0%/yr); year-one equity from $690 of loan paydown is wiped out by about $3k of value loss. Plan a longer hold.
Negotiation context
- It's been on market 52 days — a 3% lower offer ($97k) is reasonable based on typical stale-listing flexibility.
- 3 sale attempts since 5y ago; this cycle's ask has dropped $10k (9%) from the opening price — seller is motivated, your offer sets the floor, not the list.
Risks & watch-outs
- Watch-outs: built in 1949 — expect roof / HVAC / electrical / plumbing capex.
- Climate carrying-cost: major wildfire risk; extreme-heat days projected 7→22/yr by 2055 (HVAC capex compounding) — expect insurance premiums to compound above CPI over the hold.
Questions for the listing agent
- It's been on market 52 days. Have you received any prior offers? Is the seller open to a 3% concession, seller financing, or rate buy-down credit?
- Built in 1949 — when were the roof, HVAC, electrical panel, plumbing, and water heater last replaced?
- Is there a deadline driving the sale (1031 exchange, divorce, estate, relocation)? That informs how much negotiation room exists.
- Schools are F-rated, which usually means shorter tenancies and higher turnover. Who's the typical renter profile here, and what's been the actual vacancy rate?
- What's the average days-on-market for RENTAL listings here right now (not sales)? A rising rental-DOM trend means longer vacancies and softer asking-rent achievability than the comps imply.
- What's the recent tenant-quality profile in this submarket — average credit score on applications, eviction rate, late-payment / NSF rate, and stable-employment percentage? A property-management company in the area should have these aggregated.
- How much new for-sale + rental construction is in the pipeline within 1–3 miles? Heavy new supply typically softens prices + rents 12–24 months out; constrained supply supports both.
Investment metrics
- 1% rule
- 1.23% ✓
- Cap rate
- 9.15%
- Cash-on-cash
- 10.22%
- DSCR
- 1.45
- GRM
- 6.8
CMA / ARV
- ARV (median comp)
- $121,526
- List price
- $99,750
- Delta
- -17.92%
- Verdict
- UNDERPRICED
- Comps
- 19 within 1.0 mi
Show comp detail 4 sales within ~0.75 mi
| Address | Dist | Beds/Ba | Sqft | Sold | Price | $/sf | Match |
|---|---|---|---|---|---|---|---|
| 1707 N Weaver St | 0.19mi | 2/1.0 | 672 (-10%) | 10mo | $100,000 | $149 | 63 |
| 1804 Throckmorton St | 0.15mi | 2/1.0 | 816 (+9%) | 20mo | $185,000 | $227 | 57 |
| 714 Harvey St | 0.54mi | 2/1.0 | 784 (+5%) | 17mo | $99,900 | $127 | 49 |
| 1108 Hancock St | 0.51mi | 2/1.0 | 816 (+9%) | 18mo | $134,995 | $165 | 42 |
Match score weights: distance 35% · size 25% · config 20% · recency 20%. Top-matched comps best support the ARV.
Projected returns pro-forma
-3.0% appreciation · 3.0% rent growth · sell at horizon
- IRR
- -0.9%
- Equity multiple
- 0.97×
- Total profit
- $-975
- Equity at exit
- $14,873
- IRR
- 8.8%
- Equity multiple
- 1.67×
- Total profit
- $18,826
- Equity at exit
- $8,625
Cash invested: $27,930 (down + closing). Projections, not guarantees.
Landlord ↔ Tenant lean methodology
- Overall (STATE)
- 87 Strongly Landlord-Friendly
- State Texas
- 87 Strongly Landlord-Friendly · R+5
- County
- — inherits STATE
- City
- — inherits STATE
ZIP-level market 76240
- Active inventory
- 462
- Price-to-rent
- 6.8×
Monthly cashflow live
- Estimated rent
- $1,222 medium interval (Pro) →
- Mortgage (P&I)
- −$523
- Tax from tax record
- −$163 /mo · $1,956/yr
- Insurance
- −$42
- HOA
- −$0
- Vacancy / Maint / Mgmt
- −$257
- Net cashflow
- $238
Break-even live
UW: 25.0% down · 7.5% · 30yr · 1.5% tax · 5.0% vac · 8.0% maint · 8.0% mgmt
Financing live
Cash to close
- Down payment
- $24,938
- Closing costs
- $2,992
- Reserves months
- —
- Total cash needed
- —
Loan-product check · same deal, 3 products live
Conventional
25% down · 7.5% · 30yr
- Down + closing
- —
- Monthly P&I
- —
- Monthly cashflow
- —
- DSCR
- —
- Eligible?
- —
Personal DTI + credit; lowest rate.
DSCR
20% down · 8.5% · 30yr
- Down + closing
- —
- Monthly P&I
- —
- Monthly cashflow
- —
- DSCR
- —
- Eligible?
- —
No personal income docs; deal must DSCR.
Hard money
10% down · 12.0% · 12mo
- Down + closing
- —
- Monthly P&I
- —
- Monthly cashflow
- —
- DSCR
- —
- Eligible?
- —
Short-term bridge; refi at stabilization.
Listing history 26 events
-
2026-06-19days on market $99,750 Active 52 DOM
-
2026-06-18days on market $99,750 Active 51 DOM
-
2026-06-17days on market $99,750 Active 50 DOM
-
2026-06-16days on market $99,750 Active 49 DOM
-
2026-06-15days on market $99,750 Active 48 DOM
-
2026-06-14days on market $99,750 Active 46 DOM
-
2026-06-13remarks 107-char remark
-
2026-06-13price $99,750 Active 45 DOM
-
2026-06-12days on market $99,900 Active 45 DOM
-
2026-06-09days on market $99,900 Active 42 DOM
-
2026-06-08days on market $99,900 Active 41 DOM
-
2026-06-07days on market $99,900 Active 40 DOM
-
2026-06-05days on market $99,900 Active 37 DOM
-
2026-06-03days on market $99,900 Active 36 DOM
-
2026-06-02days on market $99,900 Active 35 DOM
-
2026-06-01days on market $99,900 Active 34 DOM
-
2026-05-31days on market $99,900 Active 33 DOM
-
2026-05-30days on market $99,900 Active 32 DOM
-
2026-05-16price $99,900 83-char remark
-
2026-04-28$110,000 Active 83-char remark
-
2025-11-15historical $1,100
-
2025-10-26$1,100
-
2021-10-01soldstatus
-
2021-09-29soldstatus Sold 48-char remark
Show marketing remark (48 chars)
Buyer or Buyer's agent to verify all information
-
2021-08-09historical Active Contingent 48-char remark
Show marketing remark (48 chars)
Buyer or Buyer's agent to verify all information
-
2021-07-11$82,000 Active 48-char remark
Show marketing remark (48 chars)
Buyer or Buyer's agent to verify all information
ⓘ Source: listings_history table (triggers on properties + properties_extension) + one-shot
backfill from property_details.listing_events for pre-trigger history.
Tax reassessment forecast TX · Resets to sale price
- Current annual tax
- $1,956 · $163/mo
- Projected year-2 tax
- $1,956 · $163/mo
- Expected delta
- $0/yr ($0/mo · 0.0%)
ⓘ Screening estimate from a state-policy table — verify with the county assessor before closing.
Climate risk First Street
- Flood 1/10 Low FEMA zone X (unshaded) · 0% chance over 30 yrs
- Wildfire 7/10 Severe
- Heat 7/10 Severe 7 d/yr ≥110°F today · 22 d/yr by 30 yrs out
- Wind 4/10 Moderate 16% chance of damaging wind over 30 yrs
- Air quality 3/10 Moderate 3 unhealthy d/yr today · 3 by 30 yrs out
Nearby sold comps map
Loading sold comps map…
Walkable amenities ~0.75 mi
Loading nearby amenities…
Taxation est. · year 1
- Rental income
- $14,665
- − Mortgage interest
- −$5,588
- − Property taxes
- −$1,956
- − Insurance
- −$499
- − Repairs & maintenance
- −$1,173
- − Management
- −$1,173
- − Depreciation
- −$2,902
- Taxable income
- $1,375
- Est. tax owed @ 24.0%
- −$330
- After-tax cash flow
- $2,524/yr
For passive investors: Depreciation is non-cash, so a rental often shows a tax loss while cash-flowing — sheltering income. Rental losses are passive: they offset passive income freely, and up to $25,000/yr can offset ordinary (W-2) income if you actively participate and your MAGI is under $100k (phasing out to $0 by $150k); unused losses carry forward. On sale, claimed depreciation is recaptured at up to 25%, and gains may owe capital-gains tax (a 1031 exchange can defer both). Figures are a year-1 estimate at your 24.0% rate — not tax advice; consult a CPA.
Schools (NCES district)
- District
- Gainesville ISD
- NCES district ID
- 4820220
- Math proficiency
- 33% ▼ -9.00%
- Reading proficiency
- 29% ▼ -2.00%
- Median HH income
- $41,772
- Composite
- 26.27/100
- National rank
- #7252
- State rank
- #606 of 826 in TX
Livability — Gainesville
- Score
- 66/100
- State rank
- #602
- US rank
- #11445
Category grades
Schools grade is shown separately in the Schools card above.
Census & demographics
- Census place
- Gainesville, TX
- County
- Cooke County · 29,419 people
- City population
- 29,419
- Metro
- Gainesville, TX
- Population (ZIP)
- 29,419
- Household income
- $71,502
- Rent vs Own
- Severe rent burden
- 660.0
Population outlook (Cooke County) Hauer SSP2
- Today (2025)
- 39,965 people
- By 2030
- 39,974 · +0.0%
- By 2040
- 39,772 · -0.5%
- By 2050
- 39,258 · -1.8%
- By 2075
- 37,262 · -6.8%
- By 2100
- 33,363 · -16.5%
Race, ethnicity, and origin ACS 2023
- Neighborhood character
- Predominantly White (66%)
- Race & ethnicity
- White 66% Hispanic / Latino 24% Two or more races 14% Black 5%
- Hispanic origin (detail)
- Mexican 21%
- Common ancestry
- Serbian 2% Lithuanian 2% Slovak 1%
- Foreign-born
- 8% · Canada
- Languages at home
- 83% English-only · Spanish 16% Other Indo-European 1%
Political lean MEDSL · Cooke
- 2024 margin
- Solid R (+66.9) · D 16.2% · R 83.1%
- 2008→2024 swing
- -8.2pp toward R · 2008: -58.7pp · 2024: -66.9pp
- All cycles
- 2024: R+66.9 2020: R+65.2 2016: R+68.1 2012: R+67.6 2008: R+58.7
Not yet ingested
- Civics
- —
Market trends
- HPI YoY
- ▼ -198.63%
- Current HPI
- 247.3822
- Rent YoY
- —
- Metro
- Gainesville, TX
- State GDP YoY
- ▲ 3.95%
- F500 in state
- 110
Industry mix (Fortune 500 HQ in TX)
| Industry | F500 HQs | Revenue |
|---|---|---|
| Energy | 16 | $1,198B |
|
||
| Technology | 5 | $198B |
|
||
| Engineering / Construction | 4 | $72B |
|
||
| Energy Services | 3 | $60B |
|
||
| Utilities | 3 | $41B |
|
||
| Healthcare | 2 | $330B |
|
||
Price history
+21.6% since first listed9 events — show timeline
- 2026-06-12 Price Changed $99,750 NTREIS
- 2026-05-16 Price Changed $99,900 NTREIS
- 2026-04-28 Listed $110,000 NTREIS
- 2025-11-15 Rental Removed $1,100 NTREIS
- 2025-10-26 Listed for Rent $1,100 NTREIS
- 2021-10-01 Sold (Public Records) — Public Records
- 2021-09-29 Sold (MLS) — NTREIS
- 2021-08-09 Contingent — NTREIS
- 2021-07-11 Listed $82,000 NTREIS
Property tax history
+7.5%/yrLatest (2025): $1,956 · +10.4% YoY. Source: county tax records.
Cash-flow waterfall
monthlySold comps — $/sqft
last 12 mo · ≤1 miLoading sold comps…