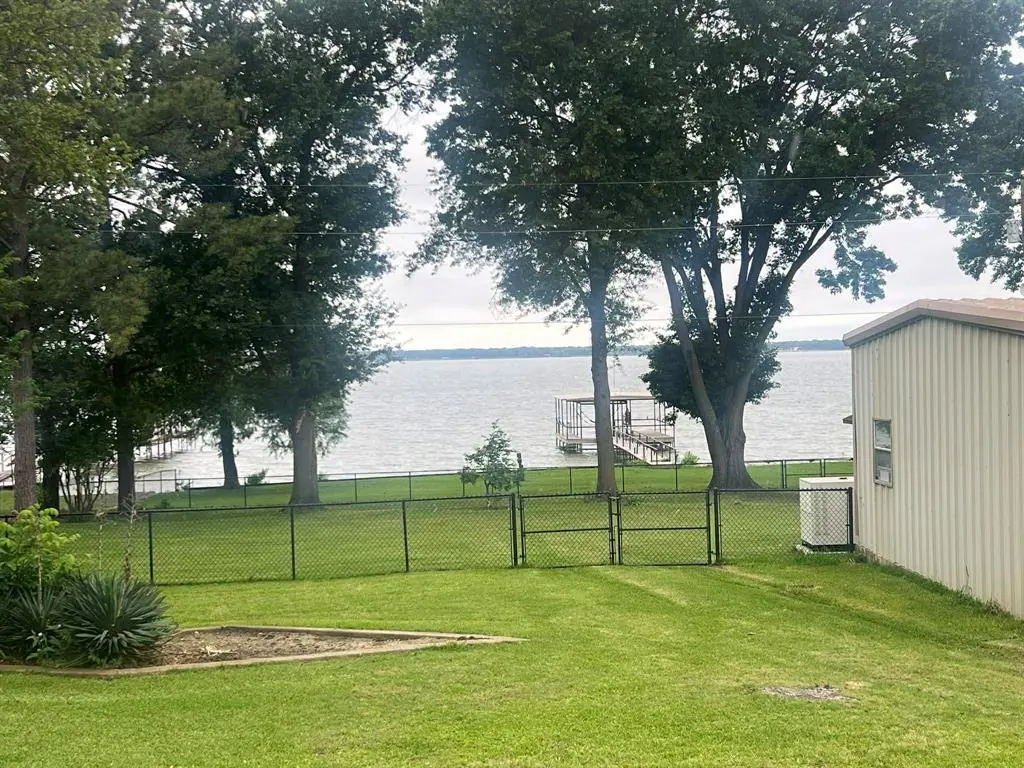
 🌊 Lakefront
7403 Circle Vw · East Tawakoni, TX
Flood risk 1/10 · Minimal
- FEMA flood zone
- X (unshaded)
- Chance of flooding over 30 yrs
- 0.0%
- Est. flood insurance / yr
- $507 – $1,088
Fire risk 3/10 · Minor
- Est. fire insurance / yr
- $1,222 – $2,270
Heat risk 7/10 · Major
- Hot days now (above 110°F)
- 7 days/yr
- Hot days in 30 yrs
- 22 days/yr
Wind risk 6/10 · Moderate
- Chance of severe wind over 30 yrs
- 27.0%
Air-quality risk 2/10 · Minimal
- Unhealthy air days now
- 0 days/yr
- Unhealthy air days in 30 yrs
- 1 days/yr
Risk factors via First Street. Map © Google.
Why this score? — see what drove the B+ grade
The composite is a weighted blend of 9 inputs, each scored 0–100. Each bar is that input's sub-score; the figure is the points it added to the 100-point composite (weight × sub-score).
- Cash flow +30.0/30.0
- 1% rule +10.0/10.0
- DSCR +10.0/10.0
- Appreciation +10.0/10.0
- ARV discount +7.5/15.0
- Schools +3.7/10.0
- Livability +2.6/5.0
- Rent growth +2.5/5.0
- Condition / age +2.5/5.0
$59,000
🖨 Deal sheet 📄 Offer letter ✓ Due diligence
Listing remarks
Investor special in the heart of Lone Oak with incredible lake views! This 2-bedroom, 1-bath home with a 1-car garage sits on approximately 0.35 acres directly across the street from lakefront properties, offering unobstructed sightlines and strong upside potential. The structure will require a full renovation—ideal for experienced investors looking for their next project, flip, or long-term hold. With the right vision, this property could be transformed into a highly desirable lake-view retreat without the premium price of direct waterfront ownership. Opportunities like this in Lone Oak—especially with this kind of view—are hard to find at this price point. Cash or hard m
Key facts
- 9,148 sq ft lot
- Garage
- Built 1975
Property features AI
Finance
- Other: Directions: Enter subdivision through Shoreline Dr via 3413; County: Hunt; Subdivision: Rolling Hills Sec III
- Financial info: Listing terms: Cash
- HOA & community: Voluntary association; Annual HOA fee of $100; HOA managed by Rolling Hills NP HOA
Exterior
- Parking: Attached garage (1 garage space); 1 covered parking space
- Utilities: City water; City sewer; Electricity available; Cable available; No municipal utility district
- Home design: Single-family residence; Residential property; One-story; Attached property
- Construction: Built in 1975; Shingle roof
- Exterior features: Lake-front lot; Boat ramp in the community
Interior
- Kitchen: Electric cooktop
- Bedrooms: 2 bedrooms total; Primary bedroom (level 1, approx. 10 x 13)
- Bathrooms: 1 full bathroom
- Interior features: High speed internet available; One living area; One dining area; Total rooms: 2; Living room (level 1, approx. 13 x 22)
Neighborhood map
What this means for you Summary
Snapshot
- This is a 2-bed/2.0-bath single-family listed at $59k.
Deal economics
- At list price, monthly cash flow is $717 ($9k/yr) — positive.
- The deal already cash-flows at list — no discount required.
- Meets the 1% rule at list price ($2k rent vs $59k).
- Recommended offer: $57k (3.0% below list) — sets the bar for market timing.
- Cap rate 20.9% vs local median 4.5% in East Tawakoni — top-decile yield for the area; either an underpriced asset or a hidden risk that comps aren't pricing in. Stress-test before assuming the spread holds.
Location & tenants
- Location reads 52/100 on livability (#1,455 in TX) — a working-class tenant base; expect higher turnover. Strengths: cost of living A+, housing A+; Watch: crime D, amenities F, commute F.
- Lone Oak ISD (rural): math 42% / reading 43% proficiency, ranked #310 of 826 in TX (top 38%) — families likely to look elsewhere, expect single-tenant / working-renter base with shorter leases.
- Zoned schools: Lone Oak El (math 37% / reading 42%, grade F, #1,545 of 4,322 statewide, top 38%, 489 students, 45% FRL).
- Market conditions: 115 active listings in the ZIP; 1,289 units permitted in Hunt County in 2024 (527 in 5+ unit buildings).
Forward outlook
- In year one you build about $6k of equity ($408 loan paydown + $6k appreciation (10.0% local appreciation)).
- Hunt County population projected at +15% by 2050 — modest demand growth; plan on rents tracking national, not racing it.
- At projected returns (10.0% appreciation + 3.0% rent growth), your $17k cash investment doubles in ~2 years — after that, you're playing with house money.
- By year 6, paydown + projected appreciation supports a ~$37k cash-out refi (75% LTV) — recoverable capital for the next deal without selling this one.
Negotiation context
- It's been on market 35 days — a 3% lower offer ($57k) is reasonable based on typical stale-listing flexibility.
Risks & watch-outs
- Watch-outs: property tax is 2.6% of price.
- Climate carrying-cost: major wind risk, 27% chance of damaging wind over 30y; extreme-heat days projected 7→22/yr by 2055 (HVAC capex compounding) — expect insurance premiums to compound above CPI over the hold.
Questions for the listing agent
- It's been on market 35 days. Have you received any prior offers? Is the seller open to a 3% concession, seller financing, or rate buy-down credit?
- Built in 1975 — when were the roof, HVAC, electrical panel, plumbing, and water heater last replaced?
- Property tax is high relative to price — has the assessment been appealed recently, and will the sale trigger a re-assessment?
- What does the HOA fee cover, when was the last increase, and are there any pending special assessments or reserve-fund shortfalls?
- Is there a deadline driving the sale (1031 exchange, divorce, estate, relocation)? That informs how much negotiation room exists.
- Schools are F-rated, which usually means shorter tenancies and higher turnover. Who's the typical renter profile here, and what's been the actual vacancy rate?
- Crime grade is D in this area — have there been break-ins, vandalism, or insurance claims at this property in the last 3 years? What carrier currently insures it and at what premium?
- This sits on a lake — are riparian / water-frontage rights deeded with the parcel? Any dock permits, shoreline easements, or HOA water-use restrictions?
- What's the documented flood / surge / shoreline-erosion history here (FEMA AND non-FEMA — e.g., storm surge, creek backup, septic-field saturation)?
- Any water-quality or seasonal algae-bloom issues that affect tenant satisfaction or short-term-rental demand?
- What's the average days-on-market for RENTAL listings here right now (not sales)? A rising rental-DOM trend means longer vacancies and softer asking-rent achievability than the comps imply.
- What's the recent tenant-quality profile in this submarket — average credit score on applications, eviction rate, late-payment / NSF rate, and stable-employment percentage? A property-management company in the area should have these aggregated.
- How much new for-sale + rental construction is in the pipeline within 1–3 miles? Heavy new supply typically softens prices + rents 12–24 months out; constrained supply supports both.
Investment metrics
- 1% rule
- 2.55% ✓
- Cap rate
- 20.88%
- Cash-on-cash
- 52.09%
- DSCR
- 3.32
- GRM
- 3.3
CMA / ARV
- ARV (median comp)
- $151,001
- List price
- $59,000
- Delta
- -60.93%
- Verdict
- UNDERPRICED
- Comps
- 6 within 1.0 mi
Show comp detail 4 sales within ~0.75 mi
| Address | Dist | Beds/Ba | Sqft | Sold | Price | $/sf | Match |
|---|---|---|---|---|---|---|---|
| 7426 Scenic Dr | 0.06mi | 2/1.0 | 1,220 (+3%) | 5mo | $145,000 | $119 | 85 |
| 7434 Scenic Dr | 0.07mi | 2/1.5 | 1,174 (-1%) | 20mo | $220,000 | $187 | 76 |
| 7797 Scenic Dr | 0.34mi | 2/2.0 | 1,200 (+1%) | 16mo | $160,000 | $133 | 70 |
| 7353 Shoreline Dr | 0.40mi | 2/2.0 | 1,158 (-2%) | 15mo | $204,999 | $177 | 64 |
Match score weights: distance 35% · size 25% · config 20% · recency 20%. Top-matched comps best support the ARV.
Projected returns pro-forma
10.0% appreciation · 3.0% rent growth · sell at horizon
- IRR
- 65.4%
- Equity multiple
- 5.71×
- Total profit
- $77,863
- Equity at exit
- $53,152
- IRR
- 59.0%
- Equity multiple
- 12.71×
- Total profit
- $193,500
- Equity at exit
- $114,624
Cash invested: $16,520 (down + closing). Projections, not guarantees.
Landlord ↔ Tenant lean methodology
- Overall (STATE)
- 87 Strongly Landlord-Friendly
- State Texas
- 87 Strongly Landlord-Friendly · R+5
- County
- — inherits STATE
- City
- — inherits STATE
ZIP-level market 75453
- Home prices YoY
- 25.2%
- Active inventory
- 115
- Price-to-rent
- 3.3×
Monthly cashflow live
- Estimated rent
- $1,502 medium interval (Pro) →
- Mortgage (P&I)
- −$309
- Tax from tax record
- −$127 /mo · $1,528/yr
- Insurance
- −$25
- HOA
- −$8
- Vacancy / Maint / Mgmt
- −$315
- Net cashflow
- $717
Break-even live
UW: 25.0% down · 7.5% · 30yr · 1.5% tax · 5.0% vac · 8.0% maint · 8.0% mgmt
Financing live
Cash to close
- Down payment
- $14,750
- Closing costs
- $1,770
- Reserves months
- —
- Total cash needed
- —
Loan-product check · same deal, 3 products live
Conventional
25% down · 7.5% · 30yr
- Down + closing
- —
- Monthly P&I
- —
- Monthly cashflow
- —
- DSCR
- —
- Eligible?
- —
Personal DTI + credit; lowest rate.
DSCR
20% down · 8.5% · 30yr
- Down + closing
- —
- Monthly P&I
- —
- Monthly cashflow
- —
- DSCR
- —
- Eligible?
- —
No personal income docs; deal must DSCR.
Hard money
10% down · 12.0% · 12mo
- Down + closing
- —
- Monthly P&I
- —
- Monthly cashflow
- —
- DSCR
- —
- Eligible?
- —
Short-term bridge; refi at stabilization.
HOA detail
- Monthly dues
- $8 · $96/yr
- Likely covers
- water
Listing history 11 events
-
2026-06-10status $59,000 Pending 35 DOM
-
2026-06-09days on market $59,000 Active 35 DOM
-
2026-06-08days on market $59,000 Active 34 DOM
-
2026-06-07days on market $59,000 Active 33 DOM
-
2026-06-04days on market $59,000 Active 30 DOM
-
2026-06-03days on market $59,000 Active 29 DOM
-
2026-06-02days on market $59,000 Active 28 DOM
-
2026-06-02price $59,000 Active 27 DOM
-
2026-06-01days on market $69,000 Active 27 DOM
-
2026-05-31days on market $69,000 Active 26 DOM
-
2026-05-05$89,900 Active 761-char remark
ⓘ Source: listings_history table (triggers on properties + properties_extension) + one-shot
backfill from property_details.listing_events for pre-trigger history.
Tax reassessment forecast TX · Resets to sale price
- Current annual tax
- $1,528 · $127/mo
- Projected year-2 tax
- $1,528 · $127/mo
- Expected delta
- $0/yr ($0/mo · 0.0%)
ⓘ Screening estimate from a state-policy table — verify with the county assessor before closing.
Climate risk First Street
- Flood 1/10 Low FEMA zone X (unshaded) · 0% chance over 30 yrs
- Wildfire 3/10 Moderate
- Heat 7/10 Severe 7 d/yr ≥110°F today · 22 d/yr by 30 yrs out
- Wind 6/10 Major 27% chance of damaging wind over 30 yrs
- Air quality 2/10 Low 0 unhealthy d/yr today · 1 by 30 yrs out
Nearby sold comps map
Loading sold comps map…
Walkable amenities ~0.75 mi
Loading nearby amenities…
Taxation est. · year 1
- Rental income
- $18,021
- − Mortgage interest
- −$3,305
- − Property taxes
- −$1,528
- − Insurance
- −$295
- − Repairs & maintenance
- −$1,442
- − Management
- −$1,442
- − HOA
- −$96
- − Depreciation
- −$1,716
- Taxable income
- $8,197
- Est. tax owed @ 24.0%
- −$1,967
- After-tax cash flow
- $6,637/yr
For passive investors: Depreciation is non-cash, so a rental often shows a tax loss while cash-flowing — sheltering income. Rental losses are passive: they offset passive income freely, and up to $25,000/yr can offset ordinary (W-2) income if you actively participate and your MAGI is under $100k (phasing out to $0 by $150k); unused losses carry forward. On sale, claimed depreciation is recaptured at up to 25%, and gains may owe capital-gains tax (a 1031 exchange can defer both). Figures are a year-1 estimate at your 24.0% rate — not tax advice; consult a CPA.
Schools (NCES district)
- District
- Lone Oak ISD
- NCES district ID
- 4828020
- Math proficiency
- 42% ▼ -9.00%
- Reading proficiency
- 43% ▼ -7.00%
- Median HH income
- $51,628
- Composite
- 36.72/100
- National rank
- #4593
- State rank
- #310 of 826 in TX
Livability — East Tawakoni
- Score
- 52/100
- State rank
- #1455
- US rank
- #24873
Category grades
Schools grade is shown separately in the Schools card above.
Census & demographics
- Population (ZIP)
- 2,832
Population outlook (Hunt County) Hauer SSP2
- Today (2025)
- 97,090 people
- By 2030
- 100,452 · +3.5%
- By 2040
- 106,544 · +9.7%
- By 2050
- 111,218 · +14.6%
- By 2075
- 121,695 · +25.3%
- By 2100
- 123,683 · +27.4%
Race, ethnicity, and origin ACS 2023
- Neighborhood character
- Predominantly White (73%)
- Race & ethnicity
- White 73% Hispanic / Latino 17% Two or more races 7% Black 1%
- Hispanic origin (detail)
- Mexican 15%
- Common ancestry
- Italian 2% Portuguese 1% Romanian 1%
- Foreign-born
- 7% · Canada
- Languages at home
- 93% English-only · Spanish 6% Other Asian/Pacific 1%
Political lean MEDSL · Hunt
- 2024 margin
- Solid R (+55.5) · D 21.9% · R 77.4%
- 2008→2024 swing
- -14.9pp toward R · 2008: -40.6pp · 2024: -55.5pp
- All cycles
- 2024: R+55.5 2020: R+52.5 2016: R+56.3 2012: R+51.2 2008: R+40.6
Not yet ingested
- Civics
- —
Market trends
- HPI YoY
- ▲ 51.45%
- Current HPI
- 255.6167
- Rent YoY
- —
- Metro
- —
- State GDP YoY
- ▲ 3.95%
- F500 in state
- 110
Industry mix (Fortune 500 HQ in TX)
| Industry | F500 HQs | Revenue |
|---|---|---|
| Energy | 16 | $1,198B |
|
||
| Technology | 5 | $198B |
|
||
| Engineering / Construction | 4 | $72B |
|
||
| Energy Services | 3 | $60B |
|
||
| Utilities | 3 | $41B |
|
||
| Healthcare | 2 | $330B |
|
||
Price history
-34.4% since first listed6 events — show timeline
- 2026-06-18 Sold (MLS) — NTREIS
- 2026-06-09 Pending — NTREIS
- 2026-06-01 Price Changed $59,000 NTREIS
- 2026-05-26 Price Changed $69,000 NTREIS
- 2026-05-19 Price Changed $79,000 NTREIS
- 2026-05-05 Listed $89,900 NTREIS
Property tax history
+2.0%/yrLatest (2025): $1,528 · +0.8% YoY. Source: county tax records.
Cash-flow waterfall
monthlySold comps — $/sqft
last 12 mo · ≤1 miLoading sold comps…