110 S Garrett St · Siloam Springs, AR
Flood risk 1/10 · Minimal
- FEMA flood zone
- X (unshaded)
- Chance of flooding over 30 yrs
- 0.0%
- Est. flood insurance / yr
- $473 – $860
Fire risk 6/10 · Moderate
- Est. fire insurance / yr
- $1,499 – $2,785
Heat risk 5/10 · Moderate
- Hot days now (above 106°F)
- 7 days/yr
- Hot days in 30 yrs
- 20 days/yr
Wind risk 2/10 · Minimal
- Chance of severe wind over 30 yrs
- 3.0%
Air-quality risk 2/10 · Minimal
- Unhealthy air days now
- 1 days/yr
- Unhealthy air days in 30 yrs
- 2 days/yr
Risk factors via First Street. Map © Google.
Why this score? — see what drove the D grade
The composite is a weighted blend of 9 inputs, each scored 0–100. Each bar is that input's sub-score; the figure is the points it added to the 100-point composite (weight × sub-score).
- ARV discount +15.0/15.0
- Cash flow +9.7/30.0
- Livability +3.7/5.0
- Schools +3.6/10.0
- DSCR +2.7/10.0
- 1% rule +2.6/10.0
- Rent growth +2.5/5.0
- Condition / age +2.5/5.0
- Appreciation +0.0/10.0
$319,900
🖨 Deal sheet 📄 Offer letter ✓ Due diligence
Listing remarks MLS
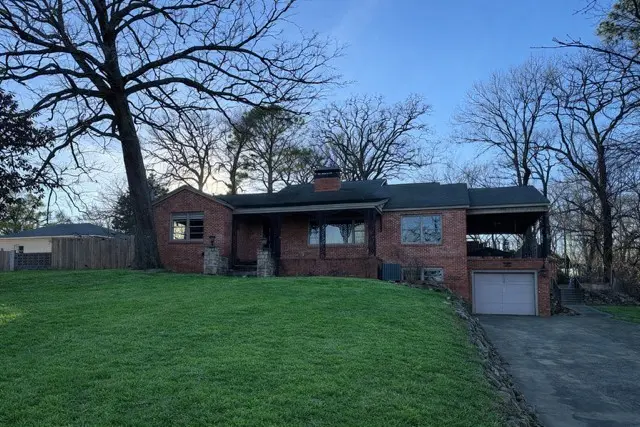
Step into a piece of Siloam Springs history with this distinctive downtown property, rich in character and timeless charm. Located in the heart of the historic district, this building offers original architectural details and an unbeatable walkable location near shops, dining, and local attractions. Sold AS IS, the property presents a rare opportunity for investors, visionaries, or preservation enthusiasts to restore, repurpose, or reimagine a landmark in one of Northwest Arkansas’s most desirable downtown areas. With over 2500 sq ft of living space, a large covered patio, ingound swimming pool, large lot, prime location and historic appeal, make this a canvas ready for your next bold project.
Key facts
- Large lot
- Large covered patio
- Walkable location
Tags
Neighborhood map
What this means for you Summary
Snapshot
- This is a 3-bed/2.5-bath single-family listed at $320k.
Deal economics
- At list price, monthly cash flow is $-212 ($-3k/yr) — negative.
- To cash-flow at today's rent, offer at most $283k (11.7% below list).
- To meet the 1% rule (rent ≥ 1% of price), the offer needs to be $242k (24.4% below list).
- Recommended offer: $242k (24.4% below list) — sets the bar for 1% rule.
- Cap rate 5.5% vs local median 3.9% in Siloam Springs — top-decile yield for the area; either an underpriced asset or a hidden risk that comps aren't pricing in. Stress-test before assuming the spread holds.
Location & tenants
- Location reads 74/100 on livability (#17 in AR, #4,621 nationally) — a middle-class / working-renter tenant base. Strengths: cost of living A+, housing A+, health & safety A+; Watch: schools D, crime D, amenities F.
- Siloam Springs School District (town): math 44% / reading 40% proficiency, ranked #53 of 238 in AR (top 22%) — families likely to look elsewhere, expect single-tenant / working-renter base with shorter leases.
- Market conditions: 362 active listings in the ZIP; 10 comparable units currently listed for rent nearby; rentals at typical pace (median 21d on market — plan ~3-4 weeks tenant-placement turnaround); solid renter incomes; 4,359 units permitted in Benton County in 2024 (402 in 5+ unit buildings).
- This rent runs 38% of the median local income ($76k/yr) — at the standard rent-burdened threshold; future hikes will face affordability resistance.
Forward outlook
- Local home prices are declining (-3.0%/yr); year-one equity from $2k of loan paydown is wiped out by about $10k of value loss. Plan a longer hold.
- Benton County population projected at +56% by 2050 — long-run rental-demand tailwind backs the buy-and-hold thesis.
Negotiation context
- It's been on market 128 days — a 12% lower offer ($282k) is reasonable based on typical stale-listing flexibility.
- 2 sale attempts since 5y ago with the ask held roughly flat each time — persistent listings suggest the price (not the market) is what's stuck; bring a comps-based counter.
Risks & watch-outs
- Watch-outs: built in 1952 — expect roof / HVAC / electrical / plumbing capex.
- Climate carrying-cost: major wildfire risk; extreme-heat days projected 7→20/yr by 2055 (HVAC capex compounding) — expect insurance premiums to compound above CPI over the hold.
Questions for the listing agent
- What do current leases actually rent for vs. the listed asking? Can we see a recent rent roll and the last 12 months of T-12 income?
- It's been on market 128 days. Have you received any prior offers? Is the seller open to a 24% concession, seller financing, or rate buy-down credit?
- Built in 1952 — when were the roof, HVAC, electrical panel, plumbing, and water heater last replaced?
- Why hasn't it sold? Are there any deal-killer items the seller is aware of (foundation, flood, title, zoning, code violations)?
- Is there a deadline driving the sale (1031 exchange, divorce, estate, relocation)? That informs how much negotiation room exists.
- Schools are D-rated, which usually means shorter tenancies and higher turnover. Who's the typical renter profile here, and what's been the actual vacancy rate?
- Crime grade is D in this area — have there been break-ins, vandalism, or insurance claims at this property in the last 3 years? What carrier currently insures it and at what premium?
- The area grade is low — what's the realistic commute time and amenity access for the typical tenant pool here? Any planned neighborhood developments (good or bad) we should know about?
- What's the average days-on-market for RENTAL listings here right now (not sales)? A rising rental-DOM trend means longer vacancies and softer asking-rent achievability than the comps imply.
- What's the recent tenant-quality profile in this submarket — average credit score on applications, eviction rate, late-payment / NSF rate, and stable-employment percentage? A property-management company in the area should have these aggregated.
- How much new for-sale + rental construction is in the pipeline within 1–3 miles? Heavy new supply typically softens prices + rents 12–24 months out; constrained supply supports both.
Investment metrics
- 1% rule
- 0.76% ✗
- Cap rate
- 5.50%
- Cash-on-cash
- -2.83%
- DSCR
- 0.87
- GRM
- 11.0
CMA / ARV
- ARV (median comp)
- $410,479
- List price
- $319,900
- Delta
- -22.07%
- Verdict
- UNDERPRICED
- Comps
- 20 within 1.0 mi
Show comp detail 12 sales within ~0.75 mi
| Address | Dist | Beds/Ba | Sqft | Sold | Price | $/sf | Match |
|---|---|---|---|---|---|---|---|
| 301 S Dogwood St | 0.41mi | 3/2.5 | 2,506 (-1%) | 3mo | $367,000 | $146 | 77 |
| 1069 Twin Springs Ct | 0.32mi | 4/2.5 (+1) | 2,450 (-3%) | 1mo | $500,000 | $204 | 74 |
| 617 E Delaware St | 0.64mi | 3/2.5 | 2,500 (-1%) | 1mo | $375,000 | $150 | 67 |
| 111 S Oak Hill St | 0.03mi | 4/2.0 (+1) | 2,697 (+6%) | 20mo | $1,165,000 | $432 | 64 |
| 1005 W Jefferson St | 0.34mi | 3/1.5 | 2,300 (-9%) | 4mo | $373,000 | $162 | 62 |
| 904 Elgin St | 0.36mi | 3/2.0 | 2,250 (-11%) | 4mo | $360,000 | $160 | 59 |
| 905 W Elgin St | 0.39mi | 4/2.0 (+1) | 2,230 (-12%) | 4mo | $335,000 | $150 | 51 |
| 119 S Dogwood St | 0.39mi | 3/2.5 | 2,187 (-14%) | 12mo | $388,000 | $177 | 49 |
| 1402 N Latisha Ln | 0.74mi | 4/2.0 (+1) | 2,573 (+2%) | 14mo | $370,000 | $144 | 44 |
| 302 Wright St | 0.28mi | 4/2.0 (+1) | 2,240 (-12%) | 20mo | $415,000 | $185 | 44 |
| 703 W Elgin St | 0.35mi | 4/2.5 (+1) | 2,204 (-13%) | 20mo | $320,000 | $145 | 40 |
| 311 E University St | 0.46mi | 4/2.0 (+1) | 2,278 (-10%) | 19mo | $330,000 | $145 | 39 |
Match score weights: distance 35% · size 25% · config 20% · recency 20%. Top-matched comps best support the ARV.
Projected returns pro-forma
-3.0% appreciation · 3.0% rent growth · sell at horizon
- IRR
- -21.0%
- Equity multiple
- 0.27×
- Total profit
- $-65,332
- Equity at exit
- $47,698
- IRR
- -14.5%
- Equity multiple
- 0.17×
- Total profit
- $-74,317
- Equity at exit
- $27,659
Cash invested: $89,572 (down + closing). Projections, not guarantees.
Landlord ↔ Tenant lean methodology
- Overall (STATE)
- 92 Strongly Landlord-Friendly
- State Arkansas
- 92 Strongly Landlord-Friendly · R+14
- County
- — inherits STATE
- City
- — inherits STATE
ZIP-level market 72761
- Home prices YoY
- -13.6%
- Active inventory
- 362
- Price-to-rent
- 11.0×
Monthly cashflow live
- Estimated rent
- $2,417 high interval (Pro) →
- Mortgage (P&I)
- −$1,678
- Tax from tax record
- −$310 /mo · $3,723/yr
- Insurance
- −$133
- HOA
- −$0
- Vacancy / Maint / Mgmt
- −$508
- Net cashflow
- $-212
Break-even live
UW: 25.0% down · 7.5% · 30yr · 1.5% tax · 5.0% vac · 8.0% maint · 8.0% mgmt
Financing live
Cash to close
- Down payment
- $79,975
- Closing costs
- $9,597
- Reserves months
- —
- Total cash needed
- —
Loan-product check · same deal, 3 products live
Conventional
25% down · 7.5% · 30yr
- Down + closing
- —
- Monthly P&I
- —
- Monthly cashflow
- —
- DSCR
- —
- Eligible?
- —
Personal DTI + credit; lowest rate.
DSCR
20% down · 8.5% · 30yr
- Down + closing
- —
- Monthly P&I
- —
- Monthly cashflow
- —
- DSCR
- —
- Eligible?
- —
No personal income docs; deal must DSCR.
Hard money
10% down · 12.0% · 12mo
- Down + closing
- —
- Monthly P&I
- —
- Monthly cashflow
- —
- DSCR
- —
- Eligible?
- —
Short-term bridge; refi at stabilization.
Rent comps 10 comps
| Address | Beds | Baths | Sqft | Rent | $/sqft | DOM | Units | Dist |
|---|---|---|---|---|---|---|---|---|
| 408 S Wright St Unit 1520957P Siloam Springs, AR | 4.0 | 3.0 | 2109 | $4,449 | $2.11 | 21d | 1 | 0.31mi |
| 201 N Dogwood St Unit 1241305P Siloam Springs, AR | 3.0 | 2.0 | 1969 | $3,298 | $1.67 | 13d | 1 | 0.40mi |
| 315 W Harvard St Unit 1520942P Siloam Springs, AR | 3.0 | 2.0 | 2045 | $3,266 | $1.60 | 13d | 1 | 0.41mi |
| 2010 W Central St Unit 1520931P Siloam Springs, AR | 4.0 | 2.0 | 1894 | $3,631 | $1.92 | 13d | 1 | 0.82mi |
| 1806 Azlin Pl Unit C Siloam Springs, AR | 4.0 | 2.5 | 1781 | $1,425 | $0.80 | 14d | 1 | 1.29mi |
| 1903 Azlin Pl Unit B Siloam Springs, AR | 3.0 | 2.5 | 1800 | $1,500 | $0.83 | 21d | 1 | 1.34mi |
| 1903 Azlin Pl Siloam Springs, AR | 3.0 | 2.5 | 1800 | $1,500 | $0.83 | 14d | 1 | 1.34mi |
| 2303 N Presley St Siloam Springs, AR | 4.0 | 3.0 | 2148 | $2,150 | $1.00 | 23d | 1 | 1.34mi |
| 2304 N Presley St Siloam Springs, AR | 4.0 | 3.0 | 2148 | $2,150 | $1.00 | 23d | 1 | 1.35mi |
| 2302 Aspen Siloam Springs, AR | 4.0 | 2.0 | 1940 | $1,850 | $0.95 | 23d | 1 | 1.46mi |
Listing history 20 events
-
2026-06-18days on market $319,900 Active 128 DOM
-
2026-06-17days on market $319,900 Active 127 DOM
-
2026-06-16days on market $319,900 Active 126 DOM
-
2026-06-15days on market $319,900 Active 125 DOM
-
2026-06-14days on market $319,900 Active 123 DOM
-
2026-06-10days on market $319,900 Active 120 DOM
-
2026-06-09days on market $319,900 Active 119 DOM
-
2026-06-08days on market $319,900 Active 118 DOM
-
2026-06-07days on market $319,900 Active 117 DOM
-
2026-06-03days on market $319,900 Active 113 DOM
-
2026-06-02days on market $319,900 Active 112 DOM
-
2026-06-01days on market $319,900 Active 111 DOM
-
2026-05-31days on market $319,900 Active 110 DOM
-
2026-05-31days on market $319,900 Active 109 DOM
-
2026-04-06price $319,900 708-char remark
Show marketing remark (708 chars)
Step into a piece of Siloam Springs history with this distinctive downtown property, rich in character and timeless charm. Located in the heart of the historic district, this building offers original architectural details and an unbeatable walkable location near shops, dining, and local attractions. Sold AS IS, the property presents a rare opportunity for investors, visionaries, or preservation enthusiasts to restore, repurpose, or reimagine a landmark in one of Northwest Arkansas’s most desirable downtown areas. With over 2500 sq ft of living space, a large covered patio, ingound swimming pool, large lot, prime location and historic appeal, make this a canvas ready for your next bold project.
-
2026-02-10$325,000 Active 708-char remark
Show marketing remark (708 chars)
Step into a piece of Siloam Springs history with this distinctive downtown property, rich in character and timeless charm. Located in the heart of the historic district, this building offers original architectural details and an unbeatable walkable location near shops, dining, and local attractions. Sold AS IS, the property presents a rare opportunity for investors, visionaries, or preservation enthusiasts to restore, repurpose, or reimagine a landmark in one of Northwest Arkansas’s most desirable downtown areas. With over 2500 sq ft of living space, a large covered patio, ingound swimming pool, large lot, prime location and historic appeal, make this a canvas ready for your next bold project.
-
2021-07-15soldstatus $299,000
-
2021-07-13soldstatus $299,000 203-char remark
Show marketing remark (203 chars)
Charming older brick 2 story home with finished basement/playroom. Large 3 lot yard in the center of town and near JBU walking trails. Private in ground pool to enjoy summer days with family and friends.
-
2021-07-13$299,000 203-char remark
Show marketing remark (203 chars)
Charming older brick 2 story home with finished basement/playroom. Large 3 lot yard in the center of town and near JBU walking trails. Private in ground pool to enjoy summer days with family and friends.
-
1994-12-30soldstatus $125,000
ⓘ Source: listings_history table (triggers on properties + properties_extension) + one-shot
backfill from property_details.listing_events for pre-trigger history.
Tax reassessment forecast AR · Resets to sale price
- Current annual tax
- $3,723 · $310/mo
- Projected year-2 tax
- $3,723 · $310/mo
- Expected delta
- $0/yr ($0/mo · 0.0%)
ⓘ Screening estimate from a state-policy table — verify with the county assessor before closing.
Climate risk First Street
- Flood 1/10 Low FEMA zone X (unshaded) · 0% chance over 30 yrs
- Wildfire 6/10 Major
- Heat 5/10 Major 7 d/yr ≥106°F today · 20 d/yr by 30 yrs out
- Wind 2/10 Low 3% chance of damaging wind over 30 yrs
- Air quality 2/10 Low 1 unhealthy d/yr today · 2 by 30 yrs out
Nearby sold comps map
Loading sold comps map…
Walkable amenities ~0.75 mi
Loading nearby amenities…
Taxation est. · year 1
- Rental income
- $29,005
- − Mortgage interest
- −$17,919
- − Property taxes
- −$3,723
- − Insurance
- −$1,600
- − Repairs & maintenance
- −$2,320
- − Management
- −$2,320
- − Depreciation
- −$9,306
- Taxable loss
- −$8,183
- Est. tax savings @ 24.0%
- +$1,964
- After-tax cash flow
- $-575/yr
For passive investors: Depreciation is non-cash, so a rental often shows a tax loss while cash-flowing — sheltering income. Rental losses are passive: they offset passive income freely, and up to $25,000/yr can offset ordinary (W-2) income if you actively participate and your MAGI is under $100k (phasing out to $0 by $150k); unused losses carry forward. On sale, claimed depreciation is recaptured at up to 25%, and gains may owe capital-gains tax (a 1031 exchange can defer both). Figures are a year-1 estimate at your 24.0% rate — not tax advice; consult a CPA.
Schools (NCES district)
- District
- Siloam Springs School District
- NCES district ID
- 0512450
- Math proficiency
- 44% ▼ -7.00%
- Reading proficiency
- 40% ▼ -2.00%
- Median HH income
- $46,222
- Composite
- 35.81/100
- National rank
- #4828
- State rank
- #53 of 238 in AR
Livability — Siloam Springs
- Score
- 74/100
- State rank
- #17
- US rank
- #4621
Category grades
Schools grade is shown separately in the Schools card above.
Census & demographics
- Census place
- Siloam Springs, AR
- County
- Benton County · 259,241 people
- City population
- 24,745
- Metro
- Fayetteville-Springdale-Rogers, AR
- Population (ZIP)
- 24,745
- Household income
- $76,122
- Rent vs Own
- Severe rent burden
- 176.0
Population outlook (Benton County) Hauer SSP2
- Today (2025)
- 318,683 people
- By 2030
- 353,481 · +10.9%
- By 2040
- 425,280 · +33.4%
- By 2050
- 497,239 · +56.0%
- By 2075
- 662,114 · +107.8%
- By 2100
- 776,431 · +143.6%
Race, ethnicity, and origin ACS 2023
- Neighborhood character
- Diverse neighborhood (Simpson 0.63)
- Race & ethnicity
- White 58% Two or more races 24% Hispanic / Latino 19% Native American 4% Asian 3%
- Hispanic origin (detail)
- Mexican 8% Puerto Rican 2%
- Common ancestry
- Italian 2% Slovak 1% Serbian 1%
- Foreign-born
- 11% · Canada
- Languages at home
- 85% English-only · Spanish 13% Other Indo-European 1%
Political lean MEDSL · Benton
- 2024 margin
- Strong R (+27.0) · D 35.2% · R 62.1% · Other 2.7%
- 2008→2024 swing
- +9.6pp toward D · 2008: -36.5pp · 2024: -27.0pp
- All cycles
- 2024: R+27.0 2020: R+26.4 2016: R+34.9 2012: R+40.4 2008: R+36.5
Not yet ingested
- Civics
- —
Market trends
- HPI YoY
- ▼ -45.93%
- Current HPI
- 291.1062
- Rent YoY
- —
- Metro
- Fayetteville-Springdale-Rogers, AR
- State GDP YoY
- ▲ 3.80%
- F500 in state
- 10
Industry mix (Fortune 500 HQ in AR)
| Industry | F500 HQs | Revenue |
|---|---|---|
| Retail | 1 | $681B |
|
||
| Food / Agriculture | 1 | $53B |
|
||
| Retail / Energy | 1 | $22B |
|
||
| Transportation / Logistics | 1 | $12B |
|
||
| Energy | 1 | $4B |
|
||
Price history
+155.9% since first listed6 events — show timeline
- 2026-04-06 Price Changed $319,900 NWARMLS
- 2026-02-10 Listed $325,000 NWARMLS
- 2021-07-15 Sold (Public Records) $299,000 Public Records
- 2021-07-13 Listed $299,000 NWARMLS
- 2021-07-13 Sold (MLS) $299,000 NWARMLS
- 1994-12-30 Sold (Public Records) $125,000 Public Records
Property tax history
+7.6%/yrLatest (2025): $3,723 · +10.2% YoY. Source: county tax records.
Cash-flow waterfall
monthlySold comps — $/sqft
last 12 mo · ≤1 miLoading sold comps…