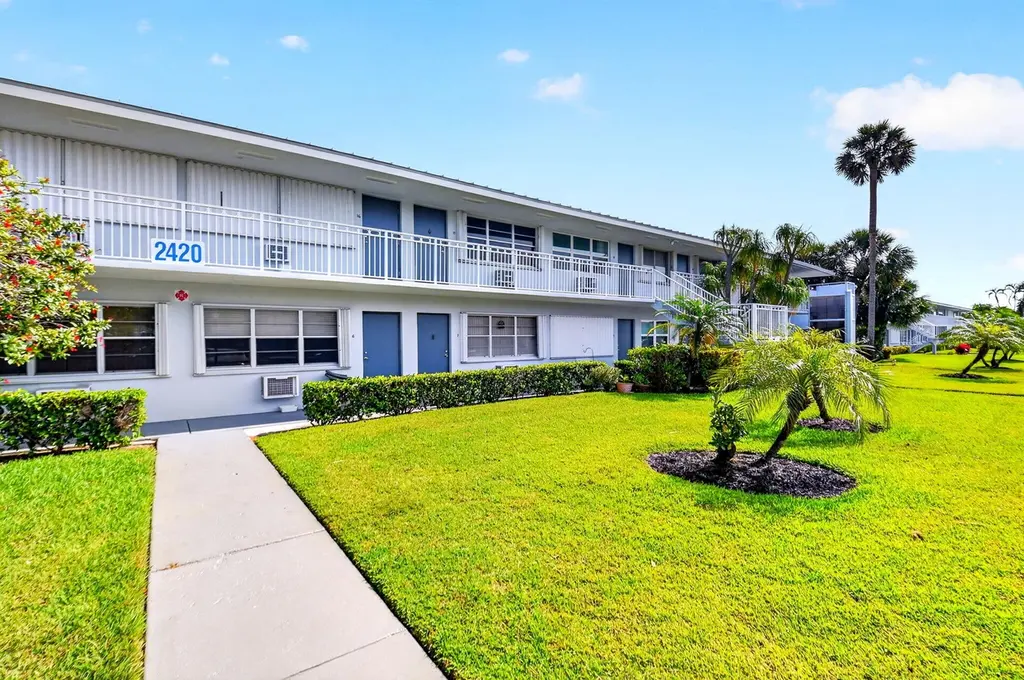
2420 S Federal Hwy #0100 · Boynton Beach, FL
Flood risk 7/10 · Major
- FEMA flood zone
- AE
- Chance of flooding over 30 yrs
- 0.74%
- Est. flood insurance / yr
- $1,737 – $8,500
Fire risk 1/10 · Minimal
- Est. fire insurance / yr
- $947 – $1,759
Heat risk 10/10 · Severe
- Hot days now (above 105°F)
- 7 days/yr
- Hot days in 30 yrs
- 29 days/yr
Wind risk 10/10 · Severe
- Chance of severe wind over 30 yrs
- 99.0%
Air-quality risk 2/10 · Minimal
- Unhealthy air days now
- 1 days/yr
- Unhealthy air days in 30 yrs
- 2 days/yr
Risk factors via First Street. Map © Google.
Why this score? — see what drove the B grade
The composite is a weighted blend of 9 inputs, each scored 0–100. Each bar is that input's sub-score; the figure is the points it added to the 100-point composite (weight × sub-score).
- Cash flow +30.0/30.0
- 1% rule +10.0/10.0
- DSCR +10.0/10.0
- ARV discount +7.5/15.0
- Schools +4.3/10.0
- Livability +3.6/5.0
- Rent growth +3.4/5.0
- Condition / age +2.5/5.0
- Appreciation +0.0/10.0
$99,000
🖨 Deal sheet 📄 Offer letter ✓ Due diligence
Listing remarks
1st Floor, 1BR/1BA CO-OP, with waterfront living at its finest. The property is situated along the Intracoastal Waterway, with newly updated amenities to include a full service clubhouse, heated salt water pool, fishing dock, community room, game room, laundry, shuffleboard court and large patio for relaxing, all overlooking the waterway. Close to beaches, shopping and fine restaurants. Also convenient to PBI Airport. This unit has been freshly painted and ready for occupancy. Updated kitchen and bathroom, tile flooring throughout. The building has a new metal roof and freshly painted exterior. Maintenance fee includes water, insurance and more.
Key facts
- Fishing dock
- Waterfront living
- Community room
Tags
Property features AI
Finance
- Other: Resale condition; Living area listed as 570 (public records)
- HOA & community: Association: 2420 Corporation; Monthly association fee; Association amenities include clubhouse, game room, laundry, pool (heated), shuffleboard court, community room, street lights; HOA covers cable TV, grounds and structure maintenance, pest control, sewer, water, common areas, common real estate tax, reserve funds, recreation facility, and pool service; Senior community; 236 units in community; No pets allowed
Exterior
- Parking: Assigned, guest and open parking; One parking space
- Utilities: Public water; Public sewer; Electricity connected with 220 volts in kitchen and circuit breakers
- Home design: Co-ownership property; One level (entry level 1); Faces south
- Construction: Frame/CBS/Concrete block with stucco construction; Metal roof; Block foundation; Two-story building (unit in a 2-story building)
- Exterior features: Interior, landscaped lot; Lake access; Asphalt and paved road frontage; Private maintained road
Interior
- Kitchen: Electric range; Refrigerator
- Bedrooms: One main-level bedroom
- Flooring: Ceramic tile
- Bathrooms: One full bathroom on main level
- Heating & cooling: Window/wall heating; Wall/window cooling units
- Interior features: Accessible bedroom, closets, common area, central living area, doors, entrance, full bath, and hallway(s); Accessible kitchen and kitchen appliances; Accessible washer/dryer; Unfurnished; Ceramic tile flooring
- Laundry & utility: Washer/dryer accessibility noted (accessible washer/dryer)
Neighborhood map
What this means for you Summary
Snapshot
- This is a 1-bed/1.0-bath condo listed at $99k.
Deal economics
- At list price, monthly cash flow is $81 ($967/yr) — positive.
- The deal already cash-flows at list — no discount required.
- Meets the 1% rule at list price ($2k rent vs $99k).
- Recommended offer: $96k (3.0% below list) — sets the bar for market timing.
- Cap rate 12.4% vs local median 4.3% in Boynton Beach — top-decile yield for the area; either an underpriced asset or a hidden risk that comps aren't pricing in. Stress-test before assuming the spread holds.
Location & tenants
- Location reads 72/100 on livability (#351 in FL) — a middle-class / working-renter tenant base. Strengths: housing A+, health & safety B+, cost of living B; Watch: amenities D+, crime D-, commute F.
- Palm Beach (suburban): math 46% / reading 53% proficiency, ranked #34 of 73 in FL (top 47%) — families likely to look elsewhere, expect single-tenant / working-renter base with shorter leases.
- Zoned schools: Rolling Green Elementary School (math 21% / reading 26%, grade F, #2,061 of 2,144 statewide, top 96%, 692 students, 88% FRL); Boynton Beach Community High (math 13% / reading 25%, grade F, #565 of 667 statewide, top 85%, 1,547 students, 65% FRL) — zoned schools average 77% FRL vs 52% district-wide (25 pts higher); higher-poverty schools than district average — tighter screening recommended.
- Zoned-school proficiency averages 21% at this address vs 50% district-wide (-28 pts) — the specific schools serving this property underperform the Palm Beach average; the district grade overstates school quality for this exact location.
- Market conditions: Rents rising (+3.6%/yr); 536 active listings in the ZIP; 28 comparable units currently listed for rent nearby; rentals at typical pace (median 22d on market — plan ~3-4 weeks tenant-placement turnaround); 3,974 units permitted in Palm Beach County in 2024 (1,012 in 5+ unit buildings).
- This rent runs 35% of the median local income ($68k/yr) — at the standard rent-burdened threshold; future hikes will face affordability resistance.
Forward outlook
- Local home prices are declining (-3.0%/yr); year-one equity from $684 of loan paydown is wiped out by about $3k of value loss. Plan a longer hold.
- Palm Beach County population projected at +30% by 2050 — long-run rental-demand tailwind backs the buy-and-hold thesis.
Negotiation context
- It's been on market 46 days — a 3% lower offer ($96k) is reasonable based on typical stale-listing flexibility.
Risks & watch-outs
- Watch-outs: flood insurance adds $427/mo; HOA is 24% of rent.
- Climate carrying-cost: in FEMA flood zone AE (mandatory federal flood insurance); severe wind risk, 99% chance of damaging wind over 30y; extreme-heat days projected 7→29/yr by 2055 (HVAC capex compounding) — expect insurance premiums to compound above CPI over the hold.
Questions for the listing agent
- It's been on market 46 days. Have you received any prior offers? Is the seller open to a 3% concession, seller financing, or rate buy-down credit?
- Built in 1964 — when were the roof, HVAC, electrical panel, plumbing, and water heater last replaced?
- What's the actual annual flood-insurance premium (NFIP or private), and is the property in a SFHA with mandatory coverage?
- What does the HOA fee cover, when was the last increase, and are there any pending special assessments or reserve-fund shortfalls?
- Any open or pending special assessments — roof, HVAC, plumbing, elevator, façade? What's the per-unit balance and payoff schedule, and is the seller paying it off at close or rolling it to the buyer?
- Is there a deadline driving the sale (1031 exchange, divorce, estate, relocation)? That informs how much negotiation room exists.
- Crime grade is D in this area — have there been break-ins, vandalism, or insurance claims at this property in the last 3 years? What carrier currently insures it and at what premium?
- What's the average days-on-market for RENTAL listings here right now (not sales)? A rising rental-DOM trend means longer vacancies and softer asking-rent achievability than the comps imply.
- What's the recent tenant-quality profile in this submarket — average credit score on applications, eviction rate, late-payment / NSF rate, and stable-employment percentage? A property-management company in the area should have these aggregated.
- How much new apartment / multifamily construction is in the pipeline within 1–3 miles? Heavy new supply (>2% of stock underway) typically softens rents 12–24 months out; light construction supports rent growth.
Investment metrics
- 1% rule
- 2.01% ✓
- Cap rate
- 12.44%
- Cash-on-cash
- 21.95%
- DSCR
- 1.98
- GRM
- 4.2
CMA / ARV
No comps found within radius.
Projected returns pro-forma
-3.0% appreciation · 3.64% rent growth · sell at horizon
- IRR
- -8.8%
- Equity multiple
- 0.67×
- Total profit
- $-9,099
- Equity at exit
- $14,761
- IRR
- 2.9%
- Equity multiple
- 1.22×
- Total profit
- $6,163
- Equity at exit
- $8,560
Cash invested: $27,720 (down + closing). Projections, not guarantees.
Landlord ↔ Tenant lean methodology
- Overall (STATE)
- 87 Strongly Landlord-Friendly
- State Florida
- 87 Strongly Landlord-Friendly · R+3
- County
- — inherits STATE
- City
- — inherits STATE
ZIP-level market 33435
- Rents YoY
- 3.6%
- Active inventory
- 536
- Price-to-rent
- 4.2×
Monthly cashflow live
- Estimated rent
- $1,985 high interval (Pro) →
- Mortgage (P&I)
- −$519
- Tax from tax record
- −$27 /mo · $322/yr
- Insurance
- −$41
- Flood insurance flood zone
- −$427 /mo · $5,118/yr
- HOA
- −$474
- Vacancy / Maint / Mgmt
- −$417
- Net cashflow
- $81
Break-even live
UW: 25.0% down · 7.5% · 30yr · 1.5% tax · 5.0% vac · 8.0% maint · 8.0% mgmt
Financing live
Cash to close
- Down payment
- $24,750
- Closing costs
- $2,970
- Reserves months
- —
- Total cash needed
- —
Loan-product check · same deal, 3 products live
Conventional
25% down · 7.5% · 30yr
- Down + closing
- —
- Monthly P&I
- —
- Monthly cashflow
- —
- DSCR
- —
- Eligible?
- —
Personal DTI + credit; lowest rate.
DSCR
20% down · 8.5% · 30yr
- Down + closing
- —
- Monthly P&I
- —
- Monthly cashflow
- —
- DSCR
- —
- Eligible?
- —
No personal income docs; deal must DSCR.
Hard money
10% down · 12.0% · 12mo
- Down + closing
- —
- Monthly P&I
- —
- Monthly cashflow
- —
- DSCR
- —
- Eligible?
- —
Short-term bridge; refi at stabilization.
Rent comps 28 comps
| Address | Beds | Baths | Sqft | Rent | $/sqft | DOM | Units | Dist |
|---|---|---|---|---|---|---|---|---|
| 2412 Tuscany Way Boynton Beach, FL | 1.0 | 1.0 | 750 | $3,000 | $4.00 | 24d | 1 | 0.05mi |
| 1407 Tuscany Way #1407 Boynton Beach, FL | 1.0 | 1.0 | 721 | $2,100 | $2.91 | 3d | 1 | 0.08mi |
| 2303 S Federal Hwy #19 Boynton Beach, FL | 1.0 | 1.0 | 615 | $1,450 | $2.36 | 5d | 1 | 0.11mi |
| 2301 SE 4th St Unit 15 Boynton Beach, FL | 1.0 | 1.0 | 573 | $1,545 | $2.70 | 24d | 1 | 0.18mi |
| 2301 SE 4th St #11 Boynton Beach, FL | 1.0 | 1.0 | 573 | $1,595 | $2.78 | 24d | 1 | 0.18mi |
| 515 SE 20th Ave Boynton Beach, FL | 2.0 | 1.0 | 787 | $1,689 | $2.14 | 8d | 3 | 0.27mi |
| 405 SE 20th Ave Unit 5F Boynton Beach, FL | — | 1.0 | 600 | $1,489 | $2.48 | 22d | 1 | 0.30mi |
| 4603 N Ocean Blvd Unit 1018163P Boynton Beach, FL | 2.0 | 1.0 | 581 | $2,573 | $4.43 | 22d | 1 | 0.35mi |
| 205 Coral Rd Unit 1 Boynton Beach, FL | 1.0 | 1.0 | 500 | $2,300 | $4.60 | 24d | 1 | 0.43mi |
| 22 Oceanview Dr Ocean Ridge, FL | 1.0 | 1.0 | 620 | $3,500 | $5.65 | 24d | 1 | 0.49mi |
| 21 Ruthmary Ave Unit G Briny Breezes, FL | 1.0 | 1.0 | 396 | $2,850 | $7.20 | 24d | 1 | 0.51mi |
| 5505 N Ocean Blvd Ocean Ridge, FL | 1.0–2.0 | 1.0–2.0 | 774 | $1,950 | $2.52 | 11d | 3 | 0.55mi |
| 640 Snug Harbor Dr Unit F3 Boynton Beach, FL | 1.0 | 1.0 | 629 | $2,500 | $3.97 | 11d | 1 | 0.61mi |
| 3851 N Ocean Blvd Gulf Stream, FL | 1.0–2.0 | 1.0 | 677 | $2,900 | $4.28 | 24d | 4 | 0.63mi |
| 638 Snug Harbor Dr Boynton Beach, FL | 1.0–2.0 | 1.0–2.0 | 747 | $1,600 | $2.14 | 24d | 2 | 0.64mi |
| 2861 S Seacrest Blvd Boynton Beach, FL | 1.0 | 1.0 | 710 | $1,680 | $2.37 | 2d | 3 | 0.80mi |
| 1001 S Federal Hwy Unit 3 Boynton Beach, FL | 1.0 | 1.0 | 650 | $1,995 | $3.07 | 24d | 1 | 0.85mi |
| 800 Horizons W #211 Boynton Beach, FL | 1.0 | 1.0 | 570 | $1,650 | $2.89 | 15d | 1 | 0.99mi |
| 850 Horizons E #309 Boynton Beach, FL | 1.0 | 1.5 | 646 | $1,990 | $3.08 | 21d | 1 | 1.00mi |
| 620 Horizons W #207 Boynton Beach, FL | 1.0 | 1.0 | 570 | $1,200 | $2.11 | 24d | 1 | 1.07mi |
| 650 Horizons E #107 Boynton Beach, FL | 1.0 | 1.0 | 570 | $1,600 | $2.81 | 24d | 1 | 1.07mi |
| 207 SE 4th Ave Boynton Beach, FL | 1.0 | 1.0 | 650 | $1,795 | $2.76 | 2d | 1 | 1.18mi |
| 240 Horizons W #108 Boynton Beach, FL | 1.0 | 1.5 | 646 | $1,600 | $2.48 | 24d | 1 | 1.22mi |
| 640 SE 2nd Ave Unit 111 Boynton Beach, FL | 1.0 | 1.0 | 650 | $1,720 | $2.65 | 3d | 1 | 1.28mi |
| 101 S Federal Hwy Boynton Beach, FL | 1.0–2.0 | 1.0–2.0 | 969 | $2,012 | $2.08 | 2d | 17 | 1.31mi |
| 115 SW 1st Ave Boynton Beach, FL | 1.0–2.0 | 1.0–2.0 | 804 | $1,875 | $2.33 | 15d | 2 | 1.39mi |
| 100 NE 6th St Boynton Beach, FL | 1.0 | 1.0 | 745 | $2,975 | $3.99 | 12d | 3 | 1.42mi |
| 100 NE 6th St Boynton Beach, FL | 1.0 | 1.0 | 745 | $2,975 | $3.99 | 20d | 3 | 1.42mi |
HOA detail condo
- Monthly dues
- $474 · $5,688/yr
- Likely covers
- waterpool
- Assessments
- None detected in remarks — confirm with the listing agent.
Listing history 14 events
-
2026-06-18days on market $99,000 Active 46 DOM
-
2026-06-17days on market $99,000 Active 45 DOM
-
2026-06-16days on market $99,000 Active 44 DOM
-
2026-06-15days on market $99,000 Active 43 DOM
-
2026-06-13days on market $99,000 Active 41 DOM
-
2026-06-09days on market $99,000 Active 37 DOM
-
2026-06-08days on market $99,000 Active 36 DOM
-
2026-06-07days on market $99,000 Active 35 DOM
-
2026-06-04days on market $99,000 Active 32 DOM
-
2026-06-03days on market $99,000 Active 31 DOM
-
2026-06-02days on market $99,000 Active 30 DOM
-
2026-06-01days on market $99,000 Active 29 DOM
-
2026-05-31days on market $99,000 Active 28 DOM
-
2026-05-03$99,000 Active
ⓘ Source: listings_history table (triggers on properties + properties_extension) + one-shot
backfill from property_details.listing_events for pre-trigger history.
Tax reassessment forecast FL · Resets to sale price
- Current annual tax
- $322 · $27/mo
- Projected year-2 tax
- $822 · $68/mo
- Expected delta
- +$500/yr (+$42/mo · 155.4%)
ⓘ Screening estimate from a state-policy table — verify with the county assessor before closing.
Climate risk First Street
- Flood 7/10 Severe FEMA zone AE · 74% chance over 30 yrs
- Wildfire 1/10 Low
- Heat 10/10 Extreme 7 d/yr ≥105°F today · 29 d/yr by 30 yrs out
- Wind 10/10 Extreme 99% chance of damaging wind over 30 yrs
- Air quality 2/10 Low 1 unhealthy d/yr today · 2 by 30 yrs out
Nearby sold comps map
Loading sold comps map…
Walkable amenities ~0.75 mi
Loading nearby amenities…
Taxation est. · year 1
- Rental income
- $23,823
- − Mortgage interest
- −$5,546
- − Property taxes
- −$322
- − Insurance
- −$5,614
- − Repairs & maintenance
- −$1,906
- − Management
- −$1,906
- − HOA
- −$5,688
- − Depreciation
- −$2,880
- Taxable loss
- −$37
- Est. tax savings @ 24.0%
- +$9
- After-tax cash flow
- $976/yr
For passive investors: Depreciation is non-cash, so a rental often shows a tax loss while cash-flowing — sheltering income. Rental losses are passive: they offset passive income freely, and up to $25,000/yr can offset ordinary (W-2) income if you actively participate and your MAGI is under $100k (phasing out to $0 by $150k); unused losses carry forward. On sale, claimed depreciation is recaptured at up to 25%, and gains may owe capital-gains tax (a 1031 exchange can defer both). Figures are a year-1 estimate at your 24.0% rate — not tax advice; consult a CPA.
Schools (NCES district)
- District
- Palm Beach
- NCES district ID
- 1201500
- Math proficiency
- 46% ▼ -16.00%
- Reading proficiency
- 53% ▼ -4.00%
- Median HH income
- $53,943
- Composite
- 42.72/100
- National rank
- #3160
- State rank
- #34 of 73 in FL
Livability — Boynton Beach
- Score
- 72/100
- State rank
- #351
- US rank
- #6098
Category grades
Schools grade is shown separately in the Schools card above.
Census & demographics
- Census place
- Boynton Beach, FL
- County
- Palm Beach County · 1,438,312 people
- City population
- 148,060
- Metro
- Miami-Fort Lauderdale-Pompano Beach, FL
- Population (ZIP)
- 37,833
- Household income
- $67,979
- Rent vs Own
- Severe rent burden
- 1623.0
Population outlook (Palm Beach County) Hauer SSP2
- Today (2025)
- 1,637,487 people
- By 2030
- 1,743,255 · +6.5%
- By 2040
- 1,948,712 · +19.0%
- By 2050
- 2,132,979 · +30.3%
- By 2075
- 2,530,027 · +54.5%
- By 2100
- 2,706,979 · +65.3%
Race, ethnicity, and origin ACS 2023
- Neighborhood character
- Diverse neighborhood (Simpson 0.65)
- Race & ethnicity
- White 41% Black 40% Hispanic / Latino 15% Two or more races 10%
- Hispanic origin (detail)
- Mexican 3% Puerto Rican 3% Cuban 2% Dominican 1%
- Common ancestry
- Hispanic 23% Romanian 2% Lithuanian 2%
- Foreign-born
- 30% · Canada, Jamaica
- Languages at home
- 61% English-only · French/Haitian/Cajun 24% Spanish 11% Other Indo-European 2%
Political lean MEDSL · Palm Beach
- 2024 margin
- Toss-up / Even · D 50.0% · R 49.2%
- 2008→2024 swing
- -22.1pp toward R · 2008: 22.9pp · 2024: 0.8pp
- All cycles
- 2024: D+0.8 2020: D+12.8 2016: D+15.3 2012: D+17.0 2008: D+22.9
Not yet ingested
- Civics
- —
Market trends
- HPI YoY
- ▼ -345.86%
- Current HPI
- 371.0527
- Rent YoY
- ▲ 3.64%
- Metro
- Miami-Fort Lauderdale-Pompano Beach, FL
- State GDP YoY
- ▲ 3.28%
- F500 in state
- 36
Industry mix (Fortune 500 HQ in FL)
| Industry | F500 HQs | Revenue |
|---|---|---|
| Industrial Technology | 2 | $29B |
|
||
| Insurance | 2 | $17B |
|
||
| Retail | 1 | $60B |
|
||
| Technology Distribution | 1 | $58B |
|
||
| Homebuilding | 1 | $35B |
|
||
| Technology Manufacturing | 1 | $35B |
|
||
Price history
1 event — show timeline
- 2026-05-03 Listed $99,000 Beaches MLS
Property tax history
+4.0%/yrLatest (2025): $322 · +8.6% YoY. Source: county tax records.
Cash-flow waterfall
monthlySold comps — $/sqft
last 12 mo · ≤1 miLoading sold comps…