 Multi-family
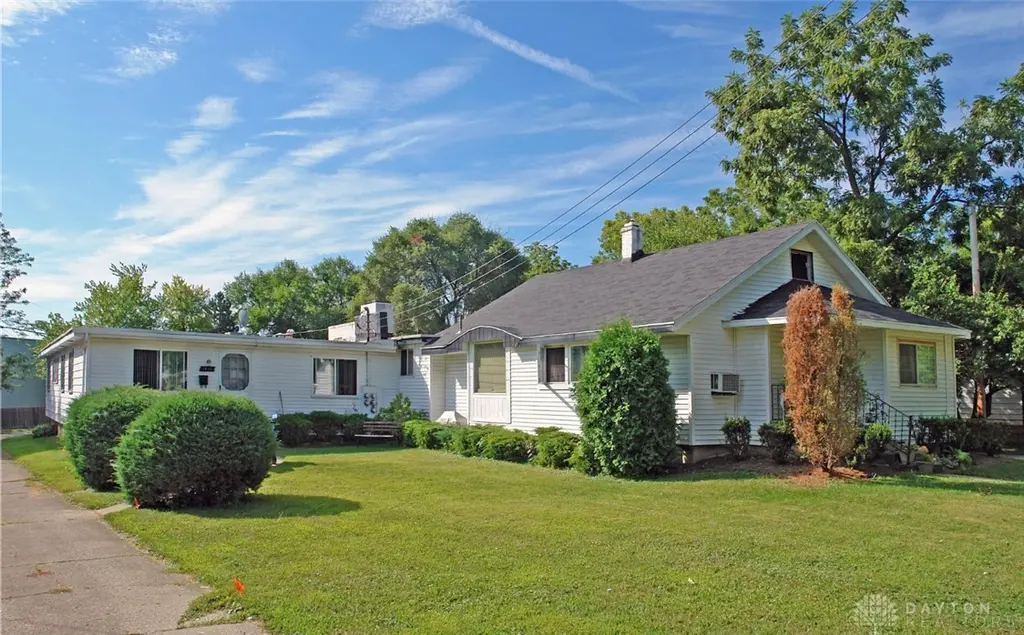
1830 Roslyn Ave · Kettering, OH
Flood risk 1/10 · Minimal
- FEMA flood zone
- X (unshaded)
- Chance of flooding over 30 yrs
- 0.0%
- Est. flood insurance / yr
- $473 – $860
Fire risk 1/10 · Minimal
- Est. fire insurance / yr
- $713 – $1,323
Heat risk 3/10 · Minor
- Hot days now (above 100°F)
- 7 days/yr
- Hot days in 30 yrs
- 18 days/yr
Wind risk 2/10 · Minimal
- Chance of severe wind over 30 yrs
- 0.0%
Air-quality risk 3/10 · Minor
- Unhealthy air days now
- 2 days/yr
- Unhealthy air days in 30 yrs
- 3 days/yr
Risk factors via First Street. Map © Google.
Why this score? — see what drove the C grade
The composite is a weighted blend of 9 inputs, each scored 0–100. Each bar is that input's sub-score; the figure is the points it added to the 100-point composite (weight × sub-score).
- Cash flow +27.6/30.0
- DSCR +9.7/10.0
- 1% rule +7.5/10.0
- Schools +5.2/10.0
- Livability +4.2/5.0
- Rent growth +2.5/5.0
- Condition / age +2.5/5.0
- ARV discount +0.0/15.0
- Appreciation +0.0/10.0
$485,000
🖨 Deal sheet 📄 Offer letter ✓ Due diligence
Multi-family units
County records classify this as Multi-Family (5+ Unit). Listing-text estimate: 1 unit. estimate disagrees with records
5+ unit building — per-unit beds/baths from public records are typically unavailable; the breakdown below (if shown) is an estimate from the listing text.
Listing remarks MLS
Located in the highly desirable area of Kettering close to shopping, dining, and major conveniences. This is a fully occupied 5-unit property presenting an exceptional investment opportunity. The property consists of a charming 2-bedroom single-family home positioned at the front, along with four additional 1-bedroom 1-bath units. Tenant is responsible for electric and gas. Water and trash are billed back monthly. All units are currently leased, providing immediate and consistent cash flow for the next owner. The layout allows for tenant privacy while maximizing rental potential, making it ideal for both seasoned investors and those looking to expand their portfolio. Don’t miss the opportunity to own a turnkey, income-producing property in one of the area’s most sought-after rental markets.
Key facts
- 0.39 acre lot
- Built 1937
- Listed 43 days
Tags
Neighborhood map
What this means for you Summary
Snapshot
- This is a 6-bed/1.0-bath multifamily listed at $485k.
Deal economics
- At list price, monthly cash flow is $1k ($17k/yr) — positive.
- The deal already cash-flows at list — no discount required.
- Meets the 1% rule at list price ($6k rent vs $485k).
- Recommended offer: $470k (3.0% below list) — sets the bar for market timing.
- Cap rate 9.9% vs local median 4.4% in Kettering — top-decile yield for the area; either an underpriced asset or a hidden risk that comps aren't pricing in. Stress-test before assuming the spread holds.
Location & tenants
- Location reads 83/100 on livability (#61 in OH, #922 nationally) — a professional / high-income tenant draw. Strengths: schools A+, crime A+, cost of living A+; Watch: commute F.
- Kettering City School District (suburban): math 54% / reading 68% proficiency, ranked #277 of 656 in OH (top 42%) — acceptable for families but not a draw, mixed tenant base, ~2y average lease.
- Market conditions: 81 active listings in the ZIP; solid renter incomes; 907 units permitted in Montgomery County in 2024 (416 in 5+ unit buildings).
- At $6,051/mo this rent would consume 91% of the median local household income ($80k/yr) (locally 889% of renters already pay >50% of income on rent) — very limited rent-growth headroom before tenants either downsize or default.
Forward outlook
- Local home prices are declining (-3.0%/yr); year-one equity from $3k of loan paydown is wiped out by about $15k of value loss. Plan a longer hold.
- Montgomery County population projected at -10% by 2050 — secular population decline; favor cash flow + early exit over multi-decade hold.
- At projected returns (-3.0% appreciation + 3.0% rent growth), your $136k cash investment doubles in ~9 years — after that, you're playing with house money.
Negotiation context
- It's been on market 43 days — a 3% lower offer ($470k) is reasonable based on typical stale-listing flexibility.
- 3 sale attempts with the ask held roughly flat each time — persistent listings suggest the price (not the market) is what's stuck; bring a comps-based counter.
Risks & watch-outs
- Watch-outs: built in 1937 — expect roof / HVAC / electrical / plumbing capex.
Questions for the listing agent
- It's been on market 43 days. Have you received any prior offers? Is the seller open to a 3% concession, seller financing, or rate buy-down credit?
- Built in 1937 — when were the roof, HVAC, electrical panel, plumbing, and water heater last replaced?
- Is there a deadline driving the sale (1031 exchange, divorce, estate, relocation)? That informs how much negotiation room exists.
- Schools are A-rated — typically a magnet for longer-tenancy family renters. What's the average tenant stay here, and is there a school-zone premium baked into asking?
- What's the average days-on-market for RENTAL listings here right now (not sales)? A rising rental-DOM trend means longer vacancies and softer asking-rent achievability than the comps imply.
- What's the recent tenant-quality profile in this submarket — average credit score on applications, eviction rate, late-payment / NSF rate, and stable-employment percentage? A property-management company in the area should have these aggregated.
- How much new apartment / multifamily construction is in the pipeline within 1–3 miles? Heavy new supply (>2% of stock underway) typically softens rents 12–24 months out; light construction supports rent growth.
Investment metrics
- 1% rule
- 1.25% ✓
- Cap rate
- 9.86%
- Cash-on-cash
- 12.75%
- DSCR
- 1.57
- GRM
- 6.7
CMA / ARV
- ARV (median comp)
- $389,980
- List price
- $485,000
- Delta
- 24.37%
- Verdict
- OVERPRICED
- Comps
- 5 within 1.0 mi
Projected returns pro-forma
-3.0% appreciation · 3.0% rent growth · sell at horizon
- IRR
- 2.6%
- Equity multiple
- 1.10×
- Total profit
- $13,358
- Equity at exit
- $72,315
- IRR
- 12.1%
- Equity multiple
- 1.96×
- Total profit
- $130,261
- Equity at exit
- $41,934
Cash invested: $135,800 (down + closing). Projections, not guarantees.
Landlord ↔ Tenant lean methodology
- Overall (STATE)
- 73 Landlord-Friendly
- State Ohio
- 73 Landlord-Friendly · R+6
- County
- — inherits STATE
- City
- — inherits STATE
ZIP-level market 45429
- Active inventory
- 81
- Price-to-rent
- 29.8×
Monthly cashflow live
- Estimated rent
- $6,051 high interval (Pro) →
- Mortgage (P&I)
- −$2,543
- Tax from tax record
- −$592 /mo · $7,109/yr
- Insurance
- −$202
- HOA
- −$0
- Vacancy / Maint / Mgmt
- −$1,271
- Net cashflow
- $1,442
Break-even live
5-unit breakdown (identical units grouped — click to expand)
| Units | Beds | Baths | Est. rent |
|---|---|---|---|
| 1× unit | 2 | 1 | $1,356 |
| 4× units | 1 | 1 | $4,696 |
| #2 | 1 | 1 | $1,174 |
| #3 | 1 | 1 | $1,174 |
| #4 | 1 | 1 | $1,174 |
| #5 | 1 | 1 | $1,174 |
| Total (5 units) | $6,051 | ||
UW: 25.0% down · 7.5% · 30yr · 1.5% tax · 5.0% vac · 8.0% maint · 8.0% mgmt
Financing live
Cash to close
- Down payment
- $121,250
- Closing costs
- $14,550
- Reserves months
- —
- Total cash needed
- —
Loan-product check · same deal, 3 products live
Conventional
25% down · 7.5% · 30yr
- Down + closing
- —
- Monthly P&I
- —
- Monthly cashflow
- —
- DSCR
- —
- Eligible?
- —
Personal DTI + credit; lowest rate.
DSCR
20% down · 8.5% · 30yr
- Down + closing
- —
- Monthly P&I
- —
- Monthly cashflow
- —
- DSCR
- —
- Eligible?
- —
No personal income docs; deal must DSCR.
Hard money
10% down · 12.0% · 12mo
- Down + closing
- —
- Monthly P&I
- —
- Monthly cashflow
- —
- DSCR
- —
- Eligible?
- —
Short-term bridge; refi at stabilization.
Listing history 23 events
-
2026-06-18days on market $485,000 Active 43 DOM
-
2026-06-17days on market $485,000 Active 42 DOM
-
2026-06-16days on market $485,000 Active 41 DOM
-
2026-06-15days on market $485,000 Active 40 DOM
-
2026-06-14days on market $485,000 Active 38 DOM
-
2026-06-13days on market $485,000 Active 37 DOM
-
2026-06-10days on market $485,000 Active 35 DOM
-
2026-06-09days on market $485,000 Active 34 DOM
-
2026-06-08days on market $485,000 Active 33 DOM
-
2026-06-07days on market $485,000 Active 32 DOM
-
2026-06-05days on market $485,000 Active 29 DOM
-
2026-06-03days on market $485,000 Active 28 DOM
-
2026-06-02days on market $485,000 Active 27 DOM
-
2026-06-01days on market $485,000 Active 26 DOM
-
2026-05-31days on market $485,000 Active 25 DOM
-
2026-05-05$485,000 Active 813-char remark
Show marketing remark (813 chars)
Located in the highly desirable area of Kettering close to shopping, dining, and major conveniences. This is a fully occupied 5-unit property presenting an exceptional investment opportunity. The property consists of a charming 2-bedroom single-family home positioned at the front, along with four additional 1-bedroom 1-bath units. Tenant is responsible for electric and gas. Water and trash are billed back monthly. All units are currently leased, providing immediate and consistent cash flow for the next owner. The layout allows for tenant privacy while maximizing rental potential, making it ideal for both seasoned investors and those looking to expand their portfolio. Don’t miss the opportunity to own a turnkey, income-producing property in one of the area’s most sought-after rental markets.
-
2026-01-17historical $895
-
2025-12-20$895
-
2025-05-05historical $895
-
2025-05-01$895
-
2024-10-22soldstatus $425,000
-
2021-07-08soldstatus $153,333
-
2005-03-10soldstatus $157,500
ⓘ Source: listings_history table (triggers on properties + properties_extension) + one-shot
backfill from property_details.listing_events for pre-trigger history.
Tax reassessment forecast OH · Partial reset (capped growth)
- Current annual tax
- $7,109 · $592/mo
- Projected year-2 tax
- $7,338 · $611/mo
- Expected delta
- +$228/yr (+$19/mo · 3.2%)
ⓘ Screening estimate from a state-policy table — verify with the county assessor before closing.
Climate risk First Street
- Flood 1/10 Low FEMA zone X (unshaded) · 0% chance over 30 yrs
- Wildfire 1/10 Low
- Heat 3/10 Moderate 7 d/yr ≥100°F today · 18 d/yr by 30 yrs out
- Wind 2/10 Low 0% chance of damaging wind over 30 yrs
- Air quality 3/10 Moderate 2 unhealthy d/yr today · 3 by 30 yrs out
Nearby sold comps map
Loading sold comps map…
Walkable amenities ~0.75 mi
Loading nearby amenities…
Taxation est. · year 1
- Rental income
- $72,612
- − Mortgage interest
- −$27,168
- − Property taxes
- −$7,109
- − Insurance
- −$2,425
- − Repairs & maintenance
- −$5,809
- − Management
- −$5,809
- − Depreciation
- −$14,109
- Taxable income
- $10,183
- Est. tax owed @ 24.0%
- −$2,444
- After-tax cash flow
- $14,865/yr
For passive investors: Depreciation is non-cash, so a rental often shows a tax loss while cash-flowing — sheltering income. Rental losses are passive: they offset passive income freely, and up to $25,000/yr can offset ordinary (W-2) income if you actively participate and your MAGI is under $100k (phasing out to $0 by $150k); unused losses carry forward. On sale, claimed depreciation is recaptured at up to 25%, and gains may owe capital-gains tax (a 1031 exchange can defer both). Figures are a year-1 estimate at your 24.0% rate — not tax advice; consult a CPA.
Schools (NCES district)
- District
- Kettering City School District
- NCES district ID
- 3904418
- Math proficiency
- 54% ▼ -21.00%
- Reading proficiency
- 68% ▼ -9.00%
- Median HH income
- $50,353
- Composite
- 51.89/100
- National rank
- #1653
- State rank
- #277 of 656 in OH
Livability — Kettering
- Score
- 83/100
- State rank
- #61
- US rank
- #922
Category grades
Schools grade is shown separately in the Schools card above.
Census & demographics
- Census place
- Kettering, OH
- County
- Montgomery County · 459,541 people
- City population
- 73,116
- Metro
- Dayton-Kettering, OH
- Population (ZIP)
- 26,347
- Household income
- $80,210
- Rent vs Own
- Severe rent burden
- 889.0
Population outlook (Montgomery County) Hauer SSP2
- Today (2025)
- 523,241 people
- By 2030
- 514,948 · -1.6%
- By 2040
- 493,378 · -5.7%
- By 2050
- 469,639 · -10.2%
- By 2075
- 418,360 · -20.0%
- By 2100
- 353,315 · -32.5%
Race, ethnicity, and origin ACS 2023
- Neighborhood character
- Predominantly White (86%)
- Race & ethnicity
- White 86% Two or more races 5% Black 5% Hispanic / Latino 3% Asian 2%
- Common ancestry
- Italian 3% Lithuanian 3% Slovak 2%
- Foreign-born
- 5% · Canada, China
- Languages at home
- 95% English-only · Spanish 2% Arabic 1%
Political lean MEDSL · Montgomery
- 2024 margin
- Toss-up / Even · D 49.8% · R 49.3%
- 2008→2024 swing
- -5.8pp toward R · 2008: 6.2pp · 2024: 0.5pp
- All cycles
- 2024: D+0.5 2020: D+2.2 2016: R+1.2 2012: D+3.1 2008: D+6.2
Not yet ingested
- Civics
- —
Market trends
- HPI YoY
- ▼ -172.24%
- Current HPI
- 274.1505
- Rent YoY
- —
- Metro
- Dayton-Kettering, OH
- State GDP YoY
- ▲ 1.98%
- F500 in state
- 48
Industry mix (Fortune 500 HQ in OH)
| Industry | F500 HQs | Revenue |
|---|---|---|
| Insurance | 3 | $145B |
|
||
| Industrial Machinery | 3 | $49B |
|
||
| Financial Services | 3 | $24B |
|
||
| Consumer Goods | 2 | $93B |
|
||
| Aerospace / Defense | 2 | $47B |
|
||
| Utilities | 2 | $33B |
|
||
Price history
+207.9% since first listed8 events — show timeline
- 2026-05-05 Listed $485,000 Dayton MLS
- 2026-01-17 Rental Removed $895 TENANTTURNER2
- 2025-12-20 Listed for Rent $895 TENANTTURNER2
- 2025-05-05 Rental Removed $895 TENANTTURNER2
- 2025-05-01 Listed for Rent $895 TENANTTURNER2
- 2024-10-22 Sold (Public Records) $425,000 Public Records
- 2021-07-08 Sold (Public Records) $153,333 Public Records
- 2005-03-10 Sold (Public Records) $157,500 Public Records
Property tax history
+8.4%/yrLatest (2025): $7,109 · +4.2% YoY. Source: county tax records.
Cash-flow waterfall
monthlySold comps — $/sqft
last 12 mo · ≤1 miLoading sold comps…