36 Maple Leaf Ct · Palm Harbor, FL
Flood risk 1/10 · Minimal
- FEMA flood zone
- X (unshaded)
- Chance of flooding over 30 yrs
- 0.0%
- Est. flood insurance / yr
- $507 – $1,088
Fire risk 1/10 · Minimal
- Est. fire insurance / yr
- $947 – $1,759
Heat risk 10/10 · Severe
- Hot days now (above 107°F)
- 6 days/yr
- Hot days in 30 yrs
- 22 days/yr
Wind risk 10/10 · Severe
- Chance of severe wind over 30 yrs
- 99.0%
Air-quality risk 3/10 · Minor
- Unhealthy air days now
- 2 days/yr
- Unhealthy air days in 30 yrs
- 2 days/yr
Risk factors via First Street. Map © Google.
Why this score? — see what drove the B+ grade
The composite is a weighted blend of 9 inputs, each scored 0–100. Each bar is that input's sub-score; the figure is the points it added to the 100-point composite (weight × sub-score).
- Cash flow +30.0/30.0
- ARV discount +15.0/15.0
- 1% rule +10.0/10.0
- DSCR +10.0/10.0
- Schools +4.3/10.0
- Livability +4.0/5.0
- Condition / age +2.5/5.0
- Rent growth +1.2/5.0
- Appreciation +0.0/10.0
$105,000
🖨 Deal sheet 📄 Offer letter ✓ Due diligence
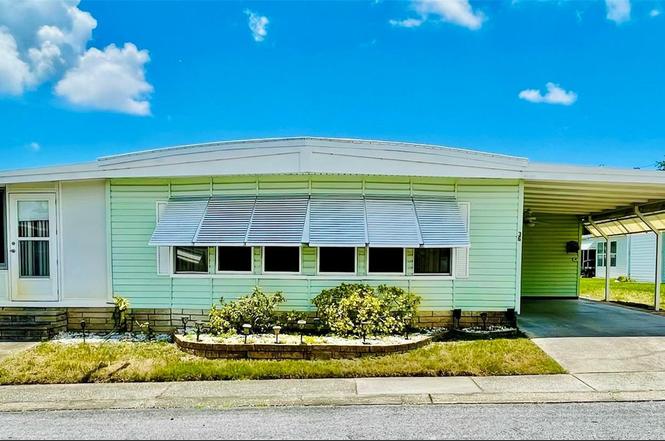
Listing remarks
Handyman special with great potential and has recently completed several improvements including a new roof over with transferrable warranty, removal of carpets, and repairs to soft flooring. This 2-bedroom, 2-bath double-wide manufactured home is located in Blue Jay Estates, a desirable 55+ active community where you OWN your land and is situated in a non-flood zone. Nestled on a quiet cul-de-sac, this home is ready for renovation. Attractive landscaping and decorative shutters provide great curb appeal. Inside, you’ll find newer windows and appliances creating a solid foundation for updating. The side porch adds approximately 180 sq. ft. of additional living space and includes a port
Key facts
- Extended carport
- Newer appliances
- Newer windows
Tags
Property features AI
Finance
- Other: Lease restrictions apply; Total annual fees $2,760
- HOA & community: Has HOA (Resource Property Management); Monthly association fee $230; Association amenities: Clubhouse, pool, shuffleboard court; Association fee covers: Common area taxes, pool, escrow reserves, private road, sewer, trash, water; Association approval required; Community features: Deed restrictions, sidewalks, street lights, association recreation owned, buyer approval required, golf carts allowed; Senior community; Pets allowed (cats and dogs) with limits — max pet weight 15 lbs
Exterior
- Parking: Carport with 2 spaces
- Utilities: Public water; Public sewer; Electricity connected; Sewer connected; Water connected; Fire hydrant; Sprinkler well
- Home design: Manufactured home (double wide); Single-story; Faces east; Entry level: One
- Construction: Vinyl siding; Other roof; Crawlspace foundation; Completed condition; Built as double wide
- Exterior features: Enclosed patio/porch; Side porch; Sidewalk; Shed(s); Private lot; Paved road
Interior
- Kitchen: Range; Microwave; Refrigerator
- Bedrooms: 2 bedrooms
- Flooring: Carpet; Laminate
- Bathrooms: 2 full bathrooms
- Heating & cooling: Central heating; Central air
- Interior features: Ceiling fans; Walk-in closet(s); Window treatments
- Laundry & utility: Washer; Dryer; Irrigation equipment
Neighborhood map
What this means for you Summary
Snapshot
- This is a 2-bed/2.0-bath manufactured listed at $105k.
Deal economics
- At list price, monthly cash flow is $658 ($8k/yr) — positive.
- The deal already cash-flows at list — no discount required.
- Meets the 1% rule at list price ($2k rent vs $105k).
- Recommended offer: $92k (12.0% below list) — sets the bar for market timing.
- Cap rate 13.8% vs local median 3.1% in Palm Harbor — top-decile yield for the area; either an underpriced asset or a hidden risk that comps aren't pricing in. Stress-test before assuming the spread holds.
Location & tenants
- Location reads 81/100 on livability (#95 in FL, #1,470 nationally) — a professional / high-income tenant draw. Strengths: schools A+, housing A+, commute A; Watch: amenities F.
- Pinellas (suburban): math 51% / reading 51% proficiency, ranked #31 of 73 in FL (top 42%) — acceptable for families but not a draw, mixed tenant base, ~2y average lease.
- Market conditions: Rents falling (-5.2%/yr); 371 active listings in the ZIP; 37 comparable units currently listed for rent nearby; rentals at typical pace (median 18d on market — plan ~3-4 weeks tenant-placement turnaround); 2,676 units permitted in Pinellas County in 2024 (1,422 in 5+ unit buildings).
- This rent runs 32% of the median local income ($72k/yr) — at the standard rent-burdened threshold; future hikes will face affordability resistance.
Forward outlook
- Local home prices are declining (-3.0%/yr); year-one equity from $726 of loan paydown is wiped out by about $3k of value loss. Plan a longer hold.
- Pinellas County population projected at +14% by 2050 — modest demand growth; plan on rents tracking national, not racing it.
- At projected returns (-3.0% appreciation + 0.0% rent growth), your $29k cash investment doubles in ~6 years — after that, you're playing with house money.
Negotiation context
- It's been on market 154 days — a 12% lower offer ($92k) is reasonable based on typical stale-listing flexibility.
- Current owner paid $67k; list at $105k implies a 57% gain — meaningful room to come down on a strong offer.
Risks & watch-outs
- Climate carrying-cost: severe wind risk, 99% chance of damaging wind over 30y; extreme-heat days projected 6→22/yr by 2055 (HVAC capex compounding) — expect insurance premiums to compound above CPI over the hold.
Questions for the listing agent
- It's been on market 154 days. Have you received any prior offers? Is the seller open to a 12% concession, seller financing, or rate buy-down credit?
- Built in 1979 — when were the roof, HVAC, electrical panel, plumbing, and water heater last replaced?
- What does the HOA fee cover, when was the last increase, and are there any pending special assessments or reserve-fund shortfalls?
- Why hasn't it sold? Are there any deal-killer items the seller is aware of (foundation, flood, title, zoning, code violations)?
- Is there a deadline driving the sale (1031 exchange, divorce, estate, relocation)? That informs how much negotiation room exists.
- Schools are A-rated — typically a magnet for longer-tenancy family renters. What's the average tenant stay here, and is there a school-zone premium baked into asking?
- What's the average days-on-market for RENTAL listings here right now (not sales)? A rising rental-DOM trend means longer vacancies and softer asking-rent achievability than the comps imply.
- What's the recent tenant-quality profile in this submarket — average credit score on applications, eviction rate, late-payment / NSF rate, and stable-employment percentage? A property-management company in the area should have these aggregated.
- How much new for-sale + rental construction is in the pipeline within 1–3 miles? Heavy new supply typically softens prices + rents 12–24 months out; constrained supply supports both.
Investment metrics
- 1% rule
- 1.85% ✓
- Cap rate
- 13.82%
- Cash-on-cash
- 26.87%
- DSCR
- 2.20
- GRM
- 4.5
CMA / ARV
- ARV (on-the-fly)
- $138,240
- Comps found
- 6
Show comp detail 6 sales within ~0.75 mi
| Address | Dist | Beds/Ba | Sqft | Sold | Price | $/sf | Match |
|---|---|---|---|---|---|---|---|
| 159 Hickory Gate Dr | 0.14mi | 2/2.0 | 984 (+2%) | 2mo | $106,000 | $108 | 88 |
| 177 Hickory Gate Dr | 0.15mi | 2/2.0 | 974 (+2%) | 8mo | $129,000 | $132 | 84 |
| 61 Tanglewood Dr | 0.15mi | 2/2.0 | 864 (-10%) | 2mo | $169,000 | $196 | 75 |
| 204 Red Maple Dr | 0.17mi | 2/2.0 | 856 (-11%) | 1mo | $123,000 | $144 | 73 |
| 90 Red Oak Dr | 0.21mi | 2/2.0 | 864 (-10%) | 6mo | $105,000 | $122 | 68 |
| 70 Tanglewood Dr | 0.18mi | 2/2.0 | 864 (-10%) | 17mo | $185,000 | $214 | 60 |
Match score weights: distance 35% · size 25% · config 20% · recency 20%. Top-matched comps best support the ARV.
Projected returns pro-forma
-3.0% appreciation · 0.0% rent growth · sell at horizon
- IRR
- 17.0%
- Equity multiple
- 1.66×
- Total profit
- $19,338
- Equity at exit
- $15,656
- IRR
- 23.0%
- Equity multiple
- 2.68×
- Total profit
- $49,305
- Equity at exit
- $9,078
Cash invested: $29,400 (down + closing). Projections, not guarantees.
Landlord ↔ Tenant lean methodology
- Overall (STATE)
- 87 Strongly Landlord-Friendly
- State Florida
- 87 Strongly Landlord-Friendly · R+3
- County
- — inherits STATE
- City
- — inherits STATE
ZIP-level market 34684
- Rents YoY
- -5.2%
- Active inventory
- 371
- Price-to-rent
- 4.5×
Monthly cashflow live
- Estimated rent
- $1,945 high interval (Pro) →
- Mortgage (P&I)
- −$551
- Tax from tax record
- −$54 /mo · $643/yr
- Insurance
- −$44
- HOA
- −$230
- Vacancy / Maint / Mgmt
- −$408
- Net cashflow
- $658
Break-even live
UW: 25.0% down · 7.5% · 30yr · 1.5% tax · 5.0% vac · 8.0% maint · 8.0% mgmt
Financing live
Cash to close
- Down payment
- $26,250
- Closing costs
- $3,150
- Reserves months
- —
- Total cash needed
- —
Loan-product check · same deal, 3 products live
Conventional
25% down · 7.5% · 30yr
- Down + closing
- —
- Monthly P&I
- —
- Monthly cashflow
- —
- DSCR
- —
- Eligible?
- —
Personal DTI + credit; lowest rate.
DSCR
20% down · 8.5% · 30yr
- Down + closing
- —
- Monthly P&I
- —
- Monthly cashflow
- —
- DSCR
- —
- Eligible?
- —
No personal income docs; deal must DSCR.
Hard money
10% down · 12.0% · 12mo
- Down + closing
- —
- Monthly P&I
- —
- Monthly cashflow
- —
- DSCR
- —
- Eligible?
- —
Short-term bridge; refi at stabilization.
Rent comps 37 comps
| Address | Beds | Baths | Sqft | Rent | $/sqft | DOM | Units | Dist |
|---|---|---|---|---|---|---|---|---|
| 3610 Sammy Ct Palm Harbor, FL | 2.0 | 1.0 | 797 | $2,000 | $2.51 | 4d | 1 | 0.18mi |
| 3583 Whispering Oaks Ln Palm Harbor, FL | 2.0 | 2.5 | 1124 | $1,800 | $1.60 | 24d | 1 | 0.30mi |
| 3590 Magnolia Ridge Cir Unit G Palm Harbor, FL | 2.0 | 2.0 | 1090 | $1,695 | $1.56 | 24d | 1 | 0.36mi |
| 2682 Rachel Ct Palm Harbor, FL | 1.0 | 1.0 | 700 | $1,400 | $2.00 | 2d | 1 | 0.39mi |
| 3726 Albion Ct Palm Harbor, FL | 3.0 | 2.0 | 1060 | $2,350 | $2.22 | 13d | 1 | 0.40mi |
| 3726 Albion Ct Palm Harbor, FL | 3.0 | 2.0 | 1060 | $2,350 | $2.22 | 13d | 1 | 0.40mi |
| 2678 Markham Ct Palm Harbor, FL | 2.0 | 2.0 | 923 | $1,999 | $2.17 | 24d | 1 | 0.42mi |
| 3455 Countryside Blvd #4 Clearwater, FL | 3.0 | 2.0 | 995 | $2,050 | $2.06 | 4d | 1 | 0.51mi |
| 3781 Lake Shore Dr Palm Harbor, FL | 3.0 | 2.0 | 1055 | $2,500 | $2.37 | 24d | 1 | 0.52mi |
| 2764 Kavalier Dr Palm Harbor, FL | 3.0 | 2.0 | 1088 | $2,300 | $2.11 | 24d | 1 | 0.62mi |
| 2764 Kavalier Dr Palm Harbor, FL | 3.0 | 2.0 | 1088 | $2,300 | $2.11 | 14d | 1 | 0.62mi |
| 2764 Kavalier Dr Palm Harbor, FL | 3.0 | 2.0 | 1088 | $2,300 | $2.11 | 17d | 1 | 0.62mi |
| 2803 Northcote Dr Palm Harbor, FL | 3.0 | 2.0 | 1050 | $2,300 | $2.19 | 21d | 1 | 0.71mi |
| 3028 Bonaventure Cir #103 Palm Harbor, FL | 2.0 | 2.0 | 900 | $1,500 | $1.67 | 24d | 1 | 0.75mi |
| 3975 Country Place Ln Palm Harbor, FL | 1.0–2.0 | 1.0–2.0 | 788 | $1,637 | $2.08 | 1d | 16 | 0.86mi |
| 2998 Bonaventure Cir #104 Palm Harbor, FL | 2.0 | 2.0 | 900 | $1,828 | $2.03 | 4d | 1 | 0.87mi |
| 220 Calibre Downs Ln Palm Harbor, FL | 1.0–2.0 | 1.0–2.5 | 1052 | $2,299 | $2.19 | 24d | 13 | 0.88mi |
| 414 Meadow Ln Oldsmar, FL | 1.0 | 1.0 | 700 | $1,450 | $2.07 | 24d | 1 | 1.21mi |
| 114 Meadow Ln #114 Oldsmar, FL | 2.0 | 2.0 | 879 | $1,700 | $1.93 | 24d | 1 | 1.25mi |
| 107 Windward Pl Unit 107 Oldsmar, FL | 2.0 | 2.0 | 879 | $2,000 | $2.28 | 17d | 1 | 1.27mi |
| 31790 US Highway 19 N Palm Harbor, FL | 1.0–2.0 | 1.0–2.0 | 842 | $2,066 | $2.45 | 11d | 16 | 1.30mi |
| 161 Lakeside Dr Oldsmar, FL | 2.0 | 2.0 | 1094 | $2,000 | $1.83 | 17d | 1 | 1.31mi |
| 225 Tarpon Ln Oldsmar, FL | 2.0 | 2.0 | 1120 | $2,400 | $2.14 | 4d | 1 | 1.31mi |
| 1350 Seagate Dr Palm Harbor, FL | 1.0–4.0 | 1.0–2.0 | 1044 | $1,913 | $1.83 | 1d | 19 | 1.33mi |
| 212 Katherine Blvd Palm Harbor, FL | 1.0–4.0 | 1.0–2.5 | 1164 | $1,775 | $1.52 | 1d | 15 | 1.34mi |
| 103 Palmetto Ct #103 Oldsmar, FL | 2.0 | 2.0 | 1054 | $1,800 | $1.71 | 24d | 1 | 1.34mi |
| 109 Pine Ct Oldsmar, FL | 2.0 | 2.0 | 1054 | $2,300 | $2.18 | 24d | 1 | 1.34mi |
| 207 Palmetto Ct Oldsmar, FL | 2.0 | 2.0 | 1054 | $1,700 | $1.61 | 24d | 1 | 1.34mi |
| 3462 Maclaren Dr Palm Harbor, FL | 2.0 | 2.0 | 1076 | $2,150 | $2.00 | 7d | 1 | 1.44mi |
| 2500 Winding Creek Blvd Unit C205 Clearwater, FL | 2.0 | 2.0 | 946 | $1,700 | $1.80 | 4d | 1 | 1.45mi |
| 132 E Cypress Ct Oldsmar, FL | 2.0 | 2.0 | 1054 | $1,800 | $1.71 | 19d | 1 | 1.45mi |
| 274 Cypress Ln Oldsmar, FL | 2.0 | 2.0 | 1054 | $1,600 | $1.52 | 24d | 1 | 1.45mi |
| 135 W Cypress Ct Oldsmar, FL | 2.0 | 2.0 | 1054 | $2,100 | $1.99 | 24d | 1 | 1.45mi |
| 2500 Winding Creek Blvd Clearwater, FL | 1.0–2.0 | 1.0–2.0 | 812 | $1,700 | $2.09 | 1d | 3 | 1.46mi |
| 2500 Winding Creek Blvd Clearwater, FL | 2.0 | 2.0 | 946 | $1,675 | $1.77 | 2d | 2 | 1.46mi |
| 1 Pelican Dr N Oldsmar, FL | 2.0 | 2.0 | 960 | $2,000 | $2.08 | 10d | 1 | 1.47mi |
| 36 Magnolia Ct #4 Safety Harbor, FL | 2.0 | 2.0 | 864 | $1,450 | $1.68 | 17d | 1 | 1.49mi |
HOA detail
- Monthly dues
- $230 · $2,760/yr
- Likely covers
- landscaping
Listing history 16 events
-
2026-06-18days on market $105,000 Active 154 DOM
-
2026-06-17days on market $105,000 Active 153 DOM
-
2026-06-16days on market $105,000 Active 152 DOM
-
2026-06-15days on market $105,000 Active 151 DOM
-
2026-06-13days on market $105,000 Active 149 DOM
-
2026-06-09days on market $105,000 Active 145 DOM
-
2026-06-08days on market $105,000 Active 144 DOM
-
2026-06-07days on market $105,000 Active 143 DOM
-
2026-06-04days on market $105,000 Active 140 DOM
-
2026-06-03days on market $105,000 Active 139 DOM
-
2026-06-01days on market $105,000 Active 137 DOM
-
2026-05-31days on market $105,000 Active 136 DOM
-
2026-04-14price $105,000
-
2026-01-15$125,000 Active
-
2003-05-23soldstatus $67,000
-
1991-01-18soldstatus $50,000
ⓘ Source: listings_history table (triggers on properties + properties_extension) + one-shot
backfill from property_details.listing_events for pre-trigger history.
Tax reassessment forecast FL · Resets to sale price
- Current annual tax
- $643 · $54/mo
- Projected year-2 tax
- $872 · $73/mo
- Expected delta
- +$228/yr (+$19/mo · 35.4%)
ⓘ Screening estimate from a state-policy table — verify with the county assessor before closing.
Climate risk First Street
- Flood 1/10 Low FEMA zone X (unshaded) · 0% chance over 30 yrs
- Wildfire 1/10 Low
- Heat 10/10 Extreme 6 d/yr ≥107°F today · 22 d/yr by 30 yrs out
- Wind 10/10 Extreme 99% chance of damaging wind over 30 yrs
- Air quality 3/10 Moderate 2 unhealthy d/yr today · 2 by 30 yrs out
Nearby sold comps map
Loading sold comps map…
Walkable amenities ~0.75 mi
Loading nearby amenities…
Taxation est. · year 1
- Rental income
- $23,337
- − Mortgage interest
- −$5,882
- − Property taxes
- −$643
- − Insurance
- −$525
- − Repairs & maintenance
- −$1,867
- − Management
- −$1,867
- − HOA
- −$2,760
- − Depreciation
- −$3,055
- Taxable income
- $6,738
- Est. tax owed @ 24.0%
- −$1,617
- After-tax cash flow
- $6,283/yr
For passive investors: Depreciation is non-cash, so a rental often shows a tax loss while cash-flowing — sheltering income. Rental losses are passive: they offset passive income freely, and up to $25,000/yr can offset ordinary (W-2) income if you actively participate and your MAGI is under $100k (phasing out to $0 by $150k); unused losses carry forward. On sale, claimed depreciation is recaptured at up to 25%, and gains may owe capital-gains tax (a 1031 exchange can defer both). Figures are a year-1 estimate at your 24.0% rate — not tax advice; consult a CPA.
Schools (NCES district)
- District
- Pinellas
- NCES district ID
- 1201560
- Math proficiency
- 51% ▼ -5.00%
- Reading proficiency
- 51% ▼ -3.00%
- Median HH income
- $46,270
- Composite
- 43.27/100
- National rank
- #3046
- State rank
- #31 of 73 in FL
Livability — Palm Harbor
- Score
- 81/100
- State rank
- #95
- US rank
- #1470
Category grades
Schools grade is shown separately in the Schools card above.
Census & demographics
- Census place
- Palm Harbor, FL
- County
- Pinellas County · 939,478 people
- City population
- 79,072
- Metro
- Tampa-St. Petersburg-Clearwater, FL
- Population (ZIP)
- 27,029
- Household income
- $72,145
- Rent vs Own
- Severe rent burden
- 1495.0
Population outlook (Pinellas County) Hauer SSP2
- Today (2025)
- 1,027,532 people
- By 2030
- 1,063,586 · +3.5%
- By 2040
- 1,125,020 · +9.5%
- By 2050
- 1,168,637 · +13.7%
- By 2075
- 1,265,188 · +23.1%
- By 2100
- 1,260,357 · +22.7%
Race, ethnicity, and origin ACS 2023
- Neighborhood character
- Predominantly White (81%)
- Race & ethnicity
- White 81% Hispanic / Latino 10% Two or more races 8% Asian 4% Black 3%
- Hispanic origin (detail)
- Puerto Rican 2% Cuban 2%
- Common ancestry
- Lithuanian 5% Romanian 5% Scotch-Irish 3%
- Foreign-born
- 13% · Canada, Jamaica, China
- Languages at home
- 84% English-only · Spanish 6% Russian/Polish/Slavic 3% Other Indo-European 2%
Political lean MEDSL · Pinellas
- 2024 margin
- Lean R (+5.2) · D 46.9% · R 52.1%
- 2008→2024 swing
- -13.5pp toward R · 2008: 8.3pp · 2024: -5.2pp
- All cycles
- 2024: R+5.2 2020: D+0.2 2016: R+1.1 2012: D+5.6 2008: D+8.3
Not yet ingested
- Civics
- —
Market trends
- HPI YoY
- ▼ -296.23%
- Current HPI
- 301.651
- Rent YoY
- ▼ -5.17%
- Metro
- Tampa-St. Petersburg-Clearwater, FL
- State GDP YoY
- ▲ 3.28%
- F500 in state
- 36
Industry mix (Fortune 500 HQ in FL)
| Industry | F500 HQs | Revenue |
|---|---|---|
| Industrial Technology | 2 | $29B |
|
||
| Insurance | 2 | $17B |
|
||
| Retail | 1 | $60B |
|
||
| Technology Distribution | 1 | $58B |
|
||
| Homebuilding | 1 | $35B |
|
||
| Technology Manufacturing | 1 | $35B |
|
||
Price history
+110.0% since first listed4 events — show timeline
- 2026-04-14 Price Changed $105,000 Stellar MLS as Distributed by MLS Grid
- 2026-01-15 Listed $125,000 Stellar MLS as Distributed by MLS Grid
- 2003-05-23 Sold (Public Records) $67,000 Public Records
- 1991-01-18 Sold (Public Records) $50,000 Public Records
Property tax history
-3.1%/yrLatest (2025): $643 · +5.4% YoY. Source: county tax records.
Cash-flow waterfall
monthlySold comps — $/sqft
last 12 mo · ≤1 miLoading sold comps…