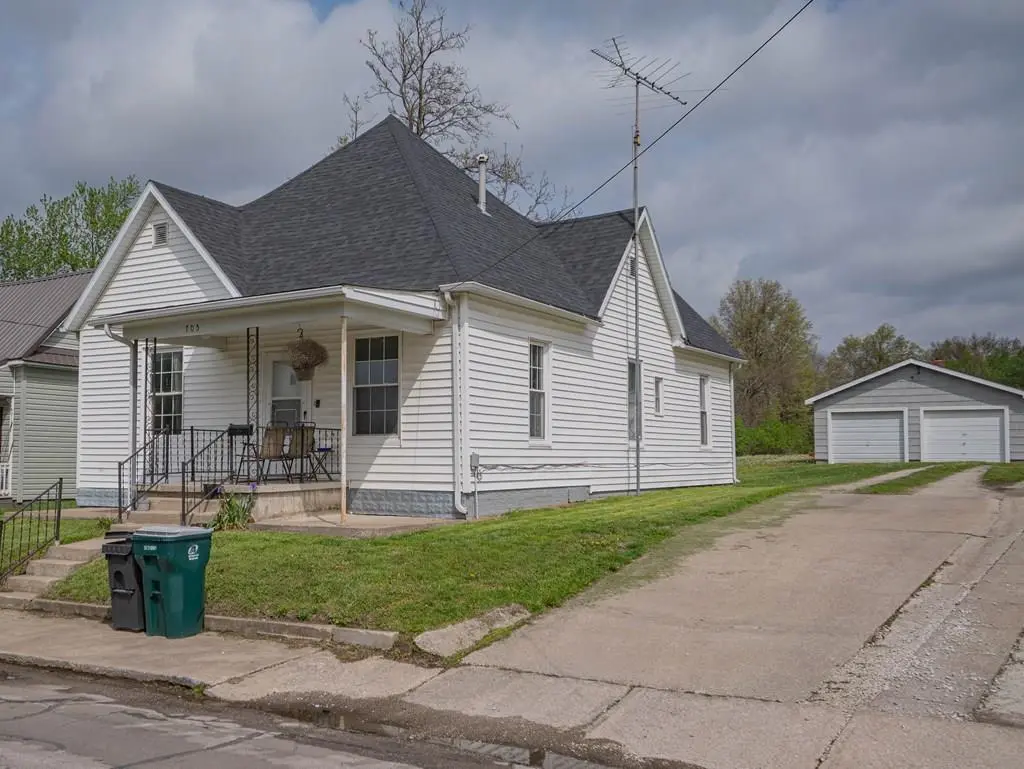
705 Franklin Ave · Moberly, MO
Flood risk 1/10 · Minimal
- FEMA flood zone
- X (unshaded)
- Chance of flooding over 30 yrs
- 0.0%
- Est. flood insurance / yr
- $507 – $1,088
Fire risk 3/10 · Minor
- Est. fire insurance / yr
- $1,054 – $1,958
Heat risk 4/10 · Minor
- Hot days now (above 107°F)
- 7 days/yr
- Hot days in 30 yrs
- 17 days/yr
Wind risk 2/10 · Minimal
- Chance of severe wind over 30 yrs
- —
Air-quality risk 1/10 · Minimal
- Unhealthy air days now
- 0 days/yr
- Unhealthy air days in 30 yrs
- 0 days/yr
Risk factors via First Street. Map © Google.
Why this score? — see what drove the C- grade
The composite is a weighted blend of 9 inputs, each scored 0–100. Each bar is that input's sub-score; the figure is the points it added to the 100-point composite (weight × sub-score).
- Cash flow +22.1/30.0
- ARV discount +9.1/15.0
- DSCR +7.1/10.0
- 1% rule +4.7/10.0
- Livability +3.9/5.0
- Schools +2.7/10.0
- Rent growth +2.5/5.0
- Condition / age +2.5/5.0
- Appreciation +0.0/10.0
$127,000
🖨 Deal sheet 📄 Offer letter ✓ Due diligence
Listing remarks MLS
Check out this 2 bedroom home that's completely move-in ready that has not one, but two garages and is situated on almost acre lot in town! Neutral colors, modern lighting, updated bathroom. Modern appliances can stay. Newer roof, plumbing, electrical, windows, siding and more! Should qualify for most loan types.
Key facts
- 0.35 acre lot
- 2 garage spots
- Built 1920
Neighborhood map
What this means for you Summary
Snapshot
- This is a 2-bed/1.0-bath single-family listed at $127k.
Deal economics
- At list price, monthly cash flow is $206 ($2k/yr) — positive.
- The deal already cash-flows at list — no discount required.
- To meet the 1% rule (rent ≥ 1% of price), the offer needs to be $124k (2.7% below list).
- Recommended offer: $124k (2.7% below list) — sets the bar for 1% rule.
- Cap rate 8.2% vs local median 4.5% in Moberly — top-decile yield for the area; either an underpriced asset or a hidden risk that comps aren't pricing in. Stress-test before assuming the spread holds.
Location & tenants
- Location reads 77/100 on livability (#32 in MO, #3,045 nationally) — a middle-class / working-renter tenant base. Strengths: cost of living A+, housing A+, health & safety A+; Watch: employment D, schools D-, amenities F.
- Moberly (town): math 30% / reading 36% proficiency, ranked #246 of 324 in MO (top 76%) — families likely to look elsewhere, expect single-tenant / working-renter base with shorter leases.
- Market conditions: 134 active listings in the ZIP; 25 units permitted in Randolph County in 2024 (0 in 5+ unit buildings).
Forward outlook
- Local home prices are declining (-3.0%/yr); year-one equity from $878 of loan paydown is wiped out by about $4k of value loss. Plan a longer hold.
- Randolph County population projected at -10% by 2050 — secular population decline; favor cash flow + early exit over multi-decade hold.
Negotiation context
- It's been on market 22 days — a 2% lower offer ($125k) is reasonable based on typical stale-listing flexibility.
- 6 sale attempts since 3y ago with the ask held roughly flat each time — persistent listings suggest the price (not the market) is what's stuck; bring a comps-based counter.
- Current owner paid $89k; 43% above their basis — modest negotiation headroom, anchor on the comps not their cost.
Risks & watch-outs
- Watch-outs: built in 1920 — expect roof / HVAC / electrical / plumbing capex.
Questions for the listing agent
- Built in 1920 — when were the roof, HVAC, electrical panel, plumbing, and water heater last replaced?
- Is there a deadline driving the sale (1031 exchange, divorce, estate, relocation)? That informs how much negotiation room exists.
- Schools are D-rated, which usually means shorter tenancies and higher turnover. Who's the typical renter profile here, and what's been the actual vacancy rate?
- What's the average days-on-market for RENTAL listings here right now (not sales)? A rising rental-DOM trend means longer vacancies and softer asking-rent achievability than the comps imply.
- What's the recent tenant-quality profile in this submarket — average credit score on applications, eviction rate, late-payment / NSF rate, and stable-employment percentage? A property-management company in the area should have these aggregated.
- How much new for-sale + rental construction is in the pipeline within 1–3 miles? Heavy new supply typically softens prices + rents 12–24 months out; constrained supply supports both.
Investment metrics
- 1% rule
- 0.97% ✗
- Cap rate
- 8.24%
- Cash-on-cash
- 6.94%
- DSCR
- 1.31
- GRM
- 8.6
CMA / ARV
- ARV (median comp)
- $131,800
- List price
- $127,000
- Delta
- -3.64%
- Verdict
- FAIR
- Comps
- 20 within 1.0 mi
Show comp detail 12 sales within ~0.75 mi
| Address | Dist | Beds/Ba | Sqft | Sold | Price | $/sf | Match |
|---|---|---|---|---|---|---|---|
| 625 Franklin Ave | 0.06mi | 2/1.0 | 968 (+2%) | 8mo | $124,900 | $129 | 88 |
| 609 Franklin Ave | 0.11mi | 3/2.0 (+1) | 996 (+5%) | 3mo | $187,500 | $188 | 76 |
| 401 Fulton Ave | 0.32mi | 3/1.0 (+1) | 974 (+2%) | 2mo | $169,900 | $174 | 75 |
| 818 Vincil St | 0.42mi | 2/1.0 | 960 (+1%) | 6mo | $99,900 | $104 | 74 |
| 602 Vincil St | 0.42mi | 2/1.0 | 937 (-2%) | 7mo | $69,900 | $75 | 72 |
| 524 Barrow St | 0.59mi | 2/1.0 | 912 (-4%) | 5mo | $119,900 | $131 | 61 |
| 401 Morehead St | 0.33mi | 1/1.0 (-1) | 868 (-9%) | 10mo | $49,900 | $57 | 56 |
| 800 Union Ave | 0.36mi | 3/1.0 (+1) | 1,034 (+9%) | 12mo | $115,000 | $111 | 54 |
| 486 E Rollins St | 0.75mi | 2/1.0 | 930 (-2%) | 10mo | $82,900 | $89 | 53 |
| 622 Union Ave | 0.36mi | 3/2.0 (+1) | 1,014 (+6%) | 14mo | $125,000 | $123 | 52 |
| 514 Union Ave | 0.41mi | 2/1.0 | 1,064 (+12%) | 14mo | $25,000 | $23 | 50 |
| 520 Taylor St | 0.49mi | 2/1.5 | 1,053 (+11%) | 12mo | $124,900 | $119 | 48 |
Match score weights: distance 35% · size 25% · config 20% · recency 20%. Top-matched comps best support the ARV.
Projected returns pro-forma
-3.0% appreciation · 3.0% rent growth · sell at horizon
- IRR
- -5.7%
- Equity multiple
- 0.79×
- Total profit
- $-7,533
- Equity at exit
- $18,936
- IRR
- 3.9%
- Equity multiple
- 1.28×
- Total profit
- $10,110
- Equity at exit
- $10,981
Cash invested: $35,560 (down + closing). Projections, not guarantees.
Landlord ↔ Tenant lean methodology
- Overall (STATE)
- 81 Strongly Landlord-Friendly
- State Missouri
- 81 Strongly Landlord-Friendly · R+10
- County
- — inherits STATE
- City
- — inherits STATE
ZIP-level market 65270
- Home prices YoY
- -30.6%
- Active inventory
- 134
- Price-to-rent
- 8.6×
Monthly cashflow live
- Estimated rent
- $1,236 medium interval (Pro) →
- Mortgage (P&I)
- −$666
- Tax from tax record
- −$52 /mo · $625/yr
- Insurance
- −$53
- HOA
- −$0
- Vacancy / Maint / Mgmt
- −$260
- Net cashflow
- $206
Break-even live
UW: 25.0% down · 7.5% · 30yr · 1.5% tax · 5.0% vac · 8.0% maint · 8.0% mgmt
Financing live
Cash to close
- Down payment
- $31,750
- Closing costs
- $3,810
- Reserves months
- —
- Total cash needed
- —
Loan-product check · same deal, 3 products live
Conventional
25% down · 7.5% · 30yr
- Down + closing
- —
- Monthly P&I
- —
- Monthly cashflow
- —
- DSCR
- —
- Eligible?
- —
Personal DTI + credit; lowest rate.
DSCR
20% down · 8.5% · 30yr
- Down + closing
- —
- Monthly P&I
- —
- Monthly cashflow
- —
- DSCR
- —
- Eligible?
- —
No personal income docs; deal must DSCR.
Hard money
10% down · 12.0% · 12mo
- Down + closing
- —
- Monthly P&I
- —
- Monthly cashflow
- —
- DSCR
- —
- Eligible?
- —
Short-term bridge; refi at stabilization.
Listing history 20 events
-
2026-05-09status Pending 315-char remark
Show marketing remark (315 chars)
Check out this 2 bedroom home that's completely move-in ready that has not one, but two garages and is situated on almost acre lot in town! Neutral colors, modern lighting, updated bathroom. Modern appliances can stay. Newer roof, plumbing, electrical, windows, siding and more! Should qualify for most loan types.
-
2026-05-06status Pending 323-char remark
Show marketing remark (323 chars)
Check out this 2 bedroom home that's completely move-in ready that has not one, but two garages and is situated on almost ½ acre lot in town! Neutral colors, modern lighting, updated bathroom. Modern appliances can stay. Newer roof, plumbing, electrical, windows, siding and more! Should qualify for most loan types.
-
2026-05-06status Pending
Show marketing remark (323 chars)
Check out this 2 bedroom home that's completely move-in ready that has not one, but two garages and is situated on almost ½ acre lot in town! Neutral colors, modern lighting, updated bathroom. Modern appliances can stay. Newer roof, plumbing, electrical, windows, siding and more! Should qualify for most loan types.
-
2026-04-14$127,000 Active 315-char remark
Show marketing remark (323 chars)
Check out this 2 bedroom home that's completely move-in ready that has not one, but two garages and is situated on almost ½ acre lot in town! Neutral colors, modern lighting, updated bathroom. Modern appliances can stay. Newer roof, plumbing, electrical, windows, siding and more! Should qualify for most loan types.
-
2026-04-14$127,000 Active 323-char remark
Show marketing remark (323 chars)
Check out this 2 bedroom home that's completely move-in ready that has not one, but two garages and is situated on almost ½ acre lot in town! Neutral colors, modern lighting, updated bathroom. Modern appliances can stay. Newer roof, plumbing, electrical, windows, siding and more! Should qualify for most loan types.
-
2026-04-14$127,000 Active
Show marketing remark (323 chars)
Check out this 2 bedroom home that's completely move-in ready that has not one, but two garages and is situated on almost ½ acre lot in town! Neutral colors, modern lighting, updated bathroom. Modern appliances can stay. Newer roof, plumbing, electrical, windows, siding and more! Should qualify for most loan types.
-
2023-09-26soldstatus Closed
-
2023-09-26soldstatus
-
2023-09-26soldstatus $89,000
-
2023-08-18status Pending
-
2023-08-17historical
-
2023-08-14price $89,500
-
2023-08-14status Active
-
2023-08-11historical
-
2023-08-02status Pending
-
2023-07-31price $104,900
-
2023-07-11price $119,500
-
2023-06-28$139,900 Active
-
2023-06-28$89,500
-
2001-08-31soldstatus $28,000
ⓘ Source: listings_history table (triggers on properties + properties_extension) + one-shot
backfill from property_details.listing_events for pre-trigger history.
Tax reassessment forecast MO · Resets to sale price
- Current annual tax
- $625 · $52/mo
- Projected year-2 tax
- $1,232 · $103/mo
- Expected delta
- +$607/yr (+$51/mo · 97.0%)
ⓘ Screening estimate from a state-policy table — verify with the county assessor before closing.
Climate risk First Street
- Flood 1/10 Low FEMA zone X (unshaded) · 0% chance over 30 yrs
- Wildfire 3/10 Moderate
- Heat 4/10 Moderate 7 d/yr ≥107°F today · 17 d/yr by 30 yrs out
- Wind 2/10 Low
- Air quality 1/10 Low 0 unhealthy d/yr today · 0 by 30 yrs out
Nearby sold comps map
Loading sold comps map…
Walkable amenities ~0.75 mi
Loading nearby amenities…
Taxation est. · year 1
- Rental income
- $14,835
- − Mortgage interest
- −$7,114
- − Property taxes
- −$625
- − Insurance
- −$635
- − Repairs & maintenance
- −$1,187
- − Management
- −$1,187
- − Depreciation
- −$3,695
- Taxable income
- $392
- Est. tax owed @ 24.0%
- −$94
- After-tax cash flow
- $2,373/yr
For passive investors: Depreciation is non-cash, so a rental often shows a tax loss while cash-flowing — sheltering income. Rental losses are passive: they offset passive income freely, and up to $25,000/yr can offset ordinary (W-2) income if you actively participate and your MAGI is under $100k (phasing out to $0 by $150k); unused losses carry forward. On sale, claimed depreciation is recaptured at up to 25%, and gains may owe capital-gains tax (a 1031 exchange can defer both). Figures are a year-1 estimate at your 24.0% rate — not tax advice; consult a CPA.
Schools (NCES district)
- District
- Moberly
- NCES district ID
- 2921100
- Math proficiency
- 30% ▼ -1.00%
- Reading proficiency
- 36% ▼ -3.00%
- Median HH income
- $36,160
- Composite
- 27.35/100
- National rank
- #6984
- State rank
- #246 of 324 in MO
Livability — Moberly
- Score
- 77/100
- State rank
- #32
- US rank
- #3045
Category grades
Schools grade is shown separately in the Schools card above.
Census & demographics
- Census place
- Moberly, MO
- Population (ZIP)
- 16,762
Population outlook (Randolph County) Hauer SSP2
- Today (2025)
- 24,596 people
- By 2030
- 24,213 · -1.6%
- By 2040
- 23,184 · -5.7%
- By 2050
- 22,081 · -10.2%
- By 2075
- 18,994 · -22.8%
- By 2100
- 15,070 · -38.7%
Race, ethnicity, and origin ACS 2023
- Neighborhood character
- Predominantly White (84%)
- Race & ethnicity
- White 84% Black 7% Two or more races 6% Hispanic / Latino 3%
- Common ancestry
- Italian 2% Lithuanian 2% Iranian 1%
- Foreign-born
- 1% · Canada
- Languages at home
- 98% English-only · Spanish 1%
Political lean MEDSL · Randolph
- 2024 margin
- Solid R (+52.2) · D 23.3% · R 75.5% · Other 1.2%
- 2008→2024 swing
- -28.9pp toward R · 2008: -23.3pp · 2024: -52.2pp
- All cycles
- 2024: R+52.2 2020: R+51.5 2016: R+50.9 2012: R+36.6 2008: R+23.3
Not yet ingested
- Civics
- —
Market trends
- HPI YoY
- ▼ -88.15%
- Current HPI
- 199.9743
- Rent YoY
- —
- Metro
- —
- State GDP YoY
- ▲ 1.84%
- F500 in state
- 20
Industry mix (Fortune 500 HQ in MO)
| Industry | F500 HQs | Revenue |
|---|---|---|
| Healthcare | 1 | $163B |
|
||
| Insurance | 1 | $21B |
|
||
| Industrial Technology | 1 | $17B |
|
||
| Retail | 1 | $16B |
|
||
| Industrial Distribution | 1 | $10B |
|
||
| Utilities | 1 | $9B |
|
||
Price history
+353.6% since first listed20 events — show timeline
- 2026-05-09 Pending — NECAR
- 2026-05-06 Pending — CBORMLS
- 2026-05-06 Pending — RCBR
- 2026-04-14 Listed $127,000 RCBR
- 2026-04-14 Listed $127,000 CBORMLS
- 2026-04-14 Listed $127,000 NECAR
- 2023-09-26 Sold (Public Records) $89,000 Public Records
- 2023-09-26 Sold (MLS) — RCBR
- 2023-09-26 Sold (MLS) — CBORMLS
- 2023-08-18 Pending — CBORMLS
- 2023-08-17 Delisted — CBORMLS
- 2023-08-14 Price Changed $89,500 CBORMLS
- 2023-08-14 Relisted — CBORMLS
- 2023-08-11 Delisted — CBORMLS
- 2023-08-02 Pending — CBORMLS
- 2023-07-31 Price Changed $104,900 CBORMLS
- 2023-07-11 Price Changed $119,500 CBORMLS
- 2023-06-28 Listed $89,500 RCBR
- 2023-06-28 Listed $139,900 CBORMLS
- 2001-08-31 Sold (Public Records) $28,000 Public Records
Property tax history
+5.5%/yrLatest (2025): $625 · +59.9% YoY. Source: county tax records.
Cash-flow waterfall
monthlySold comps — $/sqft
last 12 mo · ≤1 miLoading sold comps…