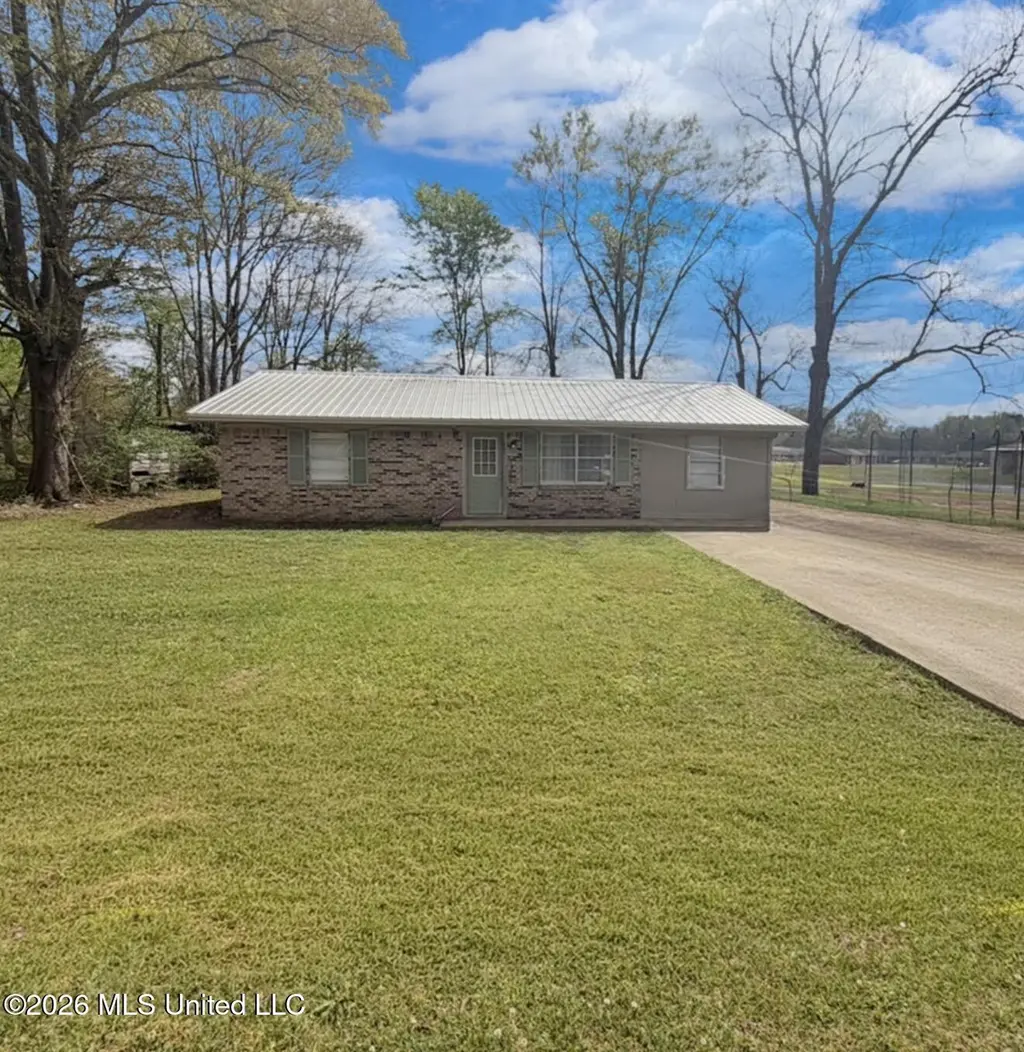
205 Summers St · Walnut Grove, MS
Flood risk 1/10 · Minimal
- FEMA flood zone
- X (unshaded)
- Chance of flooding over 30 yrs
- 0.0%
- Est. flood insurance / yr
- $507 – $1,088
Fire risk 3/10 · Minor
- Est. fire insurance / yr
- $1,241 – $2,305
Heat risk 7/10 · Major
- Hot days now (above 109°F)
- 7 days/yr
- Hot days in 30 yrs
- 23 days/yr
Wind risk 8/10 · Major
- Chance of severe wind over 30 yrs
- 80.0%
Air-quality risk 1/10 · Minimal
- Unhealthy air days now
- 0 days/yr
- Unhealthy air days in 30 yrs
- 0 days/yr
Risk factors via First Street. Map © Google.
Why this score? — see what drove the D- grade
The composite is a weighted blend of 9 inputs, each scored 0–100. Each bar is that input's sub-score; the figure is the points it added to the 100-point composite (weight × sub-score).
- Cash flow +14.3/30.0
- Appreciation +5.0/10.0
- DSCR +4.3/10.0
- 1% rule +3.1/10.0
- Livability +3.1/5.0
- ARV discount +2.9/15.0
- Rent growth +2.5/5.0
- Condition / age +2.5/5.0
- Schools +1.3/10.0
$118,000
🖨 Deal sheet 📄 Offer letter ✓ Due diligence
Listing remarks MLS
Unique home is up for sale. One of the very few houses currently for sale & at this bargain in Walnut Grove. 3 spacious rooms, double closets , comes with an open kitchen and living room plan. Sits on an ample half an acre which is very manageable for seniors or first time home buyers. Central to town and close to doctors office, pharmacy, bank, school, restaurant and other businesses. This can make it a good investment property also. Don't let the opportunity to own this home slip away.
Key facts
- Central to town
- Ample half an acre
- 0.5 acre lot
Tags
Neighborhood map
What this means for you Summary
Snapshot
- This is a 3-bed/1.0-bath single-family listed at $118k.
Deal economics
- At list price, monthly cash flow is $21 ($253/yr) — positive.
- The deal already cash-flows at list — no discount required.
- To meet the 1% rule (rent ≥ 1% of price), the offer needs to be $96k (18.8% below list).
- Recommended offer: $96k (18.8% below list) — sets the bar for 1% rule.
Location & tenants
- Location reads 62/100 on livability (#175 in MS) — a middle-class / working-renter tenant base. Strengths: crime A+, cost of living A+, housing B; Watch: schools F, amenities F, commute F.
- Leake County School District (town): math 11% / reading 22% proficiency, ranked #102 of 130 in MS (top 78%) — low school quality limits family demand, transient renter base, plan for 1-2y turnover; 83% free/reduced lunch — lower-income household profile, screen leases tightly.
- Market conditions: 8 active listings in the ZIP.
Forward outlook
- In year one you build about $4k of equity ($816 loan paydown + $4k appreciation (3.0% local appreciation)).
- Leake County population projected at -26% by 2050 — secular population decline; favor cash flow + early exit over multi-decade hold.
- At projected returns (3.0% appreciation + 3.0% rent growth), your $33k cash investment doubles in ~6 years — after that, you're playing with house money.
- By year 8, paydown + projected appreciation supports a ~$32k cash-out refi (75% LTV) — recoverable capital for the next deal without selling this one.
Negotiation context
- It's been on market 80 days — a 6% lower offer ($111k) is reasonable based on typical stale-listing flexibility.
- 2 sale attempts since 7y ago with the ask held roughly flat each time — persistent listings suggest the price (not the market) is what's stuck; bring a comps-based counter.
Risks & watch-outs
- Climate carrying-cost: severe wind risk, 80% chance of damaging wind over 30y; extreme-heat days projected 7→23/yr by 2055 (HVAC capex compounding) — expect insurance premiums to compound above CPI over the hold.
Questions for the listing agent
- It's been on market 80 days. Have you received any prior offers? Is the seller open to a 19% concession, seller financing, or rate buy-down credit?
- Why hasn't it sold? Are there any deal-killer items the seller is aware of (foundation, flood, title, zoning, code violations)?
- Is there a deadline driving the sale (1031 exchange, divorce, estate, relocation)? That informs how much negotiation room exists.
- Schools are F-rated, which usually means shorter tenancies and higher turnover. Who's the typical renter profile here, and what's been the actual vacancy rate?
- The area grade is low — what's the realistic commute time and amenity access for the typical tenant pool here? Any planned neighborhood developments (good or bad) we should know about?
- What's the average days-on-market for RENTAL listings here right now (not sales)? A rising rental-DOM trend means longer vacancies and softer asking-rent achievability than the comps imply.
- What's the recent tenant-quality profile in this submarket — average credit score on applications, eviction rate, late-payment / NSF rate, and stable-employment percentage? A property-management company in the area should have these aggregated.
- How much new for-sale + rental construction is in the pipeline within 1–3 miles? Heavy new supply typically softens prices + rents 12–24 months out; constrained supply supports both.
Investment metrics
- 1% rule
- 0.81% ✗
- Cap rate
- 6.51%
- Cash-on-cash
- 0.77%
- DSCR
- 1.03
- GRM
- 10.3
CMA / ARV
- ARV (median comp)
- $107,134
- List price
- $118,000
- Delta
- 10.14%
- Verdict
- OVERPRICED
- Comps
- 5 within 1.0 mi
Show comp detail 1 sale within ~0.75 mi
| Address | Dist | Beds/Ba | Sqft | Sold | Price | $/sf | Match |
|---|---|---|---|---|---|---|---|
| 111 Lewis Ave | 0.31mi | 3/1.0 | 1,014 (-3%) | 11mo | $118,000 | $116 | 71 |
Match score weights: distance 35% · size 25% · config 20% · recency 20%. Top-matched comps best support the ARV.
Projected returns pro-forma
3.0% appreciation · 3.0% rent growth · sell at horizon
- IRR
- 8.2%
- Equity multiple
- 1.47×
- Total profit
- $15,522
- Equity at exit
- $53,058
- IRR
- 10.8%
- Equity multiple
- 2.61×
- Total profit
- $53,348
- Equity at exit
- $81,769
Cash invested: $33,040 (down + closing). Projections, not guarantees.
Landlord ↔ Tenant lean methodology
- Overall (STATE)
- 90 Strongly Landlord-Friendly
- State Mississippi
- 90 Strongly Landlord-Friendly · R+11
- County
- — inherits STATE
- City
- — inherits STATE
ZIP-level market 39189
- Active inventory
- 8
- Price-to-rent
- 10.3×
Monthly cashflow live
- Estimated rent
- $958 medium interval (Pro) →
- Mortgage (P&I)
- −$619
- Tax from tax record
- −$68 /mo · $814/yr
- Insurance
- −$49
- HOA
- −$0
- Vacancy / Maint / Mgmt
- −$201
- Net cashflow
- $21
Break-even live
UW: 25.0% down · 7.5% · 30yr · 1.5% tax · 5.0% vac · 8.0% maint · 8.0% mgmt
Financing live
Cash to close
- Down payment
- $29,500
- Closing costs
- $3,540
- Reserves months
- —
- Total cash needed
- —
Loan-product check · same deal, 3 products live
Conventional
25% down · 7.5% · 30yr
- Down + closing
- —
- Monthly P&I
- —
- Monthly cashflow
- —
- DSCR
- —
- Eligible?
- —
Personal DTI + credit; lowest rate.
DSCR
20% down · 8.5% · 30yr
- Down + closing
- —
- Monthly P&I
- —
- Monthly cashflow
- —
- DSCR
- —
- Eligible?
- —
No personal income docs; deal must DSCR.
Hard money
10% down · 12.0% · 12mo
- Down + closing
- —
- Monthly P&I
- —
- Monthly cashflow
- —
- DSCR
- —
- Eligible?
- —
Short-term bridge; refi at stabilization.
Listing history 18 events
-
2026-06-18days on market $118,000 Active 80 DOM
-
2026-06-17days on market $118,000 Active 79 DOM
-
2026-06-16days on market $118,000 Active 78 DOM
-
2026-06-15days on market $118,000 Active 77 DOM
-
2026-06-13days on market $118,000 Active 75 DOM
-
2026-06-12days on market $118,000 Active 74 DOM
-
2026-06-09days on market $118,000 Active 71 DOM
-
2026-06-08days on market $118,000 Active 70 DOM
-
2026-06-07days on market $118,000 Active 69 DOM
-
2026-06-07days on market $118,000 Active 68 DOM
-
2026-06-04days on market $118,000 Active 65 DOM
-
2026-06-02days on market $118,000 Active 64 DOM
-
2026-06-01days on market $118,000 Active 63 DOM
-
2026-05-31days on market $118,000 Active 62 DOM
-
2026-03-30$118,000 Active 500-char remark
Show marketing remark (500 chars)
Unique home is up for sale. One of the very few houses currently for sale & at this bargain in Walnut Grove. 3 spacious rooms, double closets , comes with an open kitchen and living room plan. Sits on an ample half an acre which is very manageable for seniors or first time home buyers. Central to town and close to doctors office, pharmacy, bank, school, restaurant and other businesses. This can make it a good investment property also. Don't let the opportunity to own this home slip away.
-
2020-11-16soldstatus
-
2019-08-30soldstatus 196-char remark
Show marketing remark (196 chars)
Freshly remodeled 3 bedroom 1 bath brick home located in a quite neighborhood. This home has new kitchen, bathroom,floors,paint inside and out as well as a new Central Air and heat unit. Very nice
-
2019-02-27$75,000 196-char remark
Show marketing remark (196 chars)
Freshly remodeled 3 bedroom 1 bath brick home located in a quite neighborhood. This home has new kitchen, bathroom,floors,paint inside and out as well as a new Central Air and heat unit. Very nice
ⓘ Source: listings_history table (triggers on properties + properties_extension) + one-shot
backfill from property_details.listing_events for pre-trigger history.
Tax reassessment forecast MS · Resets to sale price
- Current annual tax
- $814 · $68/mo
- Projected year-2 tax
- $932 · $78/mo
- Expected delta
- +$118/yr (+$10/mo · 14.5%)
ⓘ Screening estimate from a state-policy table — verify with the county assessor before closing.
Climate risk First Street
- Flood 1/10 Low FEMA zone X (unshaded) · 0% chance over 30 yrs
- Wildfire 3/10 Moderate
- Heat 7/10 Severe 7 d/yr ≥109°F today · 23 d/yr by 30 yrs out
- Wind 8/10 Severe 80% chance of damaging wind over 30 yrs
- Air quality 1/10 Low 0 unhealthy d/yr today · 0 by 30 yrs out
Nearby sold comps map
Loading sold comps map…
Walkable amenities ~0.75 mi
Loading nearby amenities…
Taxation est. · year 1
- Rental income
- $11,497
- − Mortgage interest
- −$6,610
- − Property taxes
- −$814
- − Insurance
- −$590
- − Repairs & maintenance
- −$920
- − Management
- −$920
- − Depreciation
- −$3,433
- Taxable loss
- −$1,789
- Est. tax savings @ 24.0%
- +$429
- After-tax cash flow
- $682/yr
For passive investors: Depreciation is non-cash, so a rental often shows a tax loss while cash-flowing — sheltering income. Rental losses are passive: they offset passive income freely, and up to $25,000/yr can offset ordinary (W-2) income if you actively participate and your MAGI is under $100k (phasing out to $0 by $150k); unused losses carry forward. On sale, claimed depreciation is recaptured at up to 25%, and gains may owe capital-gains tax (a 1031 exchange can defer both). Figures are a year-1 estimate at your 24.0% rate — not tax advice; consult a CPA.
Schools (NCES district)
- District
- Leake County School District
- NCES district ID
- 2802520
- Math proficiency
- 11% ▼ -21.00%
- Reading proficiency
- 22% ▼ -9.00%
- Median HH income
- $32,894
- Composite
- 13.33/100
- National rank
- #9538
- State rank
- #102 of 130 in MS
Livability — Walnut Grove
- Score
- 62/100
- State rank
- #175
- US rank
- #16570
Category grades
Schools grade is shown separately in the Schools card above.
Census & demographics
- Census place
- Walnut Grove, MS
- Population (ZIP)
- 3,696
Population outlook (Leake County) Hauer SSP2
- Today (2025)
- 21,382 people
- By 2030
- 20,405 · -4.6%
- By 2040
- 18,208 · -14.8%
- By 2050
- 15,732 · -26.4%
- By 2075
- 9,562 · -55.3%
- By 2100
- 5,455 · -74.5%
Race, ethnicity, and origin ACS 2023
- Neighborhood character
- Diverse neighborhood (Simpson 0.63)
- Race & ethnicity
- White 47% Black 39% Native American 13%
- Common ancestry
- Lithuanian 3% Russian 1% Italian 1%
- Foreign-born
- 1% · Canada
- Languages at home
- 91% English-only · German/W. Germanic 1%
Political lean MEDSL · Leake
- 2024 margin
- Strong R (+23.4) · D 38.0% · R 61.4%
- 2008→2024 swing
- -12.7pp toward R · 2008: -10.7pp · 2024: -23.4pp
- All cycles
- 2024: R+23.4 2020: R+14.5 2016: R+14.2 2012: R+8.6 2008: R+10.7
Not yet ingested
- Civics
- —
Market trends
- HPI YoY
- —
- Current HPI
- —
- Rent YoY
- —
- Metro
- —
- State GDP YoY
- —
- F500 in state
- 0
Price history
+57.3% since first listed4 events — show timeline
- 2026-03-30 Listed $118,000 MLSU
- 2020-11-16 Sold (Public Records) — Public Records
- 2019-08-30 Sold (MLS) — MLSU
- 2019-02-27 Listed $75,000 MLSU
Property tax history
+10.0%/yrLatest (2025): $814 · +2.2% YoY. Source: county tax records.
Cash-flow waterfall
monthlySold comps — $/sqft
last 12 mo · ≤1 miLoading sold comps…