9409 Old Concord Rd Unit F · Charlotte, NC
Flood risk 1/10 · Minimal
- FEMA flood zone
- X (unshaded)
- Chance of flooding over 30 yrs
- 0.0%
- Est. flood insurance / yr
- $507 – $1,088
Fire risk 1/10 · Minimal
- Est. fire insurance / yr
- $906 – $1,684
Heat risk 6/10 · Moderate
- Hot days now (above 104°F)
- 7 days/yr
- Hot days in 30 yrs
- 17 days/yr
Wind risk 5/10 · Moderate
- Chance of severe wind over 30 yrs
- 25.0%
Air-quality risk 4/10 · Minor
- Unhealthy air days now
- 4 days/yr
- Unhealthy air days in 30 yrs
- 5 days/yr
Risk factors via First Street. Map © Google.
Why this score? — see what drove the D grade
The composite is a weighted blend of 9 inputs, each scored 0–100. Each bar is that input's sub-score; the figure is the points it added to the 100-point composite (weight × sub-score).
- Cash flow +11.7/30.0
- ARV discount +8.7/15.0
- 1% rule +4.9/10.0
- Livability +3.9/5.0
- Schools +3.8/10.0
- DSCR +3.5/10.0
- Rent growth +2.7/5.0
- Condition / age +2.5/5.0
- Appreciation +0.0/10.0
$146,000
🖨 Deal sheet 📄 Offer letter ✓ Due diligence
Listing remarks
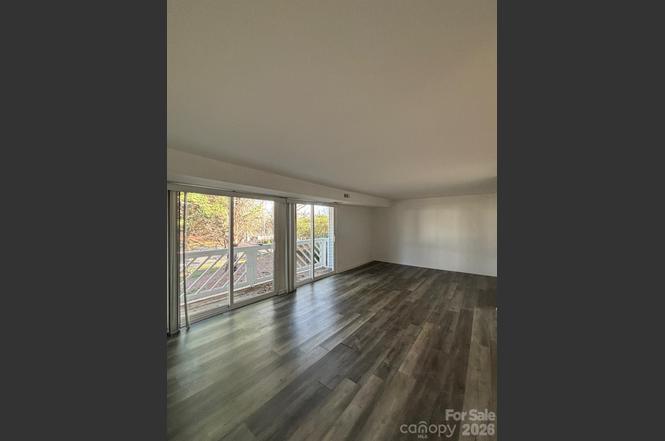
Great Investment Property. Strong cash flow. Great location minutes from UNC Charotte, proximity to many of what Charlotte has to offer, Uptown, Noda, Camp North End, with all the restaurants, breweries and entertainment. Located near public transportation bus and Blue Line light rail. Excellent floor plan for small family or roommates with large bedrooms and 2 full bathrooms. large oversize living room with large sliding windows allowing light an open feeling. Living room opens to covered balcony. Condo has all new window systems approx. 3 years old. This condo makes a nice addition to a rental portfolio. Unit is tenant occupied with a new lease starting April 1. rent rate is $1675.00. str
Key facts
- $267 HOA
- Built 1986
- Listed 140 days
Property features AI
Finance
- HOA & community: Homeowners association: JCC Property Group; Mandatory HOA dues of $267 per month
Exterior
- Parking: 2 assigned parking spaces
- Utilities: City water; Public sewer; Publicly maintained paved/asphalt road
- Home design: Condominium (Mid-Rise); Residential property; One level
- Construction: Site-built construction; Vinyl and wood exterior; Slab foundation
- Exterior features: Covered patio/porch
Interior
- Kitchen: Dishwasher; Electric range; Refrigerator
- Bedrooms: 2 bedrooms (both on the main level)
- Flooring: Vinyl flooring
- Bathrooms: 2 full bathrooms (both on the main level)
- Heating & cooling: Central heating; Central air conditioning; Electric water heater
- Interior features: 8 total rooms; Exhaust hood; Entry level is 2
- Laundry & utility: Washer hookup; Electric dryer hookup; Utility room
Neighborhood map
What this means for you Summary
Snapshot
- This is a 2-bed/2.0-bath condo listed at $146k.
Deal economics
- At list price, monthly cash flow is $-42 ($-502/yr) — negative.
- To cash-flow at today's rent, offer at most $139k (5.1% below list).
- To meet the 1% rule (rent ≥ 1% of price), the offer needs to be $144k (1.5% below list).
- Recommended offer: $128k (12.0% below list) — sets the bar for market timing.
- Cap rate 5.9% vs local median 3.1% in Charlotte — top-decile yield for the area; either an underpriced asset or a hidden risk that comps aren't pricing in. Stress-test before assuming the spread holds.
Location & tenants
- Location reads 78/100 on livability (#26 in NC, #2,502 nationally) — a middle-class / working-renter tenant base. Strengths: amenities A+, commute A+, housing A+; Watch: schools D+, crime F.
- Charlotte-Mecklenburg Schools (urban): math 42% / reading 46% proficiency, ranked #85 of 178 in NC (top 48%) — families likely to look elsewhere, expect single-tenant / working-renter base with shorter leases.
- Market conditions: Rents flat; 282 active listings in the ZIP; 35 comparable units currently listed for rent nearby; rentals at typical pace (median 20d on market — plan ~3-4 weeks tenant-placement turnaround); 11,969 units permitted in Mecklenburg County in 2024 (5,377 in 5+ unit buildings).
Forward outlook
- Local home prices are declining (-3.0%/yr); year-one equity from $1k of loan paydown is wiped out by about $4k of value loss. Plan a longer hold.
- Mecklenburg County population projected at +53% by 2050 — long-run rental-demand tailwind backs the buy-and-hold thesis.
Negotiation context
- It's been on market 140 days — a 12% lower offer ($128k) is reasonable based on typical stale-listing flexibility.
- 2 sale attempts with the ask held roughly flat each time — persistent listings suggest the price (not the market) is what's stuck; bring a comps-based counter.
- Current owner paid $126k; 16% above their basis — modest negotiation headroom, anchor on the comps not their cost.
Risks & watch-outs
- Climate carrying-cost: moderate wind risk, 25% chance of damaging wind over 30y; extreme-heat days projected 7→17/yr by 2055 (HVAC capex compounding) — expect insurance premiums to compound above CPI over the hold.
Questions for the listing agent
- What do current leases actually rent for vs. the listed asking? Can we see a recent rent roll and the last 12 months of T-12 income?
- It's been on market 140 days. Have you received any prior offers? Is the seller open to a 12% concession, seller financing, or rate buy-down credit?
- What does the HOA fee cover, when was the last increase, and are there any pending special assessments or reserve-fund shortfalls?
- Any open or pending special assessments — roof, HVAC, plumbing, elevator, façade? What's the per-unit balance and payoff schedule, and is the seller paying it off at close or rolling it to the buyer?
- Why hasn't it sold? Are there any deal-killer items the seller is aware of (foundation, flood, title, zoning, code violations)?
- Is there a deadline driving the sale (1031 exchange, divorce, estate, relocation)? That informs how much negotiation room exists.
- Schools are D-rated, which usually means shorter tenancies and higher turnover. Who's the typical renter profile here, and what's been the actual vacancy rate?
- Crime grade is F in this area — have there been break-ins, vandalism, or insurance claims at this property in the last 3 years? What carrier currently insures it and at what premium?
- The area grade is low — what's the realistic commute time and amenity access for the typical tenant pool here? Any planned neighborhood developments (good or bad) we should know about?
- What's the average days-on-market for RENTAL listings here right now (not sales)? A rising rental-DOM trend means longer vacancies and softer asking-rent achievability than the comps imply.
- What's the recent tenant-quality profile in this submarket — average credit score on applications, eviction rate, late-payment / NSF rate, and stable-employment percentage? A property-management company in the area should have these aggregated.
- How much new apartment / multifamily construction is in the pipeline within 1–3 miles? Heavy new supply (>2% of stock underway) typically softens rents 12–24 months out; light construction supports rent growth.
Investment metrics
- 1% rule
- 0.99% ✗
- Cap rate
- 5.95%
- Cash-on-cash
- -1.23%
- DSCR
- 0.95
- GRM
- 8.5
CMA / ARV
- ARV (on-the-fly)
- $150,080
- Comps found
- 2
Show comp detail 2 sales within ~0.75 mi
| Address | Dist | Beds/Ba | Sqft | Sold | Price | $/sf | Match |
|---|---|---|---|---|---|---|---|
| 9329 Old Concord Rd Unit B | 0.06mi | 2/2.0 | 938 (0%) | 14mo | $140,000 | $149 | 86 |
| 9329 Old Concord Rd Unit A | 0.06mi | 2/2.0 | 843 (-10%) | 13mo | $134,500 | $160 | 70 |
Match score weights: distance 35% · size 25% · config 20% · recency 20%. Top-matched comps best support the ARV.
Projected returns pro-forma
-3.0% appreciation · 0.63% rent growth · sell at horizon
- IRR
- -21.4%
- Equity multiple
- 0.28×
- Total profit
- $-29,550
- Equity at exit
- $21,769
- IRR
- -23.1%
- Equity multiple
- -0.02×
- Total profit
- $-41,767
- Equity at exit
- $12,623
Cash invested: $40,880 (down + closing). Projections, not guarantees.
Landlord ↔ Tenant lean methodology
- Overall (STATE)
- 85 Strongly Landlord-Friendly
- State North Carolina
- 85 Strongly Landlord-Friendly · R+3
- County
- — inherits STATE
- City
- — inherits STATE
ZIP-level market 28213
- Home prices YoY
- -24.9%
- Rents YoY
- 0.6%
- Active inventory
- 282
- Price-to-rent
- 8.5×
Monthly cashflow live
- Estimated rent
- $1,438 high interval (Pro) →
- Mortgage (P&I)
- −$766
- Tax from tax record
- −$85 /mo · $1,016/yr
- Insurance
- −$61
- HOA
- −$267
- Vacancy / Maint / Mgmt
- −$302
- Net cashflow
- $-42
Break-even live
UW: 25.0% down · 7.5% · 30yr · 1.5% tax · 5.0% vac · 8.0% maint · 8.0% mgmt
Financing live
Cash to close
- Down payment
- $36,500
- Closing costs
- $4,380
- Reserves months
- —
- Total cash needed
- —
Loan-product check · same deal, 3 products live
Conventional
25% down · 7.5% · 30yr
- Down + closing
- —
- Monthly P&I
- —
- Monthly cashflow
- —
- DSCR
- —
- Eligible?
- —
Personal DTI + credit; lowest rate.
DSCR
20% down · 8.5% · 30yr
- Down + closing
- —
- Monthly P&I
- —
- Monthly cashflow
- —
- DSCR
- —
- Eligible?
- —
No personal income docs; deal must DSCR.
Hard money
10% down · 12.0% · 12mo
- Down + closing
- —
- Monthly P&I
- —
- Monthly cashflow
- —
- DSCR
- —
- Eligible?
- —
Short-term bridge; refi at stabilization.
Rent comps 35 comps
| Address | Beds | Baths | Sqft | Rent | $/sqft | DOM | Units | Dist |
|---|---|---|---|---|---|---|---|---|
| 9329 Old Concord Rd Unit A Charlotte, NC | 2.0 | 2.0 | 843 | $1,500 | $1.78 | 8d | 1 | 0.05mi |
| 9329 Old Concord Rd Charlotte, NC | 2.0 | 2.0 | 843 | $1,350 | $1.60 | 24d | 1 | 0.05mi |
| 9401 Old Concord Rd Unit L Charlotte, NC | 2.0 | 2.0 | 800 | $1,250 | $1.56 | 22d | 1 | 0.05mi |
| 9333 Old Concord Rd Unit J Charlotte, NC | 2.0 | 2.0 | 843 | $1,350 | $1.60 | 24d | 1 | 0.06mi |
| 9424 Lexington Cir Charlotte, NC | 3.0 | 2.5 | 1110 | $1,700 | $1.53 | 22d | 1 | 0.11mi |
| 9500 Shannon Green Dr Charlotte, NC | 2.0 | 2.0 | 857 | $1,150 | $1.34 | 22d | 1 | 0.13mi |
| 9501 Shannon Green Dr Unit A Charlotte, NC | 2.0 | 2.0 | 950 | $1,100 | $1.16 | 24d | 1 | 0.15mi |
| Shannon Green Dr Charlotte, NC | 2.0 | 2.0 | 950 | $1,150 | $1.21 | 24d | 1 | 0.19mi |
| 1301 Ivy Meadow Dr Charlotte, NC | 1.0–3.0 | 1.0–2.0 | 1121 | $1,636 | $1.46 | 2d | 26 | 0.28mi |
| 9603 Vinca Cir Charlotte, NC | 2.0 | 2.0 | 836 | $1,400 | $1.67 | 16d | 1 | 0.34mi |
| 9603 Vinca Cir Unit D Charlotte, NC | 2.0 | 2.0 | 850 | $1,300 | $1.53 | 16d | 1 | 0.34mi |
| 9629 Vinca Cir Rm 1 Charlotte, NC | 1.0 | 1.0 | 800 | $1,550 | $1.94 | 5d | 1 | 0.34mi |
| 9629 Vinca Cir Unit H Charlotte, NC | 2.0 | 2.0 | 836 | $1,550 | $1.85 | 5d | 1 | 0.34mi |
| Vinca Cir Charlotte, NC | 2.0 | 2.0 | 850 | $1,350 | $1.59 | 24d | 1 | 0.36mi |
| 9607 Vinca Cir Unit F Charlotte, NC | 2.0 | 2.0 | 847 | $1,300 | $1.53 | 24d | 1 | 0.37mi |
| 9617 Vinca Cir Unit G Charlotte, NC | 2.0 | 2.0 | 839 | $1,450 | $1.73 | 8d | 1 | 0.43mi |
| 1614 Arlyn Cir Unit M Charlotte, NC | 3.0 | 2.0 | 847 | $1,500 | $1.77 | 24d | 1 | 0.45mi |
| 2410 Allerton Way Charlotte, NC | 1.0–3.0 | 1.0–2.0 | 1202 | $1,594 | $1.33 | 2d | 21 | 0.50mi |
| 1600 Arlyn Cir Charlotte, NC | 3.0 | 2.0 | 857 | $1,300 | $1.52 | 19d | 1 | 0.52mi |
| 1630 Arlyn Cir Charlotte, NC | 1.0 | 1.0 | 850 | $550 | $0.65 | 24d | 1 | 0.54mi |
| Arlyn Cir Charlotte, NC | 3.0 | 2.0 | 950 | $1,400 | $1.47 | 24d | 1 | 0.55mi |
| 9179 Meadow Vista Rd Charlotte, NC | 2.0 | 2.0 | 1104 | $1,500 | $1.36 | 24d | 1 | 0.59mi |
| 1649 Arlyn Cir Charlotte, NC | 1.0 | 1.0 | 920 | $625 | $0.68 | 24d | 1 | 0.61mi |
| 1645 Arlyn Cir Unit A Charlotte, NC | 2.0 | 2.0 | 847 | $1,420 | $1.68 | 15d | 1 | 0.64mi |
| 8215 University Ridge Dr Charlotte, NC | 1.0–3.0 | 1.0–2.0 | 1018 | $1,406 | $1.38 | 2d | 14 | 0.65mi |
| 8913 Meadow Vista Rd Charlotte, NC | 2.0 | 2.0 | 1016 | $1,275 | $1.25 | 22d | 1 | 0.67mi |
| 5315 Waters Edge Village Dr Charlotte, NC | 3.0 | 1.0–2.0 | 1239 | $2,737 | $2.21 | 2d | 41 | 1.07mi |
| 6205 Dove Tree Ln Charlotte, NC | 1.0–2.0 | 1.0–2.0 | 911 | $1,429 | $1.57 | 2d | 7 | 1.12mi |
| 1200 Campus Pointe Ct Charlotte, NC | 1.0–3.0 | 1.0–3.0 | 893 | $1,230 | $1.38 | 24d | 9 | 1.16mi |
| 1720 Rocky River Rd Charlotte, NC | 1.0–2.0 | 1.0–2.0 | 967 | $1,999 | $2.07 | 2d | 10 | 1.19mi |
| 1702 Rocky River Rd W Charlotte, NC | 1.0 | 1.0 | 736 | $1,599 | $2.17 | 4d | 1 | 1.24mi |
| 305 Prine Pl Charlotte, NC | 3.0 | 1.0–2.0 | 1019 | $2,151 | $2.11 | 2d | 34 | 1.36mi |
| 529 Lex Dr Charlotte, NC | 3.0 | 2.5 | 1110 | $1,700 | $1.53 | 22d | 1 | 1.41mi |
| 8340 N Tryon St Charlotte, NC | 1.0 | 1.0 | 467 | $1,425 | $3.05 | 2d | 25 | 1.43mi |
| 8424 N Tryon St Charlotte, NC | 1.0–2.0 | 1.0–2.0 | 939 | $1,935 | $2.06 | 2d | 25 | 1.45mi |
HOA detail condo
- Monthly dues
- $267 · $3,204/yr
- Assessments
- None detected in remarks — confirm with the listing agent.
Listing history 21 events
-
2026-06-18days on market $146,000 Active 140 DOM
-
2026-06-17days on market $146,000 Active 139 DOM
-
2026-06-16days on market $146,000 Active 138 DOM
-
2026-06-15days on market $146,000 Active 137 DOM
-
2026-06-13days on market $146,000 Active 135 DOM
-
2026-06-10days on market $146,000 Active 131 DOM
-
2026-06-08days on market $146,000 Active 130 DOM
-
2026-06-07days on market $146,000 Active 129 DOM
-
2026-06-04days on market $146,000 Active 126 DOM
-
2026-06-03days on market $146,000 Active 125 DOM
-
2026-06-02days on market $146,000 Active 124 DOM
-
2026-06-02days on market $146,000 Active 123 DOM
-
2026-05-31days on market $146,000 Active 122 DOM
-
2026-05-01status Active
-
2026-03-06price $146,000
-
2026-01-29$147,500 Active
-
2026-01-28historical $147,500
-
2022-08-12price $1,250
-
2022-02-14soldstatus $126,000
-
1988-06-01soldstatus $50,000
-
1986-03-01soldstatus $51,000
ⓘ Source: listings_history table (triggers on properties + properties_extension) + one-shot
backfill from property_details.listing_events for pre-trigger history.
Tax reassessment forecast NC · Resets to sale price
- Current annual tax
- $1,016 · $85/mo
- Projected year-2 tax
- $1,197 · $100/mo
- Expected delta
- +$181/yr (+$15/mo · 17.8%)
ⓘ Screening estimate from a state-policy table — verify with the county assessor before closing.
Climate risk First Street
- Flood 1/10 Low FEMA zone X (unshaded) · 0% chance over 30 yrs
- Wildfire 1/10 Low
- Heat 6/10 Major 7 d/yr ≥104°F today · 17 d/yr by 30 yrs out
- Wind 5/10 Major 25% chance of damaging wind over 30 yrs
- Air quality 4/10 Moderate 4 unhealthy d/yr today · 5 by 30 yrs out
Nearby sold comps map
Loading sold comps map…
Walkable amenities ~0.75 mi
Loading nearby amenities…
Taxation est. · year 1
- Rental income
- $17,260
- − Mortgage interest
- −$8,178
- − Property taxes
- −$1,016
- − Insurance
- −$730
- − Repairs & maintenance
- −$1,381
- − Management
- −$1,381
- − HOA
- −$3,204
- − Depreciation
- −$4,247
- Taxable loss
- −$2,877
- Est. tax savings @ 24.0%
- +$691
- After-tax cash flow
- $188/yr
For passive investors: Depreciation is non-cash, so a rental often shows a tax loss while cash-flowing — sheltering income. Rental losses are passive: they offset passive income freely, and up to $25,000/yr can offset ordinary (W-2) income if you actively participate and your MAGI is under $100k (phasing out to $0 by $150k); unused losses carry forward. On sale, claimed depreciation is recaptured at up to 25%, and gains may owe capital-gains tax (a 1031 exchange can defer both). Figures are a year-1 estimate at your 24.0% rate — not tax advice; consult a CPA.
Schools (NCES district)
- District
- Charlotte-Mecklenburg Schools
- NCES district ID
- 3702970
- Math proficiency
- 42% ▼ -6.00%
- Reading proficiency
- 46% ▲ 1.00%
- Median HH income
- $57,175
- Composite
- 38.49/100
- National rank
- #4183
- State rank
- #85 of 178 in NC
Livability — Charlotte
- Score
- 78/100
- State rank
- #26
- US rank
- #2502
Category grades
Schools grade is shown separately in the Schools card above.
Census & demographics
- Census place
- Charlotte, NC
- County
- Mecklenburg County · 1,167,319 people
- City population
- 920,422
- Metro
- Charlotte-Concord-Gastonia, NC-SC
- Population (ZIP)
- 45,904
- Household income
- $58,146
- Rent vs Own
- Severe rent burden
- 3547.0
Population outlook (Mecklenburg County) Hauer SSP2
- Today (2025)
- 1,305,740 people
- By 2030
- 1,442,752 · +10.5%
- By 2040
- 1,722,441 · +31.9%
- By 2050
- 1,999,450 · +53.1%
- By 2075
- 2,642,495 · +102.4%
- By 2100
- 3,106,755 · +137.9%
Race, ethnicity, and origin ACS 2023
- Neighborhood character
- Diverse neighborhood (Simpson 0.66)
- Race & ethnicity
- Black 48% Hispanic / Latino 27% White 18% Two or more races 9% Asian 4%
- Hispanic origin (detail)
- Mexican 13% Puerto Rican 1% Dominican 2%
- Common ancestry
- Romanian 1% Lithuanian 1% Italian 1%
- Foreign-born
- 22% · Canada, Vietnam, China
- Languages at home
- 70% English-only · Spanish 23% Other Indo-European 1% Arabic 1%
Political lean MEDSL · Mecklenburg
- 2024 margin
- Solid D (+32.9) · D 65.6% · R 32.7% · Other 1.6%
- 2008→2024 swing
- +8.5pp toward D · 2008: 24.4pp · 2024: 32.9pp
- All cycles
- 2024: D+32.9 2020: D+35.1 2016: D+29.9 2012: D+22.5 2008: D+24.4
Not yet ingested
- Civics
- —
Market trends
- HPI YoY
- ▼ -88.12%
- Current HPI
- 265.9966
- Rent YoY
- ▲ 0.63%
- Metro
- Charlotte-Concord-Gastonia, NC-SC
- State GDP YoY
- ▲ 3.28%
- F500 in state
- 26
Industry mix (Fortune 500 HQ in NC)
| Industry | F500 HQs | Revenue |
|---|---|---|
| Financial Services | 2 | $213B |
|
||
| Retail | 2 | $95B |
|
||
| Industrial Conglomerate | 1 | $38B |
|
||
| Metals / Steel | 1 | $35B |
|
||
| Utilities | 1 | $30B |
|
||
| Industrial Machinery | 1 | $19B |
|
||
Price history
+186.3% since first listed8 events — show timeline
- 2026-05-01 Relisted — CANOPYMLS as Distributed by MLS Grid
- 2026-03-06 Price Changed $146,000 CANOPYMLS as Distributed by MLS Grid
- 2026-01-29 Listed $147,500 CANOPYMLS as Distributed by MLS Grid
- 2026-01-28 Coming Soon $147,500 CANOPYMLS as Distributed by MLS Grid
- 2022-08-12 Price Changed $1,250 RENT.
- 2022-02-14 Sold (Public Records) $126,000 Public Records
- 1988-06-01 Sold (Public Records) $50,000 Public Records
- 1986-03-01 Sold (Public Records) $51,000 Public Records
Property tax history
+5.8%/yrLatest (2025): $1,016 · +2.2% YoY. Source: county tax records.
Cash-flow waterfall
monthlySold comps — $/sqft
last 12 mo · ≤1 miLoading sold comps…