16 Rockledge Ave Unit 5K-1 · Ossining, NY
Flood risk No data
- FEMA flood zone
- —
- Chance of flooding over 30 yrs
- —
- Est. flood insurance / yr
- —
Fire risk No data
- Est. fire insurance / yr
- —
Heat risk No data
- Hot days now (above threshold)
- —
- Hot days in 30 yrs
- —
Wind risk No data
- Chance of severe wind over 30 yrs
- —
Air-quality risk No data
- Unhealthy air days now
- —
- Unhealthy air days in 30 yrs
- —
Risk factors via First Street. Map © Google.
Why this score? — see what drove the F grade
The composite is a weighted blend of 9 inputs, each scored 0–100. Each bar is that input's sub-score; the figure is the points it added to the 100-point composite (weight × sub-score).
- ARV discount +7.5/15.0
- Schools +6.4/10.0
- Livability +4.0/5.0
- Condition / age +3.8/5.0
- 1% rule +3.5/10.0
- Rent growth +2.5/5.0
- Cash flow +0.0/30.0
- DSCR +0.0/10.0
- Appreciation +0.0/10.0
$415,000
🖨 Deal sheet (PDF) 📄 Offer letter ✓ Due diligence
Listing remarks
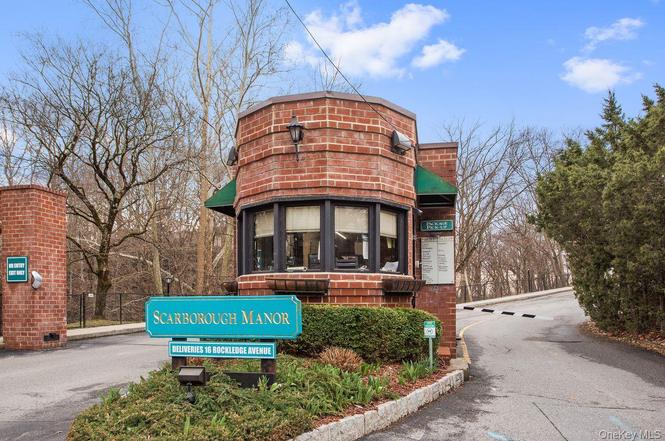
Welcome to Scarborough Manor, A Co-Op That Offers The Perfect Balance Of Tranquility And Convenience. This Fifth-Floor Beauty Offers A Rare Opportunity To Reside In A Serene And Sophisticated Setting Along The Majestic Hudson River. This Two Bedroom, Two Bath Stunner Has Nine Foot Ceilings, Oversized Rooms, And Tons Of Closet Space. This Unit Is Ideal For Hosting Intimate Gatherings Or Enjoying Quiet Evenings Overlooking The Hudson River. The Spacious Living And Dining Room Flow Naturally, Creating A Perfect Atmosphere for Entertaining. This 24 Hour Gated Community With A Gorgeous Clubhouse, Heated Pool, Sauna, Gym, Billiard Room, Ping Pong, And Library Are All Included In The Monthly Maint
Key facts
- Gated community
- Fifth-floor
- Sauna
Tags
Neighborhood map
What this means for you Summary
Snapshot
- This is a 2-bed/2.0-bath condo listed at $415k. Condition is rated good.
Deal economics
- At list price, monthly cash flow is $-2k ($-25k/yr) — negative.
- To cash-flow at today's rent, offer at most $405k (2.3% below list).
- To meet the 1% rule (rent ≥ 1% of price), the offer needs to be $355k (14.6% below list).
- Recommended offer: $355k (14.6% below list) — sets the bar for 1% rule.
- Cap rate 0.3% vs local median 2.9% in Ossining — below-typical yield; the buyer is paying a premium for something (appreciation thesis, condition, location) that the cap rate doesn't capture.
Location & tenants
- Location reads 80/100 on livability (#116 in NY, #1,876 nationally) — a professional / high-income tenant draw. Strengths: commute A+, employment A+, health & safety A; Watch: cost of living F.
- Ossining Union Free School District (suburban): math 72% / reading 72% proficiency, ranked #104 of 590 in NY (top 18%) — strong family-tenant draw, lease renewals of 3-5y typical.
- Zoned schools: Brookside School (727 students, 50% FRL); Anne M Dorner Middle School (math 42% / reading 64%, grade C+, #231 of 729 statewide, top 32%, 1,033 students, 51% FRL); Ossining High School (math 86% / reading 82%, grade A, #404 of 1,100 statewide, top 37%, 1,552 students, 51% FRL).
- Market conditions: 65 active listings in the ZIP; 5 comparable units currently listed for rent nearby; rentals leasing fast (median 6d on market — plan ~1-2 weeks tenant-placement turnaround); 954 units permitted in Westchester County in 2024 (649 in 5+ unit buildings).
Forward outlook
- Local home prices are declining (-3.0%/yr); year-one equity from $3k of loan paydown is wiped out by about $12k of value loss. Plan a longer hold.
- Westchester County population projected at +10% by 2050 — modest demand growth; plan on rents tracking national, not racing it.
Negotiation context
- Only 2 days on market — expect competitive offers; lowballing is unlikely to land.
Risks & watch-outs
- Watch-outs: HOA is 57% of rent.
Questions for the listing agent
- What do current leases actually rent for vs. the listed asking? Can we see a recent rent roll and the last 12 months of T-12 income?
- Built in 1968 — when were the roof, HVAC, electrical panel, plumbing, and water heater last replaced?
- What does the HOA fee cover, when was the last increase, and are there any pending special assessments or reserve-fund shortfalls?
- Any open or pending special assessments — roof, HVAC, plumbing, elevator, façade? What's the per-unit balance and payoff schedule, and is the seller paying it off at close or rolling it to the buyer?
- Is there a deadline driving the sale (1031 exchange, divorce, estate, relocation)? That informs how much negotiation room exists.
- Schools are D-rated, which usually means shorter tenancies and higher turnover. Who's the typical renter profile here, and what's been the actual vacancy rate?
- The area grade is low — what's the realistic commute time and amenity access for the typical tenant pool here? Any planned neighborhood developments (good or bad) we should know about?
- What's the average days-on-market for RENTAL listings here right now (not sales)? A rising rental-DOM trend means longer vacancies and softer asking-rent achievability than the comps imply.
- What's the recent tenant-quality profile in this submarket — average credit score on applications, eviction rate, late-payment / NSF rate, and stable-employment percentage? A property-management company in the area should have these aggregated.
- How much new apartment / multifamily construction is in the pipeline within 1–3 miles? Heavy new supply (>2% of stock underway) typically softens rents 12–24 months out; light construction supports rent growth.
Investment metrics
- 1% rule
- 0.85% ✗
- Cap rate
- 0.27%
- Cash-on-cash
- -21.52%
- DSCR
- 0.04
- GRM
- 9.8
CMA / ARV
No comps found within radius.
Projected returns pro-forma
-3.0% appreciation · 3.0% rent growth · sell at horizon
- IRR
- -61.0%
- Equity multiple
- -0.71×
- Total profit
- $-198,665
- Equity at exit
- $61,878
- IRR
- —
- Equity multiple
- -1.91×
- Total profit
- $-338,626
- Equity at exit
- $35,882
Cash invested: $116,200 (down + closing). Projections, not guarantees.
Landlord ↔ Tenant lean methodology
- Overall (STATE)
- 15 Strongly Tenant-Friendly
- State New York
- 15 Strongly Tenant-Friendly · D+10
- County
- — inherits STATE
- City
- — inherits STATE
ZIP-level market 10510
- Active inventory
- 65
- Price-to-rent
- 9.8×
Monthly cashflow live
- Estimated rent
- $3,546 medium interval (Pro) →
- Mortgage (P&I)
- −$2,176
- Tax est. 1.5%
- −$519 /mo · $6,225/yr
- Insurance
- −$173
- HOA est. from 2 same-building comps
- −$2,017
- Vacancy / Maint / Mgmt
- −$745
- Net cashflow
- $-2,084
Break-even live
Sensitivity live
| Price | -10% $-1,797 | -5% $-1,940 | +0% $-2,084 | +5% $-2,227 | +10% $-2,370 |
|---|---|---|---|---|---|
| Rent | -10% $-2,364 | -5% $-2,224 | +0% $-2,084 | +5% $-1,944 | +10% $-1,804 |
| Rate | -1.0pp $-1,875 | -0.5pp $-1,978 | base $-2,084 | +0.5pp $-2,191 | +1.0pp $-2,301 |
UW: 25.0% down · 7.5% · 30yr · 1.5% tax · 5.0% vac · 8.0% maint · 8.0% mgmt
Financing live
Cash to close
- Down payment
- $103,750
- Closing costs
- $12,450
- Reserves months
- —
- Total cash needed
- —
Loan-product check · same deal, 3 products live
Conventional
25% down · 7.5% · 30yr
- Down + closing
- —
- Monthly P&I
- —
- Monthly cashflow
- —
- DSCR
- —
- Eligible?
- —
Personal DTI + credit; lowest rate.
DSCR
20% down · 8.5% · 30yr
- Down + closing
- —
- Monthly P&I
- —
- Monthly cashflow
- —
- DSCR
- —
- Eligible?
- —
No personal income docs; deal must DSCR.
Hard money
10% down · 12.0% · 12mo
- Down + closing
- —
- Monthly P&I
- —
- Monthly cashflow
- —
- DSCR
- —
- Eligible?
- —
Short-term bridge; refi at stabilization.
Rent comps 5 comps
| Address | Beds | Baths | Sqft | Rent | $/sqft | DOM | Units | Dist |
|---|---|---|---|---|---|---|---|---|
| 8 Davids Ln Ossining, NY | 1.0 | 1.5 | 1452 | $3,700 | $2.55 | 0d | 1 | 0.24mi |
| 76 State St Unit 10 Ossining, NY | 3.0 | 1.0 | 1100 | $2,750 | $2.50 | 45d | 1 | 0.73mi |
| 90 S Highland Ave Unit 6 Ossining, NY | 2.0 | 1.5 | 1092 | $3,500 | $3.21 | 7d | 1 | 0.79mi |
| 1 Harbor Sq Ossining, NY | 1.0–2.0 | 1.0–2.5 | 894 | $5,795 | $6.48 | 0d | 9 | 1.01mi |
| 5 Brandreth St Unit 2A Ossining, NY | 3.0 | 2.0 | 1150 | $3,900 | $3.39 | 5d | 1 | 1.23mi |
HOA detail condo
- Monthly dues
- $0 · $0/yr
- Likely covers
- poolgymsecurity
- Assessments
- None detected in remarks — confirm with the listing agent.
Listing history 2 events
-
2026-03-24status Pending
-
2026-03-11$415,000 Active
ⓘ Source: listings_history table (triggers on properties + properties_extension) + one-shot
backfill from property_details.listing_events for pre-trigger history.
Nearby sold comps map
Loading sold comps map…
Walkable amenities ~0.75 mi
Loading nearby amenities…
Taxation est. · year 1
- Rental income
- $42,551
- − Mortgage interest
- −$23,246
- − Property taxes
- −$6,225
- − Insurance
- −$2,075
- − Repairs & maintenance
- −$3,404
- − Management
- −$3,404
- − HOA
- −$24,204
- − Depreciation
- −$12,073
- Taxable loss
- −$32,080
- Est. tax savings @ 24.0%
- +$7,699
- After-tax cash flow
- $-17,305/yr
For passive investors: Depreciation is non-cash, so a rental often shows a tax loss while cash-flowing — sheltering income. Rental losses are passive: they offset passive income freely, and up to $25,000/yr can offset ordinary (W-2) income if you actively participate and your MAGI is under $100k (phasing out to $0 by $150k); unused losses carry forward. On sale, claimed depreciation is recaptured at up to 25%, and gains may owe capital-gains tax (a 1031 exchange can defer both). Figures are a year-1 estimate at your 24.0% rate — not tax advice; consult a CPA.
Condition & rehab AI · 13 photos
This well-maintained, two-bedroom townhouse in Scarborough Manor offers a serene and sophisticated setting with a spacious living area and stunning Hudson River views. The property is in good condition with minimal repairs needed, making it an ideal investment for both resale and rental.
Value-add opportunities
- Both Painting the interior walls — Fresh paint can make the space feel new and vibrant
- Both Updating the kitchen backsplash — Modern backsplash can enhance the kitchen's appeal
- Both Upgrading the bathroom fixtures — Modern fixtures can improve the bathroom's functionality and aesthetics
Renovation cost estimate screening
Value-add ROI direction
- Both Painting the interior walls — Fresh paint can make the space feel new and vibrant ↑
- Both Updating the kitchen backsplash — Modern backsplash can enhance the kitchen's appeal ↑
- Both Upgrading the bathroom fixtures — Modern fixtures can improve the bathroom's functionality and aesthetics ↑
ⓘ Cost ranges are severity-bucket heuristics (US national rule-of-thumb). Get contractor quotes + a written scope before underwriting a rehab budget.
Schools (NCES district)
- District
- Ossining Union Free School District
- NCES district ID
- 3622020
- Math proficiency
- 72% ▲ 27.00%
- Reading proficiency
- 72% ▲ 25.00%
- Median HH income
- $78,402
- Composite
- 63.75/100
- National rank
- #599
- State rank
- #104 of 590 in NY
Livability — Ossining
- Score
- 80/100
- State rank
- #116
- US rank
- #1876
Category grades
Schools grade is shown separately in the Schools card above.
Census & demographics
- Census place
- Ossining, NY
- City population
- 33,793
- Population (ZIP)
- 10,027
Population outlook (Westchester County) Hauer SSP2
- Today (2025)
- 1,028,035 people
- By 2030
- 1,051,636 · +2.3%
- By 2040
- 1,098,520 · +6.9%
- By 2050
- 1,136,044 · +10.5%
- By 2075
- 1,196,925 · +16.4%
- By 2100
- 1,175,147 · +14.3%
Race, ethnicity, and origin ACS 2023
- Neighborhood character
- Predominantly White (76%)
- Race & ethnicity
- White 76% Two or more races 10% Hispanic / Latino 9% Asian 8% Black 1%
- Hispanic origin (detail)
- Puerto Rican 3% Cuban 2%
- Common ancestry
- Romanian 6% Scotch-Irish 6% Italian 2%
- Foreign-born
- 14% · Canada, China, South Korea
- Languages at home
- 82% English-only · Other Indo-European 7% Spanish 4% Chinese 2%
Political lean MEDSL · Westchester
- 2024 margin
- Strong D (+26.3) · D 63.1% · R 36.9%
- 2008→2024 swing
- -1.3pp toward R · 2008: 27.6pp · 2024: 26.3pp
- All cycles
- 2024: D+26.3 2020: D+36.3 2016: D+32.8 2012: D+22.2 2008: D+27.6
Not yet ingested
- Civics
- —
Market trends
- HPI YoY
- ▼ -328.79%
- Current HPI
- 253.8884
- Rent YoY
- —
- Metro
- —
- State GDP YoY
- ▲ 2.60%
- F500 in state
- 92
Industry mix (Fortune 500 HQ in NY)
| Industry | F500 HQs | Revenue |
|---|---|---|
| Financial Services | 10 | $950B |
|
||
| Consumer Goods | 9 | $162B |
|
||
| Insurance | 4 | $225B |
|
||
| Telecommunications | 2 | $144B |
|
||
| Pharmaceuticals | 2 | $112B |
|
||
| Media / Entertainment | 2 | $69B |
|
||
Price history
2 events — show timeline
- 2026-03-24 Pending — OneKey® MLS as Distributed by MLS Grid
- 2026-03-11 Listed $415,000 OneKey® MLS as Distributed by MLS Grid
Cash-flow waterfall
monthlySold comps — $/sqft
last 12 mo · ≤1 miLoading sold comps…