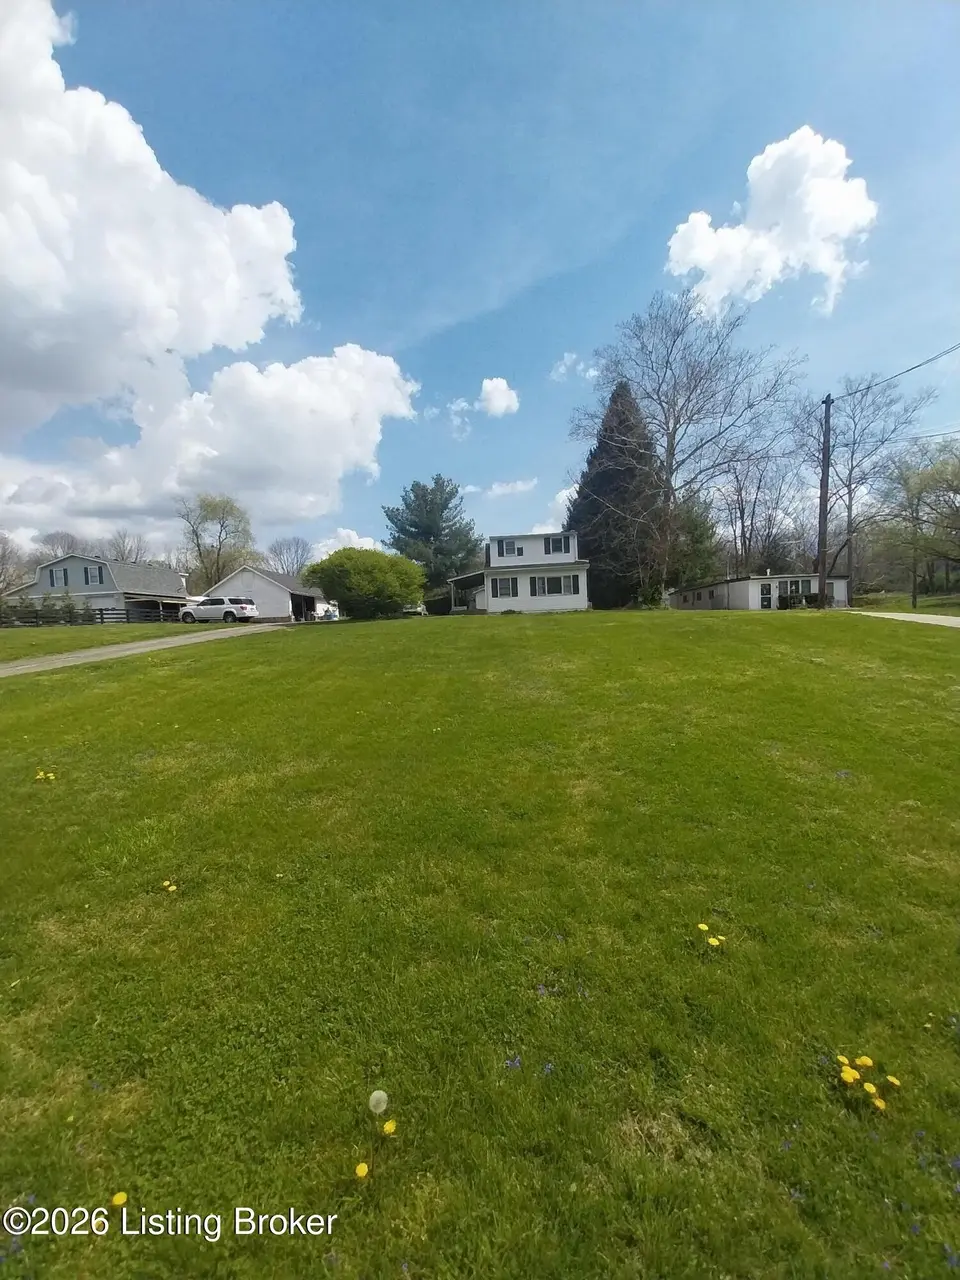
4105 Chenoweth Run Rd · Louisville/Jefferson County metro government (balance), KY
Flood risk 1/10 · Minimal
- FEMA flood zone
- X (unshaded)
- Chance of flooding over 30 yrs
- 0.0%
- Est. flood insurance / yr
- $507 – $1,088
Fire risk 1/10 · Minimal
- Est. fire insurance / yr
- $839 – $1,559
Heat risk 4/10 · Minor
- Hot days now (above 105°F)
- 7 days/yr
- Hot days in 30 yrs
- 20 days/yr
Wind risk 2/10 · Minimal
- Chance of severe wind over 30 yrs
- 2.0%
Air-quality risk 3/10 · Minor
- Unhealthy air days now
- 2 days/yr
- Unhealthy air days in 30 yrs
- 5 days/yr
Risk factors via First Street. Map © Google.
Why this score? — see what drove the B- grade
The composite is a weighted blend of 9 inputs, each scored 0–100. Each bar is that input's sub-score; the figure is the points it added to the 100-point composite (weight × sub-score).
- Cash flow +26.0/30.0
- ARV discount +15.0/15.0
- DSCR +8.7/10.0
- 1% rule +6.2/10.0
- Rent growth +3.6/5.0
- Livability +2.5/5.0
- Condition / age +2.5/5.0
- Schools +2.3/10.0
- Appreciation +0.0/10.0
$189,900
🖨 Deal sheet 📄 Offer letter ✓ Due diligence
Listing remarks
HARD TO FIND PRICE IN THIS AREA! GREAT LOCATION!! NICE LOT . 82 ACRES. 4 BEDROOMS 2 BATHS BASEMENT. HOUSE NEEDS WORK! SOLD AS IS!! GREAT POTENTIAL! CASH/CONVENTIONAL ONLY!! EASY TO SHOW!
Key facts
- 0.82 acre lot
- Parking
- Built 1910
Property features AI
Finance
- HOA & community: No association fee
Exterior
- Parking: Driveway
- Utilities: Electricity connected; Natural gas available
- Home design: Single-family residence; 2-story home; Built in 1910
- Construction: Vinyl siding; Shingle roof; Foundation: crawl space and poured concrete
- Exterior features: Partial wood fencing; Cleared, level lot (approximately 0.82 acres)
Interior
- Kitchen: Kitchen on the first floor
- Bedrooms: 4 bedrooms total; Primary bedroom on the first floor; Three bedrooms on the second floor
- Bathrooms: 2 full bathrooms; Full bathrooms located on the second floor
- Heating & cooling: Forced air heating; Central air conditioning
- Interior features: 7 total rooms; Unfinished basement
- Laundry & utility: No first-floor laundry
Neighborhood map
What this means for you Summary
Snapshot
- This is a 4-bed/2.0-bath single-family listed at $190k.
Deal economics
- At list price, monthly cash flow is $470 ($6k/yr) — positive.
- The deal already cash-flows at list — no discount required.
- Meets the 1% rule at list price ($2k rent vs $190k).
- Cap rate 9.3% vs local median 4.0% in Louisville/Jefferson County metro government (balance) — top-decile yield for the area; either an underpriced asset or a hidden risk that comps aren't pricing in. Stress-test before assuming the spread holds.
Location & tenants
- Location reads: area grade B — affects rentability + tenant quality, not the cash-flow math above.
- Jefferson County (urban): math 19% / reading 35% proficiency, ranked #121 of 165 in KY (top 73%) — low school quality limits family demand, transient renter base, plan for 1-2y turnover.
- Market conditions: Rents rising fast (+4.3%/yr); 228 active listings in the ZIP; 4 comparable units currently listed for rent nearby; rentals at typical pace (median 24d on market — plan ~3-4 weeks tenant-placement turnaround); solid renter incomes; 2,836 units permitted in Jefferson County in 2024 (1,558 in 5+ unit buildings).
Forward outlook
- Local home prices are declining (-3.0%/yr); year-one equity from $1k of loan paydown is wiped out by about $6k of value loss. Plan a longer hold.
- Jefferson County population projected at +13% by 2050 — modest demand growth; plan on rents tracking national, not racing it.
- At projected returns (-3.0% appreciation + 4.3% rent growth), your $53k cash investment doubles in ~9 years — after that, you're playing with house money.
Negotiation context
- Only 4 days on market — expect competitive offers; lowballing is unlikely to land.
- Current owner paid $106k; list at $190k implies a 78% gain — meaningful room to come down on a strong offer.
Risks & watch-outs
- Watch-outs: built in 1910 — expect roof / HVAC / electrical / plumbing capex.
Questions for the listing agent
- Built in 1910 — when were the roof, HVAC, electrical panel, plumbing, and water heater last replaced?
- Is there a deadline driving the sale (1031 exchange, divorce, estate, relocation)? That informs how much negotiation room exists.
- What's the average days-on-market for RENTAL listings here right now (not sales)? A rising rental-DOM trend means longer vacancies and softer asking-rent achievability than the comps imply.
- What's the recent tenant-quality profile in this submarket — average credit score on applications, eviction rate, late-payment / NSF rate, and stable-employment percentage? A property-management company in the area should have these aggregated.
- How much new for-sale + rental construction is in the pipeline within 1–3 miles? Heavy new supply typically softens prices + rents 12–24 months out; constrained supply supports both.
Investment metrics
- 1% rule
- 1.12% ✓
- Cap rate
- 9.26%
- Cash-on-cash
- 10.60%
- DSCR
- 1.47
- GRM
- 7.4
CMA / ARV
- ARV (on-the-fly)
- $324,000
- Comps found
- 12
Show comp detail 12 sales within ~0.75 mi
| Address | Dist | Beds/Ba | Sqft | Sold | Price | $/sf | Match |
|---|---|---|---|---|---|---|---|
| 4105 Chenoweth Run Rd | 0.00mi | 4/2.0 | 2,000 (0%) | 1mo | $160,000 | $80 | 99 |
| 4123 Willowview Blvd | 0.35mi | 4/2.0 | 2,035 (+2%) | 6mo | $325,000 | $160 | 76 |
| 4227 Willowview Blvd | 0.24mi | 3/2.5 (-1) | 1,976 (-1%) | 7mo | $310,000 | $157 | 74 |
| 11411 Catalpa View Ct | 0.35mi | 4/2.0 | 2,073 (+4%) | 11mo | $325,000 | $157 | 68 |
| 11505 Magnolia View Ct | 0.32mi | 4/2.0 | 1,717 (-14%) | 6mo | $290,000 | $169 | 56 |
| 4405 Burgundy Dr | 0.57mi | 4/2.0 | 1,816 (-9%) | 4mo | $307,500 | $169 | 55 |
| 4031 Bolling Brook Dr | 0.48mi | 3/3.0 (-1) | 2,105 (+5%) | 10mo | $441,000 | $210 | 51 |
| 10401 Mimosa View Ct | 0.70mi | 4/2.0 | 1,750 (-12%) | 2mo | $320,000 | $183 | 45 |
| 3907 Pinoak View Ct | 0.62mi | 3/2.0 (-1) | 1,730 (-14%) | 1mo | $309,500 | $179 | 43 |
| 10910 Aspenview Ct | 0.51mi | 3/2.0 (-1) | 2,255 (+13%) | 9mo | $345,000 | $153 | 42 |
| 4407 Burgundy Dr | 0.57mi | 3/2.0 (-1) | 1,756 (-12%) | 8mo | $285,000 | $162 | 41 |
| 4205 Mimosa View Dr | 0.63mi | 3/2.0 (-1) | 1,710 (-14%) | 5mo | $275,000 | $161 | 37 |
Match score weights: distance 35% · size 25% · config 20% · recency 20%. Top-matched comps best support the ARV.
Projected returns pro-forma
-3.0% appreciation · 4.34% rent growth · sell at horizon
- IRR
- 1.0%
- Equity multiple
- 1.04×
- Total profit
- $2,038
- Equity at exit
- $28,315
- IRR
- 11.8%
- Equity multiple
- 1.99×
- Total profit
- $52,499
- Equity at exit
- $16,419
Cash invested: $53,172 (down + closing). Projections, not guarantees.
Landlord ↔ Tenant lean methodology
- Overall (STATE)
- 83 Strongly Landlord-Friendly
- State Kentucky
- 83 Strongly Landlord-Friendly · R+16
- County
- — inherits STATE
- City
- — inherits STATE
ZIP-level market 40299
- Rents YoY
- 4.3%
- Active inventory
- 228
- Price-to-rent
- 7.4×
Monthly cashflow live
- Estimated rent
- $2,136 medium interval (Pro) →
- Mortgage (P&I)
- −$996
- Tax from tax record
- −$142 /mo · $1,710/yr
- Insurance
- −$79
- HOA
- −$0
- Vacancy / Maint / Mgmt
- −$448
- Net cashflow
- $470
Break-even live
UW: 25.0% down · 7.5% · 30yr · 1.5% tax · 5.0% vac · 8.0% maint · 8.0% mgmt
Financing live
Cash to close
- Down payment
- $47,475
- Closing costs
- $5,697
- Reserves months
- —
- Total cash needed
- —
Loan-product check · same deal, 3 products live
Conventional
25% down · 7.5% · 30yr
- Down + closing
- —
- Monthly P&I
- —
- Monthly cashflow
- —
- DSCR
- —
- Eligible?
- —
Personal DTI + credit; lowest rate.
DSCR
20% down · 8.5% · 30yr
- Down + closing
- —
- Monthly P&I
- —
- Monthly cashflow
- —
- DSCR
- —
- Eligible?
- —
No personal income docs; deal must DSCR.
Hard money
10% down · 12.0% · 12mo
- Down + closing
- —
- Monthly P&I
- —
- Monthly cashflow
- —
- DSCR
- —
- Eligible?
- —
Short-term bridge; refi at stabilization.
Rent comps 4 comps
| Address | Beds | Baths | Sqft | Rent | $/sqft | DOM | Units | Dist |
|---|---|---|---|---|---|---|---|---|
| 10717 Bayport Rd Louisville, KY | 3.0 | 2.0 | 1660 | $1,995 | $1.20 | 23d | 1 | 0.38mi |
| 4118 Hickoryview Dr Louisville, KY | 3.0 | 1.5 | 1456 | $2,000 | $1.37 | 15d | 1 | 0.58mi |
| 4007 Mimosa View Dr Louisville, KY | 3.0 | 2.0 | 1720 | $2,100 | $1.22 | 23d | 1 | 0.63mi |
| 4006 Mimosa View Dr Louisville, KY | 3.0 | 2.5 | 1652 | $2,150 | $1.30 | 14d | 1 | 0.65mi |
Listing history 3 events
-
2026-05-15status Pending
-
2026-05-11$189,900 Active
-
2014-05-14soldstatus $106,500
ⓘ Source: listings_history table (triggers on properties + properties_extension) + one-shot
backfill from property_details.listing_events for pre-trigger history.
Tax reassessment forecast KY · Resets to sale price
- Current annual tax
- $1,710 · $142/mo
- Projected year-2 tax
- $1,710 · $142/mo
- Expected delta
- $0/yr ($0/mo · -0.0%)
ⓘ Screening estimate from a state-policy table — verify with the county assessor before closing.
Climate risk First Street
- Flood 1/10 Low FEMA zone X (unshaded) · 0% chance over 30 yrs
- Wildfire 1/10 Low
- Heat 4/10 Moderate 7 d/yr ≥105°F today · 20 d/yr by 30 yrs out
- Wind 2/10 Low 2% chance of damaging wind over 30 yrs
- Air quality 3/10 Moderate 2 unhealthy d/yr today · 5 by 30 yrs out
Nearby sold comps map
Loading sold comps map…
Walkable amenities ~0.75 mi
Loading nearby amenities…
Taxation est. · year 1
- Rental income
- $25,629
- − Mortgage interest
- −$10,637
- − Property taxes
- −$1,710
- − Insurance
- −$950
- − Repairs & maintenance
- −$2,050
- − Management
- −$2,050
- − Depreciation
- −$5,524
- Taxable income
- $2,707
- Est. tax owed @ 24.0%
- −$650
- After-tax cash flow
- $4,987/yr
For passive investors: Depreciation is non-cash, so a rental often shows a tax loss while cash-flowing — sheltering income. Rental losses are passive: they offset passive income freely, and up to $25,000/yr can offset ordinary (W-2) income if you actively participate and your MAGI is under $100k (phasing out to $0 by $150k); unused losses carry forward. On sale, claimed depreciation is recaptured at up to 25%, and gains may owe capital-gains tax (a 1031 exchange can defer both). Figures are a year-1 estimate at your 24.0% rate — not tax advice; consult a CPA.
Schools (NCES district)
- District
- Jefferson County
- NCES district ID
- 2102990
- Math proficiency
- 19% ▼ -17.00%
- Reading proficiency
- 35% ▼ -11.00%
- Median HH income
- $47,885
- Composite
- 23.45/100
- National rank
- #7884
- State rank
- #121 of 165 in KY
Livability — Louisville/Jefferson County metro government (balance)
No livability data for this city. (Only ~50 U.S. cities are tracked.)
Census & demographics
- Census place
- Louisville/Jefferson County metro government (balance), KY
- County
- Jefferson County · 790,184 people
- City population
- 419,741
- Metro
- Louisville/Jefferson County, KY-IN
- Population (ZIP)
- 42,207
- Household income
- $89,440
- Rent vs Own
- Severe rent burden
- 887.0
Population outlook (Jefferson County) Hauer SSP2
- Today (2025)
- 823,112 people
- By 2030
- 849,343 · +3.2%
- By 2040
- 895,696 · +8.8%
- By 2050
- 933,630 · +13.4%
- By 2075
- 1,028,262 · +24.9%
- By 2100
- 1,072,675 · +30.3%
Race, ethnicity, and origin ACS 2023
- Neighborhood character
- Predominantly White (79%)
- Race & ethnicity
- White 79% Black 11% Two or more races 6% Hispanic / Latino 5% Asian 2%
- Common ancestry
- Romanian 2% Slovak 2% Italian 2%
- Foreign-born
- 7% · Canada, China, India
- Languages at home
- 91% English-only · Spanish 3% Other Indo-European 2% Russian/Polish/Slavic 1%
Political lean MEDSL · Jefferson
- 2024 margin
- D (+16.6) · D 57.4% · R 40.9% · Other 1.7%
- 2008→2024 swing
- +4.5pp toward D · 2008: 12.0pp · 2024: 16.6pp
- All cycles
- 2024: D+16.6 2020: D+20.1 2016: D+13.3 2012: D+11.1 2008: D+12.0
Not yet ingested
- Civics
- —
Market trends
- HPI YoY
- ▼ -259.19%
- Current HPI
- 220.9191
- Rent YoY
- ▲ 4.34%
- Metro
- Louisville/Jefferson County, KY-IN
- State GDP YoY
- ▲ 1.81%
- F500 in state
- 4
Industry mix (Fortune 500 HQ in KY)
| Industry | F500 HQs | Revenue |
|---|---|---|
| Healthcare | 1 | $118B |
|
||
| Food / Beverage | 1 | $7B |
|
||
Price history
+78.3% since first listed3 events — show timeline
- 2026-05-15 Pending — Metro Search MLS
- 2026-05-11 Listed $189,900 Metro Search MLS
- 2014-05-14 Sold (Public Records) $106,500 Public Records
Property tax history
+6.2%/yrLatest (2025): $1,710 · +0.5% YoY. Source: county tax records.
Cash-flow waterfall
monthlySold comps — $/sqft
last 12 mo · ≤1 miLoading sold comps…