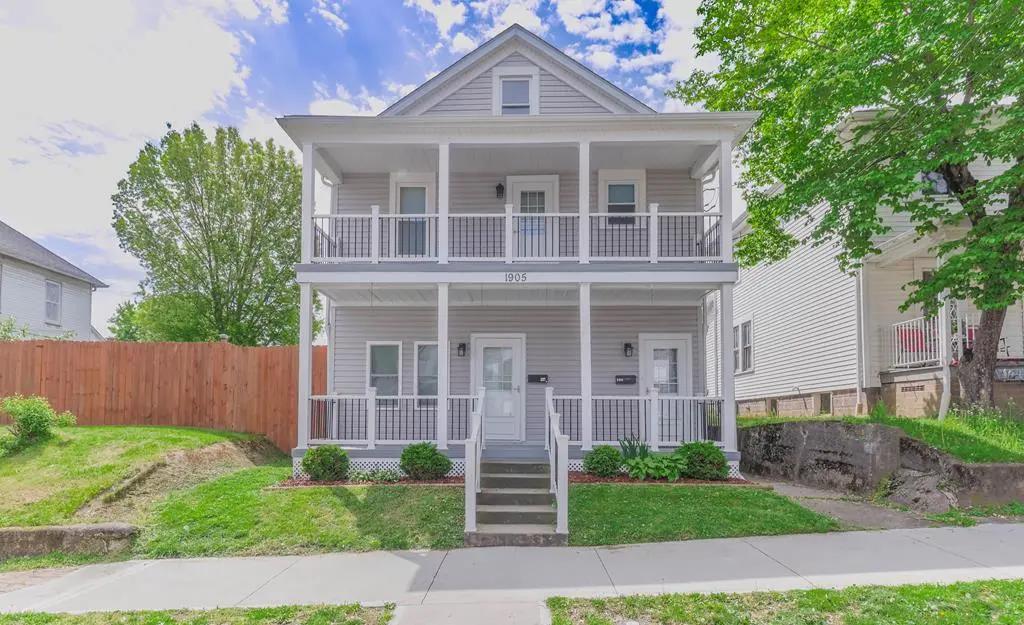
 Triplex
1905-1909 Second St · Moundsville, WV
Flood risk 1/10 · Minimal
- FEMA flood zone
- X (unshaded)
- Chance of flooding over 30 yrs
- 0.0%
- Est. flood insurance / yr
- $473 – $860
Fire risk 1/10 · Minimal
- Est. fire insurance / yr
- $787 – $1,461
Heat risk 4/10 · Minor
- Hot days now (above 99°F)
- 8 days/yr
- Hot days in 30 yrs
- 20 days/yr
Wind risk 1/10 · Minimal
- Chance of severe wind over 30 yrs
- 0.0%
Air-quality risk 2/10 · Minimal
- Unhealthy air days now
- 1 days/yr
- Unhealthy air days in 30 yrs
- 3 days/yr
Risk factors via First Street. Map © Google.
Why this score? — see what drove the C+ grade
The composite is a weighted blend of 9 inputs, each scored 0–100. Each bar is that input's sub-score; the figure is the points it added to the 100-point composite (weight × sub-score).
- Cash flow +30.0/30.0
- 1% rule +10.0/10.0
- DSCR +10.0/10.0
- Livability +3.3/5.0
- Schools +2.7/10.0
- Rent growth +2.5/5.0
- Condition / age +2.5/5.0
- ARV discount +0.0/15.0
- Appreciation +0.0/10.0
$160,000
🖨 Deal sheet 📄 Offer letter ✓ Due diligence
Multi-family units
County records classify this as Multi-Family (2-4 Unit). Listing-text estimate: 3 units. confirmed
Listing remarks
Do not miss out on this investment opportunity! This duplex includes a 1-car garage and additional private parking, plus a large 2-car garage that can be used as additional storage or rented space. First level of the duplex includes front porch, separate entry, living room, kitchen, dining room, bedroom, bathroom, laundry closet with access to basement, back porch overlooking expansive fenced in yard. Second level of the duplex includes separate entry, covered balcony, living room, eat-in kitchen, 2 bedrooms, and bathroom. Updates to exterior of the property, plus updates throughout both interior levels. Move-in ready!
Key facts
- Large 2 car garage
- Kitchen
- Front porch
Tags
Property features AI
Finance
- Other: No additional financial amenities provided
- Financial info: No investor or income/expense details provided
- HOA & community: No HOA information provided
Exterior
- Parking: No parking details provided
- Security: No security details provided
- Utilities: Public water; Public sewer
- Home design: Up-and-down duplex; Residential income property; 2-story building
- Construction: Vinyl siding
- Exterior features: Residential zoning
Interior
- Kitchen: No kitchen appliance details provided
- Bedrooms: One 1-bedroom unit; One 2-bedroom unit
- Flooring: Carpet
- Bathrooms: Each unit has 1 bathroom
- Heating & cooling: Central air; Window unit(s); Forced air heating; Natural gas heating
- Interior features: Electric water heater; Carpet flooring
- Laundry & utility: No laundry details provided
Neighborhood map
What this means for you Summary
Snapshot
- This is a 3 × 3-bed/2.0-bath units multifamily listed at $160k.
Deal economics
- At list price, monthly cash flow is $867 ($10k/yr) — positive. Per door: $289/mo.
- The deal already cash-flows at list — no discount required.
- Meets the 1% rule at list price ($2k rent vs $160k).
- Recommended offer: $158k (1.5% below list) — sets the bar for market timing.
- Cap rate 12.8% vs local median 4.7% in Moundsville — top-decile yield for the area; either an underpriced asset or a hidden risk that comps aren't pricing in. Stress-test before assuming the spread holds.
Location & tenants
- Location reads 66/100 on livability (#105 in WV) — a middle-class / working-renter tenant base. Strengths: cost of living A+, housing A-, health & safety A-; Watch: schools D+, amenities F, commute F.
- Marshall County Schools (suburban): math 28% / reading 36% proficiency, ranked #21 of 55 in WV (top 38%) — families likely to look elsewhere, expect single-tenant / working-renter base with shorter leases.
- Market conditions: 78 active listings in the ZIP; 6 units permitted in Marshall County in 2024 (0 in 5+ unit buildings).
- At $2,497/mo this rent would consume 54% of the median local household income ($56k/yr) — very limited rent-growth headroom before tenants either downsize or default.
Forward outlook
- Local home prices are declining (-3.0%/yr); year-one equity from $1k of loan paydown is wiped out by about $5k of value loss. Plan a longer hold.
- Marshall County population projected at -19% by 2050 — secular population decline; favor cash flow + early exit over multi-decade hold.
- At projected returns (-3.0% appreciation + 3.0% rent growth), your $45k cash investment doubles in ~6 years — after that, you're playing with house money.
Negotiation context
- It's been on market 22 days — a 2% lower offer ($158k) is reasonable based on typical stale-listing flexibility.
- 3 sale attempts since 25y ago with the ask held roughly flat each time — persistent listings suggest the price (not the market) is what's stuck; bring a comps-based counter.
- Current owner paid $27k; list at $160k implies a 493% gain — meaningful room to come down on a strong offer.
Risks & watch-outs
- Watch-outs: built in 1905 — expect roof / HVAC / electrical / plumbing capex.
Questions for the listing agent
- Can we see the unit-by-unit rent roll, current vacancy, and any below-market leases? What's the average tenancy length?
- What capital expenditures (roof, boiler, parking lot, exteriors) have been made in the last 5 years, and what's planned in the next 2?
- Built in 1905 — when were the roof, HVAC, electrical panel, plumbing, and water heater last replaced?
- Is there a deadline driving the sale (1031 exchange, divorce, estate, relocation)? That informs how much negotiation room exists.
- Schools are D-rated, which usually means shorter tenancies and higher turnover. Who's the typical renter profile here, and what's been the actual vacancy rate?
- What's the average days-on-market for RENTAL listings here right now (not sales)? A rising rental-DOM trend means longer vacancies and softer asking-rent achievability than the comps imply.
- What's the recent tenant-quality profile in this submarket — average credit score on applications, eviction rate, late-payment / NSF rate, and stable-employment percentage? A property-management company in the area should have these aggregated.
- How much new apartment / multifamily construction is in the pipeline within 1–3 miles? Heavy new supply (>2% of stock underway) typically softens rents 12–24 months out; light construction supports rent growth.
Investment metrics
- 1% rule
- 1.56% ✓
- Cap rate
- 12.79%
- Cash-on-cash
- 23.22%
- DSCR
- 2.03
- GRM
- 5.3
CMA / ARV
- ARV (on-the-fly)
- $124,000
- Comps found
- 3
Show comp detail 3 sales within ~0.75 mi
| Address | Dist | Beds/Ba | Sqft | Sold | Price | $/sf | Match |
|---|---|---|---|---|---|---|---|
| 1710 Center St | 0.13mi | 4/2.0 (+1) | 1,907 (-5%) | 12mo | $55,000 | $29 | 71 |
| 1006-1008 Sixth St | 0.63mi | 3/2.0 | 1,802 (-10%) | 1mo | $111,000 | $62 | 53 |
| 1301 Ninth St | 0.65mi | 4/2.0 (+1) | 2,150 (+8%) | 14mo | $154,000 | $72 | 40 |
Match score weights: distance 35% · size 25% · config 20% · recency 20%. Top-matched comps best support the ARV.
Projected returns pro-forma
-3.0% appreciation · 3.0% rent growth · sell at horizon
- IRR
- 16.3%
- Equity multiple
- 1.65×
- Total profit
- $29,325
- Equity at exit
- $23,857
- IRR
- 24.9%
- Equity multiple
- 3.16×
- Total profit
- $96,785
- Equity at exit
- $13,834
Cash invested: $44,800 (down + closing). Projections, not guarantees.
Landlord ↔ Tenant lean methodology
- Overall (STATE)
- 83 Strongly Landlord-Friendly
- State West Virginia
- 83 Strongly Landlord-Friendly · R+22
- County
- — inherits STATE
- City
- — inherits STATE
ZIP-level market 26041
- Home prices YoY
- -24.8%
- Active inventory
- 78
- Price-to-rent
- 16.0×
Monthly cashflow live
- Estimated rent
- $2,497 medium interval (Pro) →
- Mortgage (P&I)
- −$839
- Tax est. 1.5%
- −$200 /mo · $2,400/yr
- Insurance
- −$67
- HOA
- −$0
- Vacancy / Maint / Mgmt
- −$524
- Net cashflow
- $867
Break-even live
3-unit breakdown (identical units grouped — click to expand)
| Units | Beds | Baths | Est. rent |
|---|---|---|---|
| 3× units | 3 | 2 | $2,496 |
| #1 | 3 | 2 | $832 |
| #2 | 3 | 2 | $832 |
| #3 | 3 | 2 | $832 |
| Total (3 units) | $2,497 | ||
UW: 25.0% down · 7.5% · 30yr · 1.5% tax · 5.0% vac · 8.0% maint · 8.0% mgmt
Financing live
Cash to close
- Down payment
- $40,000
- Closing costs
- $4,800
- Reserves months
- —
- Total cash needed
- —
Loan-product check · same deal, 3 products live
Conventional
25% down · 7.5% · 30yr
- Down + closing
- —
- Monthly P&I
- —
- Monthly cashflow
- —
- DSCR
- —
- Eligible?
- —
Personal DTI + credit; lowest rate.
DSCR
20% down · 8.5% · 30yr
- Down + closing
- —
- Monthly P&I
- —
- Monthly cashflow
- —
- DSCR
- —
- Eligible?
- —
No personal income docs; deal must DSCR.
Hard money
10% down · 12.0% · 12mo
- Down + closing
- —
- Monthly P&I
- —
- Monthly cashflow
- —
- DSCR
- —
- Eligible?
- —
Short-term bridge; refi at stabilization.
Listing history 22 events
-
2026-06-19days on market $160,000 Active 22 DOM
-
2026-06-18days on market $160,000 Active 21 DOM
-
2026-06-17days on market $160,000 Active 20 DOM
-
2026-06-16days on market $160,000 Active 19 DOM
-
2026-06-15days on market $160,000 Active 18 DOM
-
2026-06-14days on market $160,000 Active 16 DOM
-
2026-06-12days on market $160,000 Active 15 DOM
-
2026-06-09days on market $160,000 Active 12 DOM
-
2026-06-08days on market $160,000 Active 11 DOM
-
2026-06-07days on market $160,000 Active 10 DOM
-
2026-06-02days on market $160,000 Active 5 DOM
-
2026-06-01days on market $160,000 Active 4 DOM
-
2026-05-31days on market $160,000 Active 3 DOM
-
2026-05-30days on market $160,000 Active 2 DOM
-
2026-05-28$160,000 Active
-
2026-04-02price $155,000
-
2025-12-08price $165,000
-
2025-11-14price $175,000
-
2002-04-29soldstatus $27,000
-
2002-04-29soldstatus $27,000
-
2001-06-12$35,000
-
2001-06-12$35,000
ⓘ Source: listings_history table (triggers on properties + properties_extension) + one-shot
backfill from property_details.listing_events for pre-trigger history.
Climate risk First Street
- Flood 1/10 Low FEMA zone X (unshaded) · 0% chance over 30 yrs
- Wildfire 1/10 Low
- Heat 4/10 Moderate 8 d/yr ≥99°F today · 20 d/yr by 30 yrs out
- Wind 1/10 Low 0% chance of damaging wind over 30 yrs
- Air quality 2/10 Low 1 unhealthy d/yr today · 3 by 30 yrs out
Nearby sold comps map
Loading sold comps map…
Walkable amenities ~0.75 mi
Loading nearby amenities…
Taxation est. · year 1
- Rental income
- $29,964
- − Mortgage interest
- −$8,962
- − Property taxes
- −$2,400
- − Insurance
- −$800
- − Repairs & maintenance
- −$2,397
- − Management
- −$2,397
- − Depreciation
- −$4,655
- Taxable income
- $8,353
- Est. tax owed @ 24.0%
- −$2,005
- After-tax cash flow
- $8,398/yr
For passive investors: Depreciation is non-cash, so a rental often shows a tax loss while cash-flowing — sheltering income. Rental losses are passive: they offset passive income freely, and up to $25,000/yr can offset ordinary (W-2) income if you actively participate and your MAGI is under $100k (phasing out to $0 by $150k); unused losses carry forward. On sale, claimed depreciation is recaptured at up to 25%, and gains may owe capital-gains tax (a 1031 exchange can defer both). Figures are a year-1 estimate at your 24.0% rate — not tax advice; consult a CPA.
Schools (NCES district)
- District
- Marshall County Schools
- NCES district ID
- 5400750
- Math proficiency
- 28% ▼ -6.00%
- Reading proficiency
- 36% ▼ -4.00%
- Median HH income
- $40,289
- Composite
- 26.91/100
- National rank
- #7086
- State rank
- #21 of 55 in WV
Livability — Moundsville
- Score
- 66/100
- State rank
- #105
- US rank
- #11553
Category grades
Schools grade is shown separately in the Schools card above.
Census & demographics
- Census place
- Moundsville, WV
- County
- Marshall · 16,750 people
- Metro
- Wheeling, WV-OH
- Population (ZIP)
- 15,706
- Household income
- $55,545
- Rent vs Own
- Severe rent burden
- 7.4
Population outlook (Marshall County) Hauer SSP2
- Today (2025)
- 30,387 people
- By 2030
- 29,242 · -3.8%
- By 2040
- 26,806 · -11.8%
- By 2050
- 24,627 · -19.0%
- By 2075
- 19,846 · -34.7%
- By 2100
- 15,169 · -50.1%
Race, ethnicity, and origin ACS 2023
- Neighborhood character
- Predominantly White (94%)
- Race & ethnicity
- White 94% Two or more races 3% Hispanic / Latino 1%
- Common ancestry
- Romanian 4% Iranian 2% Italian 1%
- Foreign-born
- 1% · Canada
- Languages at home
- 98% English-only · Spanish 1% German/W. Germanic 1%
Political lean MEDSL · Marshall
- 2024 margin
- Solid R (+50.0) · D 24.1% · R 74.1% · Other 1.8%
- 2008→2024 swing
- -37.5pp toward R · 2008: -12.6pp · 2024: -50.0pp
- All cycles
- 2024: R+50.0 2020: R+49.6 2016: R+51.0 2012: R+28.6 2008: R+12.6
Not yet ingested
- Civics
- —
Market trends
- HPI YoY
- ▼ -50.71%
- Current HPI
- 153.9522
- Rent YoY
- —
- Metro
- —
- State GDP YoY
- —
- F500 in state
- 0
Price history
+357.1% since first listed8 events — show timeline
- 2026-05-28 Listed $160,000 WBOR
- 2026-04-02 Price Changed $155,000 WBOR
- 2025-12-08 Price Changed $165,000 WBOR
- 2025-11-14 Price Changed $175,000 WBOR
- 2002-04-29 Sold (MLS) $27,000 WBOR
- 2002-04-29 Sold (MLS) $27,000 WBOR
- 2001-06-12 Listed $35,000 WBOR
- 2001-06-12 Listed $35,000 WBOR
Property tax history
-5.0%/yrLatest (2025): $216 · +6.2% YoY. Source: county tax records.
Cash-flow waterfall
monthlySold comps — $/sqft
last 12 mo · ≤1 miLoading sold comps…