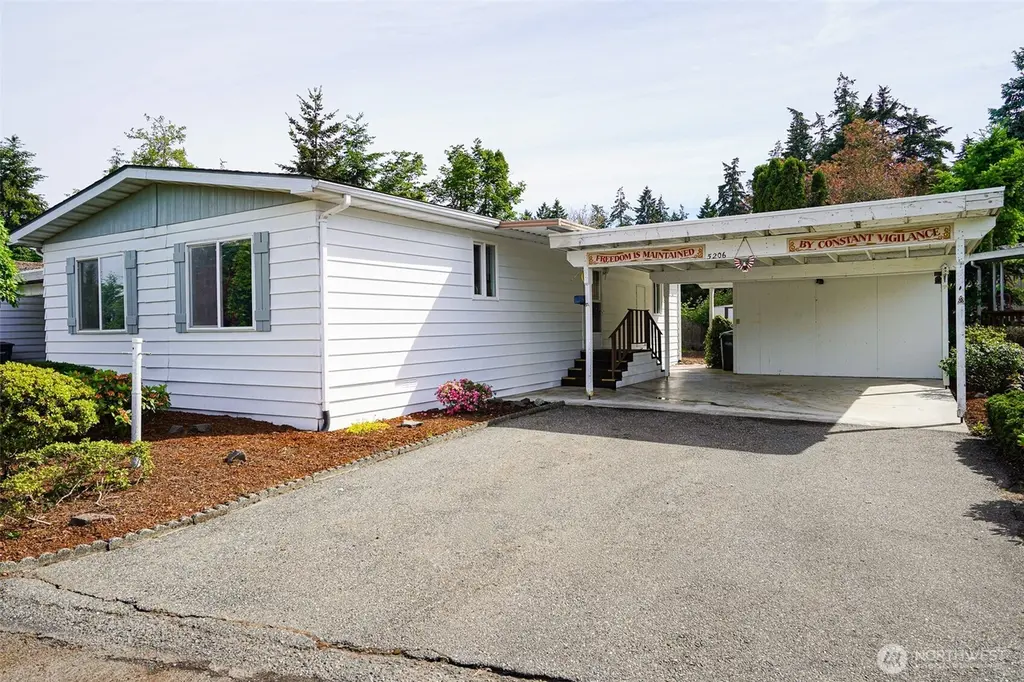
5206 90th St E #43 · Summit, WA
Flood risk 1/10 · Minimal
- FEMA flood zone
- X (unshaded)
- Chance of flooding over 30 yrs
- 0.0%
- Est. flood insurance / yr
- $507 – $1,088
Fire risk 1/10 · Minimal
- Est. fire insurance / yr
- $604 – $1,122
Heat risk 3/10 · Minor
- Hot days now (above 87°F)
- 7 days/yr
- Hot days in 30 yrs
- 16 days/yr
Wind risk 1/10 · Minimal
- Chance of severe wind over 30 yrs
- —
Air-quality risk 7/10 · Major
- Unhealthy air days now
- 10 days/yr
- Unhealthy air days in 30 yrs
- 12 days/yr
Risk factors via First Street. Map © Google.
Why this score? — see what drove the B grade
The composite is a weighted blend of 9 inputs, each scored 0–100. Each bar is that input's sub-score; the figure is the points it added to the 100-point composite (weight × sub-score).
- Cash flow +30.0/30.0
- 1% rule +10.0/10.0
- DSCR +10.0/10.0
- ARV discount +7.5/15.0
- Schools +3.9/10.0
- Rent growth +3.8/5.0
- Livability +3.3/5.0
- Condition / age +2.5/5.0
- Appreciation +0.0/10.0
$110,000
🖨 Deal sheet 📄 Offer letter ✓ Due diligence
Listing remarks
Welcome Home! This beautifully updated two bedroom, two bath residence offers convenience and low maintenance living. The primary bedroom is light and bright and includes a sizable en suite. You will also appreciate the spacious kitchen and inviting living room, designed for both everyday comfort and entertaining. This thoughtfully maintained property features a manageable backyard, covered parking for two vehicles, and additional parking for two more. Abundant storage is available with a large, detached storage shed, complemented by an additional storage shed in back, for added flexibility. Ideally situated in a highly convenient location with easy access to shopping, dining, services, JBL
Key facts
- Covered parking
- Manageable backyard
- Spacious kitchen
Tags
Property features AI
Finance
- Other: Calculated living area 1,147; Paved access and bus line nearby
- Financial info: Listing terms: Cash
- HOA & community: Canyon Heights park; Land lease $785
Exterior
- Parking: Carport; Uncovered parking
- Utilities: Public water (Guardian); Public sewer (Guardian); Power by TPU; Cable connected (Xfinity); Internet connected (Xfinity); Electric water heater
- Home design: Manufactured double wide (Candlewood); One level; Manufactured home in park approved for sale; Manufactured after 06/15/1976; Good condition; Mobile home remains
- Construction: Metal/vinyl and other construction materials; Composition roof; Tie down foundation; Built as a manufactured house
- Exterior features: Metal/vinyl exterior; Other exterior materials; Paved lot; Patio/porch/deck
Interior
- Kitchen: Dishwasher; Microwave; Refrigerator; Stove/Range
- Bedrooms: 2 bedrooms
- Flooring: Vinyl; Carpet
- Bathrooms: 1 full bath; 1 three-quarter bath; 1 bathtub; 2 showers
- Heating & cooling: Forced air heating; Electric energy source
- Interior features: Water heater (electric) located to the right of the back door; Ceiling fan(s); Double pane windows; Bath off primary; Patio/porch/deck
- Laundry & utility: Washer; Dryer; Tie down foundation
Neighborhood map
What this means for you Summary
Snapshot
- This is a 2-bed/2.0-bath manufactured listed at $110k.
Deal economics
- At list price, monthly cash flow is $617 ($7k/yr) — positive.
- The deal already cash-flows at list — no discount required.
- Meets the 1% rule at list price ($2k rent vs $110k).
- Recommended offer: $108k (1.5% below list) — sets the bar for market timing.
- Cap rate 13.0% vs local median 2.5% in Summit — top-decile yield for the area; either an underpriced asset or a hidden risk that comps aren't pricing in. Stress-test before assuming the spread holds.
Location & tenants
- Location reads 66/100 on livability (#318 in WA) — a middle-class / working-renter tenant base. Strengths: housing A+, health & safety A+, employment A; Watch: schools D-, amenities F, commute F.
- Franklin Pierce School District (suburban): math 35% / reading 51% proficiency, ranked #197 of 291 in WA (top 68%) — families likely to look elsewhere, expect single-tenant / working-renter base with shorter leases.
- Market conditions: Rents rising fast (+5.2%/yr); 116 active listings in the ZIP; 12 comparable units currently listed for rent nearby; rentals leasing fast (median 12d on market — plan ~1-2 weeks tenant-placement turnaround); solid renter incomes; 3,209 units permitted in Pierce County in 2024 (1,269 in 5+ unit buildings).
Forward outlook
- Local home prices are declining (-3.0%/yr); year-one equity from $761 of loan paydown is wiped out by about $3k of value loss. Plan a longer hold.
- Pierce County population projected at +26% by 2050 — long-run rental-demand tailwind backs the buy-and-hold thesis.
- At projected returns (-3.0% appreciation + 5.2% rent growth), your $31k cash investment doubles in ~5 years — after that, you're playing with house money.
Negotiation context
- It's been on market 15 days — a 2% lower offer ($108k) is reasonable based on typical stale-listing flexibility.
Questions for the listing agent
- Is there a deadline driving the sale (1031 exchange, divorce, estate, relocation)? That informs how much negotiation room exists.
- Schools are D-rated, which usually means shorter tenancies and higher turnover. Who's the typical renter profile here, and what's been the actual vacancy rate?
- What's the average days-on-market for RENTAL listings here right now (not sales)? A rising rental-DOM trend means longer vacancies and softer asking-rent achievability than the comps imply.
- What's the recent tenant-quality profile in this submarket — average credit score on applications, eviction rate, late-payment / NSF rate, and stable-employment percentage? A property-management company in the area should have these aggregated.
- How much new for-sale + rental construction is in the pipeline within 1–3 miles? Heavy new supply typically softens prices + rents 12–24 months out; constrained supply supports both.
Investment metrics
- 1% rule
- 1.55% ✓
- Cap rate
- 13.03%
- Cash-on-cash
- 24.05%
- DSCR
- 2.07
- GRM
- 5.4
CMA / ARV
- ARV (on-the-fly)
- $48,174
- Comps found
- 1
Show comp detail 1 sale within ~0.75 mi
| Address | Dist | Beds/Ba | Sqft | Sold | Price | $/sf | Match |
|---|---|---|---|---|---|---|---|
| 9314 Canyon Rd E | 0.26mi | 2/2.0 | 1,238 (+8%) | 24mo | $52,500 | $42 | 55 |
Match score weights: distance 35% · size 25% · config 20% · recency 20%. Top-matched comps best support the ARV.
Projected returns pro-forma
-3.0% appreciation · 5.17% rent growth · sell at horizon
- IRR
- 19.7%
- Equity multiple
- 1.82×
- Total profit
- $25,292
- Equity at exit
- $16,401
- IRR
- 29.4%
- Equity multiple
- 3.89×
- Total profit
- $88,951
- Equity at exit
- $9,511
Cash invested: $30,800 (down + closing). Projections, not guarantees.
Landlord ↔ Tenant lean methodology
- Overall (STATE)
- 28 Tenant-Leaning
- State Washington
- 28 Tenant-Leaning · D+8
- County
- — inherits STATE
- City
- — inherits STATE
ZIP-level market 98446
- Rents YoY
- 5.2%
- Active inventory
- 116
- Price-to-rent
- 5.4×
Monthly cashflow live
- Estimated rent
- $1,701 high interval (Pro) →
- Mortgage (P&I)
- −$577
- Tax from tax record
- −$104 /mo · $1,248/yr
- Insurance
- −$46
- HOA
- −$0
- Vacancy / Maint / Mgmt
- −$357
- Net cashflow
- $617
Break-even live
UW: 25.0% down · 7.5% · 30yr · 1.5% tax · 5.0% vac · 8.0% maint · 8.0% mgmt
Financing live
Cash to close
- Down payment
- $27,500
- Closing costs
- $3,300
- Reserves months
- —
- Total cash needed
- —
Loan-product check · same deal, 3 products live
Conventional
25% down · 7.5% · 30yr
- Down + closing
- —
- Monthly P&I
- —
- Monthly cashflow
- —
- DSCR
- —
- Eligible?
- —
Personal DTI + credit; lowest rate.
DSCR
20% down · 8.5% · 30yr
- Down + closing
- —
- Monthly P&I
- —
- Monthly cashflow
- —
- DSCR
- —
- Eligible?
- —
No personal income docs; deal must DSCR.
Hard money
10% down · 12.0% · 12mo
- Down + closing
- —
- Monthly P&I
- —
- Monthly cashflow
- —
- DSCR
- —
- Eligible?
- —
Short-term bridge; refi at stabilization.
Rent comps 12 comps
| Address | Beds | Baths | Sqft | Rent | $/sqft | DOM | Units | Dist |
|---|---|---|---|---|---|---|---|---|
| 9012 Pipeline Rd E Unit 7 Tacoma, WA | 2.0 | 1.0 | 790 | $1,495 | $1.89 | 4d | 1 | 0.07mi |
| 9020 Pipeline Rd E Apt 3 Tacoma, WA | 2.0 | 1.0 | 790 | $1,450 | $1.84 | 43d | 1 | 0.08mi |
| 9020 Pipeline Rd E Unit 4 Tacoma, WA | 2.0 | 1.0 | 790 | $1,515 | $1.92 | 43d | 1 | 0.08mi |
| 4016 84th St E Tacoma, WA | 3.0 | 1.0 | 940 | $1,695 | $1.80 | 10d | 1 | 0.73mi |
| 8222 Pipeline Rd E Tacoma, WA | 2.0 | 1.0 | 785 | $1,895 | $2.41 | 43d | 1 | 0.82mi |
| 2506 103rd St E Puyallup, WA | 2.0 | 1.0 | 1025 | $1,877 | $1.83 | 4d | 3 | 0.94mi |
| 6406 104th St E Unit 6402 Puyallup, WA | 2.0 | 1.0 | 900 | $1,600 | $1.78 | 43d | 1 | 1.26mi |
| 10823 50th Ave E Tacoma, WA | 1.0–2.0 | 1.0–2.0 | 916 | $2,391 | $2.61 | 1d | 3 | 1.27mi |
| 5923 111th Street Ct E Puyallup, WA | 3.0 | 2.5 | 1364 | $2,600 | $1.91 | 1d | 1 | 1.45mi |
| 6115 111th St E Puyallup, WA | 1.0–3.0 | 1.0–2.0 | 911 | $1,995 | $2.19 | 1d | 16 | 1.48mi |
| 5909 111th Street Ct E Puyallup, WA | 3.0 | 2.5 | 1356 | $2,395 | $1.77 | 15d | 1 | 1.49mi |
| 5617 112th St E Puyallup, WA | 1.0–3.0 | 1.0–2.0 | 947 | $1,880 | $1.99 | 11d | 17 | 1.50mi |
Listing history 11 events
-
2026-06-18days on market $110,000 Active 15 DOM
-
2026-06-17days on market $110,000 Active 14 DOM
-
2026-06-16days on market $110,000 Active 13 DOM
-
2026-06-15days on market $110,000 Active 12 DOM
-
2026-06-13days on market $110,000 Active 10 DOM
-
2026-06-13days on market $110,000 Active 9 DOM
-
2026-06-09days on market $110,000 Active 6 DOM
-
2026-06-08days on market $110,000 Active 5 DOM
-
2026-06-07days on market $110,000 Active 4 DOM
-
2026-06-03remarks 699-char remark
-
2026-06-03$110,000 Active 1 DOM
ⓘ Source: listings_history table (triggers on properties + properties_extension) + one-shot
backfill from property_details.listing_events for pre-trigger history.
Tax reassessment forecast WA · Resets to sale price
- Current annual tax
- $1,248 · $104/mo
- Projected year-2 tax
- $1,248 · $104/mo
- Expected delta
- $0/yr ($0/mo · 0.0%)
ⓘ Screening estimate from a state-policy table — verify with the county assessor before closing.
Climate risk First Street
- Flood 1/10 Low FEMA zone X (unshaded) · 0% chance over 30 yrs
- Wildfire 1/10 Low
- Heat 3/10 Moderate 7 d/yr ≥87°F today · 16 d/yr by 30 yrs out
- Wind 1/10 Low
- Air quality 7/10 Severe 10 unhealthy d/yr today · 12 by 30 yrs out
Nearby sold comps map
Loading sold comps map…
Walkable amenities ~0.75 mi
Loading nearby amenities…
Taxation est. · year 1
- Rental income
- $20,415
- − Mortgage interest
- −$6,162
- − Property taxes
- −$1,248
- − Insurance
- −$550
- − Repairs & maintenance
- −$1,633
- − Management
- −$1,633
- − Depreciation
- −$3,200
- Taxable income
- $5,989
- Est. tax owed @ 24.0%
- −$1,437
- After-tax cash flow
- $5,970/yr
For passive investors: Depreciation is non-cash, so a rental often shows a tax loss while cash-flowing — sheltering income. Rental losses are passive: they offset passive income freely, and up to $25,000/yr can offset ordinary (W-2) income if you actively participate and your MAGI is under $100k (phasing out to $0 by $150k); unused losses carry forward. On sale, claimed depreciation is recaptured at up to 25%, and gains may owe capital-gains tax (a 1031 exchange can defer both). Figures are a year-1 estimate at your 24.0% rate — not tax advice; consult a CPA.
Schools (NCES district)
- District
- Franklin Pierce School District
- NCES district ID
- 5302940
- Math proficiency
- 35% ▬ 0.00%
- Reading proficiency
- 51% ▲ 2.00%
- Median HH income
- $49,240
- Composite
- 39.18/100
- National rank
- #8227
- State rank
- #197 of 291 in WA
Livability — Summit
- Score
- 66/100
- State rank
- #318
- US rank
- #11661
Category grades
Schools grade is shown separately in the Schools card above.
Census & demographics
- Census place
- Summit, WA
- County
- Pierce County · 788,257 people
- Metro
- Seattle-Tacoma-Bellevue, WA
- Population (ZIP)
- 14,634
- Household income
- $101,938
- Rent vs Own
- Severe rent burden
- 246.0
Population outlook (Pierce County) Hauer SSP2
- Today (2025)
- 956,648 people
- By 2030
- 1,010,862 · +5.7%
- By 2040
- 1,113,170 · +16.4%
- By 2050
- 1,206,524 · +26.1%
- By 2075
- 1,436,425 · +50.2%
- By 2100
- 1,563,654 · +63.5%
Race, ethnicity, and origin ACS 2023
- Neighborhood character
- Diverse neighborhood (Simpson 0.59)
- Race & ethnicity
- White 61% Two or more races 17% Hispanic / Latino 17% Black 6% Asian 4% Pacific Islander 3% Native American 2%
- Hispanic origin (detail)
- Mexican 11% Puerto Rican 1%
- Common ancestry
- Portuguese 4% Serbian 3% Italian 3%
- Foreign-born
- 7% · Canada, South Korea
- Languages at home
- 80% English-only · Spanish 11% Other Asian/Pacific 3% Russian/Polish/Slavic 2%
Political lean MEDSL · Pierce
- 2024 margin
- D (+10.8) · D 53.9% · R 43.1% · Other 3.0%
- 2008→2024 swing
- -1.4pp toward R · 2008: 12.2pp · 2024: 10.8pp
- All cycles
- 2024: D+10.8 2020: D+11.2 2016: D+7.5 2012: D+11.0 2008: D+12.2
Not yet ingested
- Civics
- —
Market trends
- HPI YoY
- ▼ -562.34%
- Current HPI
- 322.6286
- Rent YoY
- ▲ 5.17%
- Metro
- Seattle-Tacoma-Bellevue, WA
- State GDP YoY
- ▲ 4.65%
- F500 in state
- 22
Industry mix (Fortune 500 HQ in WA)
| Industry | F500 HQs | Revenue |
|---|---|---|
| Retail | 2 | $269B |
|
||
| Technology / Retail | 1 | $638B |
|
||
| Technology | 1 | $245B |
|
||
| Telecommunications | 1 | $38B |
|
||
| Food / Beverage | 1 | $36B |
|
||
| Automotive / Trucks | 1 | $34B |
|
||
Price history
1 event — show timeline
- 2026-06-03 Listed $110,000 NWMLS as Distributed by MLS Grid
Property tax history
+8.6%/yrLatest (2026): $1,248 · +2.8% YoY. Source: county tax records.
Cash-flow waterfall
monthlySold comps — $/sqft
last 12 mo · ≤1 miLoading sold comps…