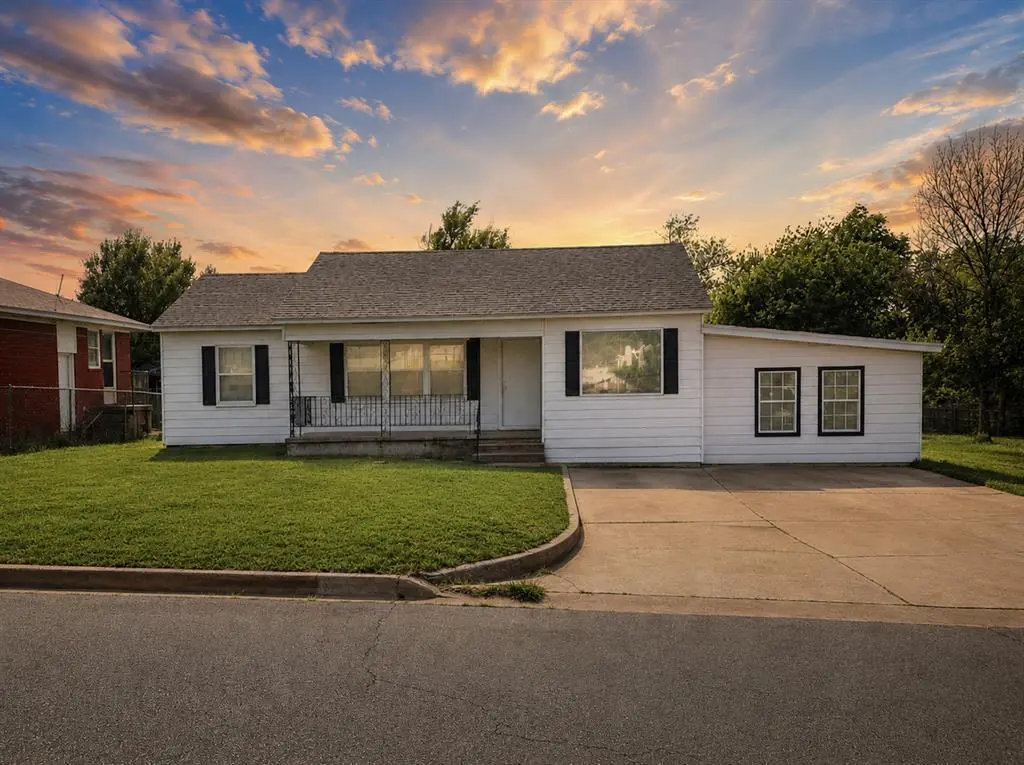
1316 S 12th St · Chickasha, OK
Flood risk 1/10 · Minimal
- FEMA flood zone
- X (unshaded)
- Chance of flooding over 30 yrs
- 0.0%
- Est. flood insurance / yr
- $507 – $1,088
Fire risk 5/10 · Moderate
- Est. fire insurance / yr
- $2,463 – $4,575
Heat risk 6/10 · Moderate
- Hot days now (above 109°F)
- 7 days/yr
- Hot days in 30 yrs
- 18 days/yr
Wind risk 2/10 · Minimal
- Chance of severe wind over 30 yrs
- 4.0%
Air-quality risk 2/10 · Minimal
- Unhealthy air days now
- 1 days/yr
- Unhealthy air days in 30 yrs
- 2 days/yr
Risk factors via First Street. Map © Google.
Why this score? — see what drove the B grade
The composite is a weighted blend of 9 inputs, each scored 0–100. Each bar is that input's sub-score; the figure is the points it added to the 100-point composite (weight × sub-score).
- Cash flow +28.8/30.0
- ARV discount +15.0/15.0
- DSCR +10.0/10.0
- 1% rule +7.3/10.0
- Livability +3.3/5.0
- Rent growth +2.5/5.0
- Condition / age +2.5/5.0
- Schools +2.1/10.0
- Appreciation +0.0/10.0
$110,000
🖨 Deal sheet 📄 Offer letter ✓ Due diligence
Listing remarks MLS
This house could make a great investment property! 2 bedrooms, 1.5 baths, 2 living areas. HUD Owned Property For Sale As-Is. HUD regulations & bidding procedures. Buyer(s) to verify all information at their own expense. Buyer's inspections are for information only.
Key facts
- Spacious lot
- Local amenities
- Functional layout
Tags
Property features AI
Finance
- Other: Homestead status: Homestead claimed
- Financial info: Listing offered as-is; cash or conventional financing considered; Assumable loan status: Unknown
- HOA & community: No mandatory association dues
Exterior
- Parking: Concrete parking
- Utilities: Utilities not specified
- Home design: Single family residence; One story; Frame construction; Composition roof; Property faces unspecified direction
- Construction: Frame construction; Composition roof; Slab foundation
- Exterior features: Interior lot
Interior
- Kitchen: Kitchen
- Bedrooms: 3 bedrooms (including primary bedroom)
- Bathrooms: 1 full bath; 1 half bath
- Heating & cooling: Electric heating
- Interior features: Covered porch; No fireplace; Two living areas; One dining area; Existing property (one level)
- Laundry & utility: Slab foundation
Neighborhood map
What this means for you Summary
Snapshot
- This is a 3-bed/1.0-bath single-family listed at $110k.
Deal economics
- At list price, monthly cash flow is $370 ($4k/yr) — positive.
- The deal already cash-flows at list — no discount required.
- Meets the 1% rule at list price ($1k rent vs $110k).
- Recommended offer: $108k (1.5% below list) — sets the bar for market timing.
- Cap rate 10.3% vs local median 4.8% in Chickasha — top-decile yield for the area; either an underpriced asset or a hidden risk that comps aren't pricing in. Stress-test before assuming the spread holds.
Location & tenants
- Location reads 66/100 on livability (#117 in OK) — a middle-class / working-renter tenant base. Strengths: cost of living A+, housing A+; Watch: amenities F, commute F, health & safety F.
- Chickasha (town): math 23% / reading 27% proficiency, ranked #115 of 270 in OK (top 43%) — low school quality limits family demand, transient renter base, plan for 1-2y turnover; 64% free/reduced lunch — lower-income household profile, screen leases tightly.
- Zoned schools: Grand Avenue Es (math 40% / reading 31%, grade F, #165 of 845 statewide, top 20%, 490 students, 0% FRL); Chickasha Hs (math 12% / reading 27%, grade F, #296 of 447 statewide, top 67%, 749 students, 0% FRL) — zoned schools average 0% FRL vs 64% district-wide (64 pts lower); this property's tenant base skews higher-income than the district average.
- Market conditions: 203 active listings in the ZIP; 7 comparable units currently listed for rent nearby; rentals leasing fast (median 3d on market — plan ~1-2 weeks tenant-placement turnaround); 224 units permitted in Grady County in 2024 (0 in 5+ unit buildings).
Forward outlook
- Local home prices are declining (-3.0%/yr); year-one equity from $761 of loan paydown is wiped out by about $3k of value loss. Plan a longer hold.
- Grady County population projected at +20% by 2050 — long-run rental-demand tailwind backs the buy-and-hold thesis.
- At projected returns (-3.0% appreciation + 3.0% rent growth), your $31k cash investment doubles in ~9 years — after that, you're playing with house money.
Negotiation context
- It's been on market 16 days — a 2% lower offer ($108k) is reasonable based on typical stale-listing flexibility.
- 2 sale attempts since 7y ago with the ask held roughly flat each time — persistent listings suggest the price (not the market) is what's stuck; bring a comps-based counter.
- Current owner paid $82k; 34% above their basis — modest negotiation headroom, anchor on the comps not their cost.
Risks & watch-outs
- Watch-outs: built in 1955 — expect roof / HVAC / electrical / plumbing capex.
- Climate carrying-cost: moderate wildfire risk; extreme-heat days projected 7→18/yr by 2055 (HVAC capex compounding) — expect insurance premiums to compound above CPI over the hold.
Questions for the listing agent
- Built in 1955 — when were the roof, HVAC, electrical panel, plumbing, and water heater last replaced?
- Is there a deadline driving the sale (1031 exchange, divorce, estate, relocation)? That informs how much negotiation room exists.
- Schools are D-rated, which usually means shorter tenancies and higher turnover. Who's the typical renter profile here, and what's been the actual vacancy rate?
- What's the average days-on-market for RENTAL listings here right now (not sales)? A rising rental-DOM trend means longer vacancies and softer asking-rent achievability than the comps imply.
- What's the recent tenant-quality profile in this submarket — average credit score on applications, eviction rate, late-payment / NSF rate, and stable-employment percentage? A property-management company in the area should have these aggregated.
- How much new for-sale + rental construction is in the pipeline within 1–3 miles? Heavy new supply typically softens prices + rents 12–24 months out; constrained supply supports both.
Investment metrics
- 1% rule
- 1.23% ✓
- Cap rate
- 10.33%
- Cash-on-cash
- 14.43%
- DSCR
- 1.64
- GRM
- 6.8
CMA / ARV
- ARV (on-the-fly)
- $173,554
- Comps found
- 12
Show comp detail 12 sales within ~0.75 mi
| Address | Dist | Beds/Ba | Sqft | Sold | Price | $/sf | Match |
|---|---|---|---|---|---|---|---|
| 1402 S 14th St | 0.16mi | 3/2.0 | 1,563 (-4%) | 6mo | $145,000 | $93 | 77 |
| 1028 S 16th St | 0.37mi | 3/1.5 | 1,748 (+8%) | 8mo | $179,900 | $103 | 61 |
| 1119 S 5th St | 0.59mi | 2/1.5 (-1) | 1,596 (-2%) | 4mo | $120,000 | $75 | 60 |
| 808 W Idaho Ave Ave | 0.56mi | 3/2.0 | 1,520 (-6%) | 1mo | $177,300 | $117 | 58 |
| 1310 W Minnesota Ave | 0.66mi | 3/2.0 | 1,639 (+1%) | 7mo | $40,000 | $24 | 58 |
| 1124 S 19th St | 0.56mi | 3/2.0 | 1,544 (-5%) | 5mo | $129,000 | $84 | 58 |
| 1621 Park Ave | 0.69mi | 3/2.5 | 1,620 (-0%) | 9mo | $200,000 | $123 | 54 |
| 628 S 12th St | 0.48mi | 3/2.0 | 1,470 (-9%) | 6mo | $172,000 | $117 | 53 |
| 1127 S 19th St | 0.52mi | 3/2.0 | 1,772 (+9%) | 7mo | $203,500 | $115 | 50 |
| 802 S 20th St | 0.73mi | 3/2.0 | 1,735 (+7%) | 1mo | $135,000 | $78 | 49 |
| 706 S 19th St | 0.70mi | 4/2.0 (+1) | 1,772 (+9%) | 2mo | $190,000 | $107 | 42 |
| 1508 S 19th St | 0.56mi | 4/3.0 (+1) | 1,445 (-11%) | 8mo | $210,500 | $146 | 36 |
Match score weights: distance 35% · size 25% · config 20% · recency 20%. Top-matched comps best support the ARV.
Projected returns pro-forma
-3.0% appreciation · 3.0% rent growth · sell at horizon
- IRR
- 4.8%
- Equity multiple
- 1.19×
- Total profit
- $5,751
- Equity at exit
- $16,401
- IRR
- 14.3%
- Equity multiple
- 2.15×
- Total profit
- $35,309
- Equity at exit
- $9,511
Cash invested: $30,800 (down + closing). Projections, not guarantees.
Landlord ↔ Tenant lean methodology
- Overall (STATE)
- 83 Strongly Landlord-Friendly
- State Oklahoma
- 83 Strongly Landlord-Friendly · R+20
- County
- — inherits STATE
- City
- — inherits STATE
ZIP-level market 73018
- Home prices YoY
- -21.1%
- Active inventory
- 203
- Price-to-rent
- 6.8×
Monthly cashflow live
- Estimated rent
- $1,348 high interval (Pro) →
- Mortgage (P&I)
- −$577
- Tax from tax record
- −$72 /mo · $860/yr
- Insurance
- −$46
- HOA
- −$0
- Vacancy / Maint / Mgmt
- −$283
- Net cashflow
- $370
Break-even live
UW: 25.0% down · 7.5% · 30yr · 1.5% tax · 5.0% vac · 8.0% maint · 8.0% mgmt
Financing live
Cash to close
- Down payment
- $27,500
- Closing costs
- $3,300
- Reserves months
- —
- Total cash needed
- —
Loan-product check · same deal, 3 products live
Conventional
25% down · 7.5% · 30yr
- Down + closing
- —
- Monthly P&I
- —
- Monthly cashflow
- —
- DSCR
- —
- Eligible?
- —
Personal DTI + credit; lowest rate.
DSCR
20% down · 8.5% · 30yr
- Down + closing
- —
- Monthly P&I
- —
- Monthly cashflow
- —
- DSCR
- —
- Eligible?
- —
No personal income docs; deal must DSCR.
Hard money
10% down · 12.0% · 12mo
- Down + closing
- —
- Monthly P&I
- —
- Monthly cashflow
- —
- DSCR
- —
- Eligible?
- —
Short-term bridge; refi at stabilization.
Rent comps 7 comps
| Address | Beds | Baths | Sqft | Rent | $/sqft | DOM | Units | Dist |
|---|---|---|---|---|---|---|---|---|
| 1024 S 13th St Chickasha, OK | 2.0 | 2.0 | 1265 | $925 | $0.73 | 10d | 1 | 0.25mi |
| 1008 S 14th St Chickasha, OK | 3.0 | 2.0 | 1485 | $1,395 | $0.94 | 1d | 1 | 0.31mi |
| 607 W Wisconsin Ave Chickasha, OK | 3.0 | 2.0 | 1270 | $1,395 | $1.10 | 10d | 1 | 0.60mi |
| 519 W Minnesota Ave Chickasha, OK | 2.0 | 2.0 | 1100 | $1,250 | $1.14 | 1d | 1 | 0.82mi |
| 3507 W Mississippi Ave Chickasha, OK | 4.0 | 2.0 | 1240 | $1,474 | $1.19 | 1d | 1 | 0.87mi |
| 810 W Illinois Ave Chickasha, OK | 2.0 | 2.0 | 1100 | $1,250 | $1.14 | 3d | 1 | 1.27mi |
| 810 W Illinois Ave Chickasha, OK | 2.0 | 2.0 | 1100 | $1,250 | $1.14 | 23d | 1 | 1.27mi |
Listing history 17 events
-
2026-06-10status $110,000 Pending 16 DOM
-
2026-06-09days on market $110,000 Active 16 DOM
-
2026-06-08days on market $110,000 Active 15 DOM
-
2026-06-07days on market $110,000 Active 14 DOM
-
2026-06-05days on market $110,000 Active 11 DOM
-
2026-06-03days on market $110,000 Active 10 DOM
-
2026-06-02days on market $110,000 Active 9 DOM
-
2026-06-01days on market $110,000 Active 8 DOM
-
2026-05-31days on market $110,000 Active 7 DOM
-
2026-05-19$110,000 Active
-
2021-07-23soldstatus $82,000
-
2020-06-12soldstatus $65,000
-
2019-06-05historical 269-char remark
Show marketing remark (269 chars)
This house could make a great investment property! 2 bedrooms, 1.5 baths, 2 living areas. HUD Owned Property For Sale As-Is. HUD regulations & bidding procedures. Buyer(s) to verify all information at their own expense. Buyer's inspections are for information only.
-
2019-06-04soldstatus $30,001 Sold 269-char remark
Show marketing remark (269 chars)
This house could make a great investment property! 2 bedrooms, 1.5 baths, 2 living areas. HUD Owned Property For Sale As-Is. HUD regulations & bidding procedures. Buyer(s) to verify all information at their own expense. Buyer's inspections are for information only.
-
2019-05-07status Pending 269-char remark
Show marketing remark (269 chars)
This house could make a great investment property! 2 bedrooms, 1.5 baths, 2 living areas. HUD Owned Property For Sale As-Is. HUD regulations & bidding procedures. Buyer(s) to verify all information at their own expense. Buyer's inspections are for information only.
-
2019-04-26$23,000 Active 269-char remark
Show marketing remark (269 chars)
This house could make a great investment property! 2 bedrooms, 1.5 baths, 2 living areas. HUD Owned Property For Sale As-Is. HUD regulations & bidding procedures. Buyer(s) to verify all information at their own expense. Buyer's inspections are for information only.
-
2005-04-01soldstatus $48,000
ⓘ Source: listings_history table (triggers on properties + properties_extension) + one-shot
backfill from property_details.listing_events for pre-trigger history.
Tax reassessment forecast OK · Resets to sale price
- Current annual tax
- $860 · $72/mo
- Projected year-2 tax
- $990 · $82/mo
- Expected delta
- +$130/yr (+$11/mo · 15.1%)
ⓘ Screening estimate from a state-policy table — verify with the county assessor before closing.
Climate risk First Street
- Flood 1/10 Low FEMA zone X (unshaded) · 0% chance over 30 yrs
- Wildfire 5/10 Major
- Heat 6/10 Major 7 d/yr ≥109°F today · 18 d/yr by 30 yrs out
- Wind 2/10 Low 4% chance of damaging wind over 30 yrs
- Air quality 2/10 Low 1 unhealthy d/yr today · 2 by 30 yrs out
Nearby sold comps map
Loading sold comps map…
Walkable amenities ~0.75 mi
Loading nearby amenities…
Taxation est. · year 1
- Rental income
- $16,175
- − Mortgage interest
- −$6,162
- − Property taxes
- −$860
- − Insurance
- −$550
- − Repairs & maintenance
- −$1,294
- − Management
- −$1,294
- − Depreciation
- −$3,200
- Taxable income
- $2,815
- Est. tax owed @ 24.0%
- −$676
- After-tax cash flow
- $3,770/yr
For passive investors: Depreciation is non-cash, so a rental often shows a tax loss while cash-flowing — sheltering income. Rental losses are passive: they offset passive income freely, and up to $25,000/yr can offset ordinary (W-2) income if you actively participate and your MAGI is under $100k (phasing out to $0 by $150k); unused losses carry forward. On sale, claimed depreciation is recaptured at up to 25%, and gains may owe capital-gains tax (a 1031 exchange can defer both). Figures are a year-1 estimate at your 24.0% rate — not tax advice; consult a CPA.
Schools (NCES district)
- District
- Chickasha
- NCES district ID
- 4007560
- Math proficiency
- 23% ▼ -11.00%
- Reading proficiency
- 27% ▼ -8.00%
- Median HH income
- $38,561
- Composite
- 20.95/100
- National rank
- #8476
- State rank
- #115 of 270 in OK
Livability — Chickasha
- Score
- 66/100
- State rank
- #117
- US rank
- #11902
Category grades
Schools grade is shown separately in the Schools card above.
Census & demographics
- Census place
- Chickasha, OK
- County
- Grady County · 20,505 people
- City population
- 20,505
- Metro
- Oklahoma City, OK
- Population (ZIP)
- 20,505
- Household income
- $56,484
- Rent vs Own
- Severe rent burden
- 685.0
Population outlook (Grady County) Hauer SSP2
- Today (2025)
- 59,962 people
- By 2030
- 62,513 · +4.3%
- By 2040
- 67,338 · +12.3%
- By 2050
- 71,719 · +19.6%
- By 2075
- 82,684 · +37.9%
- By 2100
- 89,387 · +49.1%
Race, ethnicity, and origin ACS 2023
- Neighborhood character
- Predominantly White (74%)
- Race & ethnicity
- White 74% Two or more races 11% Hispanic / Latino 9% Black 5% Native American 5%
- Hispanic origin (detail)
- Mexican 6%
- Common ancestry
- Slovak 2% Iranian 2% Italian 2%
- Foreign-born
- 2% · Canada
- Languages at home
- 96% English-only · Spanish 3%
Political lean MEDSL · Grady
- 2024 margin
- Solid R (+62.7) · D 17.9% · R 80.6% · Other 1.5%
- 2008→2024 swing
- -16.0pp toward R · 2008: -46.7pp · 2024: -62.7pp
- All cycles
- 2024: R+62.7 2020: R+62.3 2016: R+60.3 2012: R+51.2 2008: R+46.7
Not yet ingested
- Civics
- —
Market trends
- HPI YoY
- ▼ -66.82%
- Current HPI
- 249.6051
- Rent YoY
- —
- Metro
- Oklahoma City, OK
- State GDP YoY
- ▲ 1.55%
- F500 in state
- 6
Industry mix (Fortune 500 HQ in OK)
| Industry | F500 HQs | Revenue |
|---|---|---|
| Energy | 3 | $48B |
|
||
Price history
+129.2% since first listed8 events — show timeline
- 2026-05-19 Listed $110,000 MLSOK
- 2021-07-23 Sold (Public Records) $82,000 Public Records
- 2020-06-12 Sold (Public Records) $65,000 Public Records
- 2019-06-05 Listing Removed — MLSOK
- 2019-06-04 Sold (MLS) $30,001 MLSOK
- 2019-05-07 Pending — MLSOK
- 2019-04-26 Listed $23,000 MLSOK
- 2005-04-01 Sold (Public Records) $48,000 Public Records
Property tax history
+5.0%/yrLatest (2025): $860 · +4.0% YoY. Source: county tax records.
Cash-flow waterfall
monthlySold comps — $/sqft
last 12 mo · ≤1 miLoading sold comps…