None · Hammond, IN
Flood risk 1/10 · Minimal
- FEMA flood zone
- X (unshaded)
- Chance of flooding over 30 yrs
- 0.0%
- Est. flood insurance / yr
- $473 – $860
Fire risk 1/10 · Minimal
- Est. fire insurance / yr
- $717 – $1,331
Heat risk 3/10 · Minor
- Hot days now (above 102°F)
- 7 days/yr
- Hot days in 30 yrs
- 15 days/yr
Wind risk 2/10 · Minimal
- Chance of severe wind over 30 yrs
- 0.0%
Air-quality risk 4/10 · Minor
- Unhealthy air days now
- 5 days/yr
- Unhealthy air days in 30 yrs
- 6 days/yr
Risk factors via First Street. Map © Google.
Why this score? — see what drove the B+ grade
The composite is a weighted blend of 9 inputs, each scored 0–100. Each bar is that input's sub-score; the figure is the points it added to the 100-point composite (weight × sub-score).
- Cash flow +30.0/30.0
- ARV discount +15.0/15.0
- 1% rule +10.0/10.0
- DSCR +10.0/10.0
- Rent growth +3.9/5.0
- Livability +3.5/5.0
- Condition / age +2.5/5.0
- Schools +1.1/10.0
- Appreciation +0.0/10.0
$179,900
🖨 Deal sheet 📄 Offer letter ✓ Due diligence
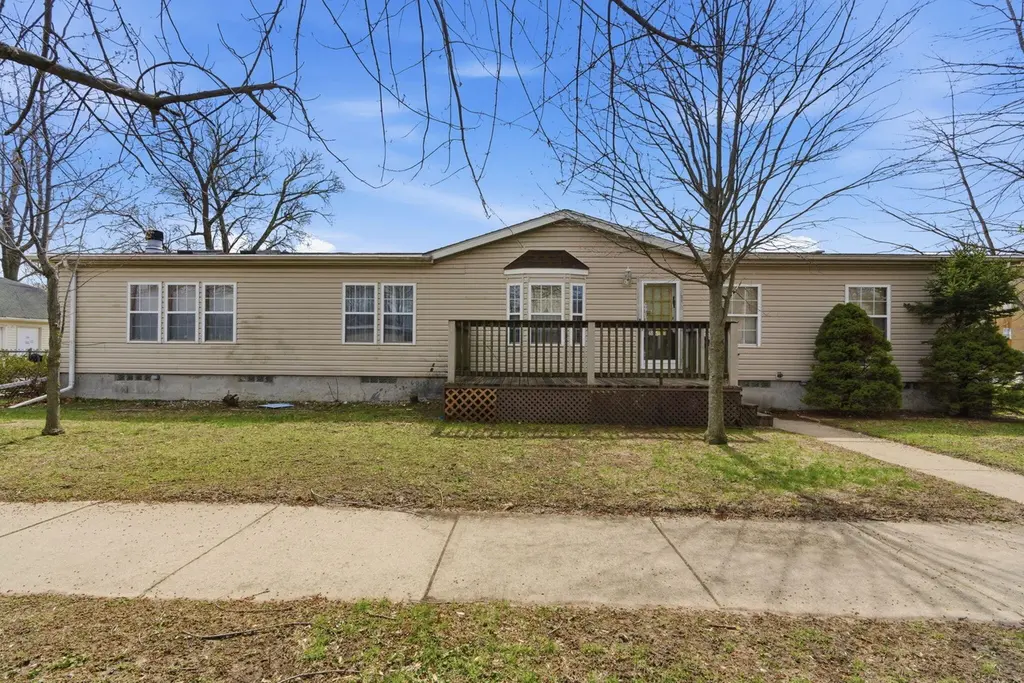
Listing remarks MLS
3 bedroom 2.5 bath modular home with a 3 car garage. All appliances in home will stay. Property is in a trust, property being sold as is. No Offers will be considered without the "as is" addendum. Highest and best offer to be submitted by 8am 3/4/24
Key facts
- Generous lot
- Oversized kitchen
- Full back porch
Tags
Property features AI
Exterior
- Parking: Additional parking; On-street parking; Driveway; Concrete surfaces; Garage available (approx. 2.5 spaces)
- Utilities: Public water; Public sewer
- Home design: One-level home; Built in 1992; Property listed as fixer
- Construction: Crawl space basement
- Exterior features: Neighborhood view; Exterior lighting
Interior
- Kitchen: Kitchen island
- Bedrooms: Primary bedroom; Bedroom 2; Bedroom 3
- Bathrooms: 2 full bathrooms; 1 half bathroom
- Heating & cooling: Central heating; Central air; Ceiling fans
- Interior features: High ceilings; Soaking tub; Open floorplan; Kitchen island; Wood-burning fireplace (1)
- Laundry & utility: No appliances listed
Neighborhood map
What this means for you Summary
Snapshot
- This is a 4-bed/2.0-bath single-family listed at $180k.
Deal economics
- At list price, monthly cash flow is $894 ($11k/yr) — positive.
- The deal already cash-flows at list — no discount required.
- Meets the 1% rule at list price ($3k rent vs $180k).
- Recommended offer: $169k (6.0% below list) — sets the bar for market timing.
- Cap rate 12.3% vs local median 5.8% in Hammond — top-decile yield for the area; either an underpriced asset or a hidden risk that comps aren't pricing in. Stress-test before assuming the spread holds.
Location & tenants
- Location reads 70/100 on livability (#143 in IN) — a middle-class / working-renter tenant base. Strengths: cost of living A+, housing A+, commute A; Watch: health & safety D+, employment D, schools F.
- School City Of Hammond (suburban): math 8% / reading 18% proficiency, ranked #289 of 301 in IN (top 96%) — low school quality limits family demand, transient renter base, plan for 1-2y turnover; 74% free/reduced lunch — lower-income household profile, screen leases tightly.
- Market conditions: Rents rising fast (+5.5%/yr); 63 active listings in the ZIP; 8 comparable units currently listed for rent nearby; rentals leasing fast (median 1d on market — plan ~1-2 weeks tenant-placement turnaround); 1,642 units permitted in Lake County in 2024 (14 in 5+ unit buildings).
- At $2,707/mo this rent would consume 52% of the median local household income ($63k/yr) (locally 507% of renters already pay >50% of income on rent) — very limited rent-growth headroom before tenants either downsize or default.
Forward outlook
- Local home prices are declining (-3.0%/yr); year-one equity from $1k of loan paydown is wiped out by about $5k of value loss. Plan a longer hold.
- Lake County population projected to shrink 7% by 2050 — rents likely to lag national; underwrite the cash flow, not the appreciation.
- At projected returns (-3.0% appreciation + 5.5% rent growth), your $50k cash investment doubles in ~6 years — after that, you're playing with house money.
Negotiation context
- It's been on market 71 days — a 6% lower offer ($169k) is reasonable based on typical stale-listing flexibility.
- 5 sale attempts since 26y ago; this cycle's ask has dropped $15k (8%) from the opening price — seller is motivated, your offer sets the floor, not the list.
- Current owner paid $140k; 28% above their basis — modest negotiation headroom, anchor on the comps not their cost.
Questions for the listing agent
- It's been on market 71 days. Have you received any prior offers? Is the seller open to a 6% concession, seller financing, or rate buy-down credit?
- Why hasn't it sold? Are there any deal-killer items the seller is aware of (foundation, flood, title, zoning, code violations)?
- Is there a deadline driving the sale (1031 exchange, divorce, estate, relocation)? That informs how much negotiation room exists.
- Schools are F-rated, which usually means shorter tenancies and higher turnover. Who's the typical renter profile here, and what's been the actual vacancy rate?
- Crime grade is F in this area — have there been break-ins, vandalism, or insurance claims at this property in the last 3 years? What carrier currently insures it and at what premium?
- What's the average days-on-market for RENTAL listings here right now (not sales)? A rising rental-DOM trend means longer vacancies and softer asking-rent achievability than the comps imply.
- What's the recent tenant-quality profile in this submarket — average credit score on applications, eviction rate, late-payment / NSF rate, and stable-employment percentage? A property-management company in the area should have these aggregated.
- How much new for-sale + rental construction is in the pipeline within 1–3 miles? Heavy new supply typically softens prices + rents 12–24 months out; constrained supply supports both.
Investment metrics
- 1% rule
- 1.50% ✓
- Cap rate
- 12.25%
- Cash-on-cash
- 21.29%
- DSCR
- 1.95
- GRM
- 5.5
CMA / ARV
- ARV (on-the-fly)
- $225,456
- Comps found
- 12
Show comp detail 12 sales within ~0.75 mi
| Address | Dist | Beds/Ba | Sqft | Sold | Price | $/sf | Match |
|---|---|---|---|---|---|---|---|
| 42 Indi Illi Pkwy | 0.14mi | 3/2.0 (-1) | 1,964 (+6%) | 3mo | $280,000 | $143 | 76 |
| 50 172nd St | 0.37mi | 3/1.5 (-1) | 1,854 (+0%) | 8mo | $282,500 | $152 | 69 |
| 7013 Jackson Ave | 0.44mi | 3/2.0 (-1) | 1,860 (+1%) | 6mo | $220,000 | $118 | 68 |
| 17244 Wentworth Ave | 0.63mi | 4/2.0 | 1,783 (-4%) | 1mo | $85,000 | $48 | 64 |
| 12 169th St | 0.16mi | 3/1.5 (-1) | 1,667 (-10%) | 7mo | $205,000 | $123 | 63 |
| 6360 Hohman Ave | 0.63mi | 3/1.5 (-1) | 1,833 (-1%) | 1mo | $160,000 | $87 | 61 |
| 7208 Monroe Ave | 0.59mi | 3/2.0 (-1) | 1,750 (-5%) | 1mo | $289,999 | $166 | 58 |
| 7115 Jackson Ave | 0.50mi | 4/2.0 | 2,000 (+8%) | 7mo | $220,000 | $110 | 57 |
| 6621 Monroe Ave | 0.59mi | 4/2.0 | 1,589 (-14%) | 2mo | $223,400 | $141 | 48 |
| 6547 Monroe Ave | 0.63mi | 3/2.0 (-1) | 2,050 (+11%) | 4mo | $250,000 | $122 | 45 |
| 7405 Meadow Lane Ave | 0.64mi | 3/1.0 (-1) | 1,680 (-9%) | 5mo | $193,200 | $115 | 42 |
| 835 170th St | 0.74mi | 3/2.0 (-1) | 2,096 (+13%) | 9mo | $239,000 | $114 | 31 |
Match score weights: distance 35% · size 25% · config 20% · recency 20%. Top-matched comps best support the ARV.
Projected returns pro-forma
-3.0% appreciation · 5.51% rent growth · sell at horizon
- IRR
- 16.6%
- Equity multiple
- 1.69×
- Total profit
- $34,819
- Equity at exit
- $26,824
- IRR
- 27.0%
- Equity multiple
- 3.66×
- Total profit
- $134,055
- Equity at exit
- $15,554
Cash invested: $50,372 (down + closing). Projections, not guarantees.
Landlord ↔ Tenant lean methodology
- Overall (STATE)
- 90 Strongly Landlord-Friendly
- State Indiana
- 90 Strongly Landlord-Friendly · R+11
- County
- — inherits STATE
- City
- — inherits STATE
ZIP-level market 46324
- Home prices YoY
- -9.6%
- Rents YoY
- 5.5%
- Active inventory
- 63
- Price-to-rent
- 5.5×
Monthly cashflow live
- Estimated rent
- $2,707 high interval (Pro) →
- Mortgage (P&I)
- −$943
- Tax from tax record
- −$226 /mo · $2,713/yr
- Insurance
- −$75
- HOA
- −$0
- Vacancy / Maint / Mgmt
- −$568
- Net cashflow
- $894
Break-even live
UW: 25.0% down · 7.5% · 30yr · 1.5% tax · 5.0% vac · 8.0% maint · 8.0% mgmt
Financing live
Cash to close
- Down payment
- $44,975
- Closing costs
- $5,397
- Reserves months
- —
- Total cash needed
- —
Loan-product check · same deal, 3 products live
Conventional
25% down · 7.5% · 30yr
- Down + closing
- —
- Monthly P&I
- —
- Monthly cashflow
- —
- DSCR
- —
- Eligible?
- —
Personal DTI + credit; lowest rate.
DSCR
20% down · 8.5% · 30yr
- Down + closing
- —
- Monthly P&I
- —
- Monthly cashflow
- —
- DSCR
- —
- Eligible?
- —
No personal income docs; deal must DSCR.
Hard money
10% down · 12.0% · 12mo
- Down + closing
- —
- Monthly P&I
- —
- Monthly cashflow
- —
- DSCR
- —
- Eligible?
- —
Short-term bridge; refi at stabilization.
Rent comps 8 comps
| Address | Beds | Baths | Sqft | Rent | $/sqft | DOM | Units | Dist |
|---|---|---|---|---|---|---|---|---|
| 252 Lawndale St Hammond, IN | 4.0 | 3.0 | 2016 | $2,600 | $1.29 | 1d | 1 | 0.14mi |
| 7611 Kinsley Pl Munster, IN | 3.0 | 2.0 | 1700 | $4,700 | $2.76 | 1d | 1 | 0.88mi |
| 7610 Manor Ave Munster, IN | 3.0 | 2.0 | 1700 | $4,750 | $2.79 | 1d | 1 | 0.90mi |
| 232 Gregory Ave Munster, IN | 3.0 | 1.5 | 1600 | $2,450 | $1.53 | 1d | 1 | 1.06mi |
| 7741 Hohman Ave Munster, IN | 4.0 | 2.0 | 2200 | $3,200 | $1.45 | 10d | 1 | 1.08mi |
| 34 Elizabeth St Calumet City, IL | 3.0 | 1.0 | 1246 | $2,400 | $1.93 | 1d | 1 | 1.22mi |
| 7019 Chestnut Ave Hammond, IN | 3.0 | 1.5 | 1440 | $1,895 | $1.32 | 20d | 1 | 1.40mi |
| 7202 Chestnut Ave Hammond, IN | 3.0 | 2.0 | 2178 | $1,900 | $0.87 | 1d | 1 | 1.41mi |
Listing history 26 events
-
2026-06-18days on market $179,900 Active 71 DOM
-
2026-06-17days on market $179,900 Active 70 DOM
-
2026-06-16days on market $179,900 Active 69 DOM
-
2026-06-15days on market $179,900 Active 68 DOM
-
2026-06-13days on market $179,900 Active 66 DOM
-
2026-06-09days on market $179,900 Active 62 DOM
-
2026-06-08days on market $179,900 Active 61 DOM
-
2026-06-07pricedays on market $179,900 Active 60 DOM
-
2026-06-04days on market $184,900 Active 57 DOM
-
2026-06-03days on market $184,900 Active 56 DOM
-
2026-06-02days on market $184,900 Active 55 DOM
-
2026-06-01days on market $184,900 Active 54 DOM
-
2026-05-31days on market $184,900 Active 53 DOM
-
2026-05-20price $184,900
-
2026-04-08$194,900 Active
-
2026-02-12historical
-
2026-02-06price $150,000
-
2026-02-02price $199,000
-
2026-02-01status Active
-
2025-11-12status Pending
-
2025-11-12price $210,000
-
2025-10-23$195,000 Active
-
2024-03-20soldstatus $140,000 Closed 259-char remark
Show marketing remark (259 chars)
3 bedroom 2.5 bath modular home with a 3 car garage. All appliances in home will stay. Property is in a trust, property being sold as is. No Offers will be considered without the "as is" addendum. Highest and best offer to be submitted by 8am 3/4/24
-
2024-03-05status Pending 259-char remark
Show marketing remark (259 chars)
3 bedroom 2.5 bath modular home with a 3 car garage. All appliances in home will stay. Property is in a trust, property being sold as is. No Offers will be considered without the "as is" addendum. Highest and best offer to be submitted by 8am 3/4/24
-
2024-02-26$95,000 Active 259-char remark
Show marketing remark (259 chars)
3 bedroom 2.5 bath modular home with a 3 car garage. All appliances in home will stay. Property is in a trust, property being sold as is. No Offers will be considered without the "as is" addendum. Highest and best offer to be submitted by 8am 3/4/24
-
2000-06-05$124,900
ⓘ Source: listings_history table (triggers on properties + properties_extension) + one-shot
backfill from property_details.listing_events for pre-trigger history.
Tax reassessment forecast IN · Partial reset (capped growth)
- Current annual tax
- $2,713 · $226/mo
- Projected year-2 tax
- $2,713 · $226/mo
- Expected delta
- $0/yr ($0/mo · 0.0%)
ⓘ Screening estimate from a state-policy table — verify with the county assessor before closing.
Climate risk First Street
- Flood 1/10 Low FEMA zone X (unshaded) · 0% chance over 30 yrs
- Wildfire 1/10 Low
- Heat 3/10 Moderate 7 d/yr ≥102°F today · 15 d/yr by 30 yrs out
- Wind 2/10 Low 0% chance of damaging wind over 30 yrs
- Air quality 4/10 Moderate 5 unhealthy d/yr today · 6 by 30 yrs out
Nearby sold comps map
Loading sold comps map…
Walkable amenities ~0.75 mi
Loading nearby amenities…
Taxation est. · year 1
- Rental income
- $32,479
- − Mortgage interest
- −$10,077
- − Property taxes
- −$2,713
- − Insurance
- −$900
- − Repairs & maintenance
- −$2,598
- − Management
- −$2,598
- − Depreciation
- −$5,233
- Taxable income
- $8,359
- Est. tax owed @ 24.0%
- −$2,006
- After-tax cash flow
- $8,719/yr
For passive investors: Depreciation is non-cash, so a rental often shows a tax loss while cash-flowing — sheltering income. Rental losses are passive: they offset passive income freely, and up to $25,000/yr can offset ordinary (W-2) income if you actively participate and your MAGI is under $100k (phasing out to $0 by $150k); unused losses carry forward. On sale, claimed depreciation is recaptured at up to 25%, and gains may owe capital-gains tax (a 1031 exchange can defer both). Figures are a year-1 estimate at your 24.0% rate — not tax advice; consult a CPA.
Schools (NCES district)
- District
- School City Of Hammond
- NCES district ID
- 1804320
- Math proficiency
- 8% ▼ -18.00%
- Reading proficiency
- 18% ▼ -15.00%
- Median HH income
- $39,970
- Composite
- 11.11/100
- National rank
- #9730
- State rank
- #289 of 301 in IN
Livability — Hammond
- Score
- 70/100
- State rank
- #143
- US rank
- #7343
Category grades
Schools grade is shown separately in the Schools card above.
Census & demographics
- Census place
- Hammond, IN
- County
- Lake County · 422,878 people
- City population
- 58,809
- Metro
- Chicago-Naperville-Elgin, IL-IN-WI
- Population (ZIP)
- 21,409
- Household income
- $63,052
- Rent vs Own
- Severe rent burden
- 507.0
Population outlook (Lake County) Hauer SSP2
- Today (2025)
- 484,026 people
- By 2030
- 478,091 · -1.2%
- By 2040
- 462,974 · -4.3%
- By 2050
- 449,894 · -7.1%
- By 2075
- 436,169 · -9.9%
- By 2100
- 426,607 · -11.9%
Race, ethnicity, and origin ACS 2023
- Neighborhood character
- Diverse neighborhood (Simpson 0.69)
- Race & ethnicity
- Hispanic / Latino 39% White 34% Black 22% Two or more races 14% Asian 1% Native American 1%
- Hispanic origin (detail)
- Mexican 31% Puerto Rican 5%
- Common ancestry
- Romanian 5% Lithuanian 1% Italian 1%
- Foreign-born
- 10% · Canada
- Languages at home
- 79% English-only · Spanish 20%
Political lean MEDSL · Lake
- 2024 margin
- Lean D (+5.6) · D 52.1% · R 46.5% · Other 1.5%
- 2008→2024 swing
- -28.6pp toward R · 2008: 34.3pp · 2024: 5.6pp
- All cycles
- 2024: D+5.6 2020: D+15.1 2016: D+20.6 2012: D+31.0 2008: D+34.3
Not yet ingested
- Civics
- —
Market trends
- HPI YoY
- ▼ -37.65%
- Current HPI
- 352.8678
- Rent YoY
- ▲ 5.51%
- Metro
- Chicago-Naperville-Elgin, IL-IN-WI
- State GDP YoY
- ▲ 2.90%
- F500 in state
- 18
Industry mix (Fortune 500 HQ in IN)
| Industry | F500 HQs | Revenue |
|---|---|---|
| Industrial Machinery | 2 | $37B |
|
||
| Healthcare | 1 | $177B |
|
||
| Pharmaceuticals | 1 | $45B |
|
||
| Metals / Steel | 1 | $18B |
|
||
| Agriculture | 1 | $17B |
|
||
| Packaging | 1 | $12B |
|
||
Price history
+48.0% since first listed13 events — show timeline
- 2026-05-20 Price Changed $184,900 NIRA MLS as Distributed by MLS Grid
- 2026-04-08 Listed $194,900 NIRA MLS as Distributed by MLS Grid
- 2026-02-12 Listing Removed — NIRA MLS as Distributed by MLS Grid
- 2026-02-06 Price Changed $150,000 NIRA MLS as Distributed by MLS Grid
- 2026-02-02 Price Changed $199,000 NIRA MLS as Distributed by MLS Grid
- 2026-02-01 Relisted — NIRA MLS as Distributed by MLS Grid
- 2025-11-12 Pending — NIRA MLS as Distributed by MLS Grid
- 2025-11-12 Price Changed $210,000 NIRA MLS as Distributed by MLS Grid
- 2025-10-23 Listed $195,000 NIRA MLS as Distributed by MLS Grid
- 2024-03-20 Sold (MLS) $140,000 NIRA MLS as Distributed by MLS Grid
- 2024-03-05 Pending — NIRA MLS as Distributed by MLS Grid
- 2024-02-26 Listed $95,000 NIRA MLS as Distributed by MLS Grid
- 2000-06-05 Listed $124,900 NIRA MLS as Distributed by MLS Grid
Property tax history
+0.8%/yrLatest (2024): $2,713 · -12.3% YoY. Source: county tax records.
Cash-flow waterfall
monthlySold comps — $/sqft
last 12 mo · ≤1 miLoading sold comps…