 🏷️ Likely Rental
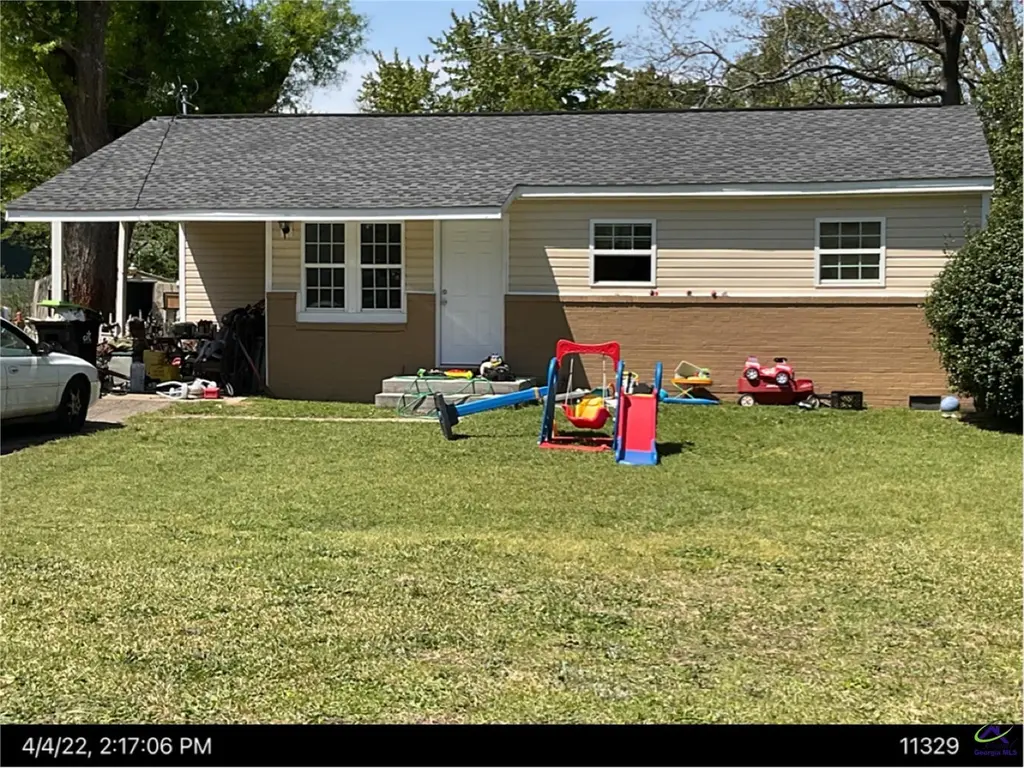
301 Kingsbury Circle Cir · Warner Robins, GA
Flood risk 1/10 · Minimal
- FEMA flood zone
- X (unshaded)
- Chance of flooding over 30 yrs
- 0.0%
- Est. flood insurance / yr
- $507 – $1,088
Fire risk 1/10 · Minimal
- Est. fire insurance / yr
- $963 – $1,789
Heat risk 7/10 · Major
- Hot days now (above 108°F)
- 7 days/yr
- Hot days in 30 yrs
- 18 days/yr
Wind risk 8/10 · Major
- Chance of severe wind over 30 yrs
- 80.0%
Air-quality risk 3/10 · Minor
- Unhealthy air days now
- 2 days/yr
- Unhealthy air days in 30 yrs
- 4 days/yr
Risk factors via First Street. Map © Google.
Why this score? — see what drove the B+ grade
The composite is a weighted blend of 9 inputs, each scored 0–100. Each bar is that input's sub-score; the figure is the points it added to the 100-point composite (weight × sub-score).
- Cash flow +30.0/30.0
- ARV discount +15.0/15.0
- 1% rule +10.0/10.0
- DSCR +10.0/10.0
- Schools +3.9/10.0
- Livability +3.2/5.0
- Rent growth +2.9/5.0
- Condition / age +2.5/5.0
- Appreciation +0.0/10.0
$75,000
🖨 Deal sheet 📄 Offer letter ✓ Due diligence
Listing remarks MLS
Great 1st time Home Buyer , or Investment home, 3BR, 1BA, Back yard completely fenced in. House remodeled in year 2017 with new Architecture Roof, Electrical Upgrade, New Kitchen Cabinets and New HVAC. As an Investment for a Rental range from $1300 to $1,400/mo. Selling " AS IS " Call Listing Agent to schedule a tour. Conventional Financing
Key facts
- Remodeled
- New hvac
- New kitchen cabinets
Tags
Neighborhood map
What this means for you Summary
Snapshot
- This is a 3-bed/1.0-bath single-family listed at $75k.
Deal economics
- At list price, monthly cash flow is $529 ($6k/yr) — positive.
- The deal already cash-flows at list — no discount required.
- Meets the 1% rule at list price ($1k rent vs $75k).
- Recommended offer: $74k (1.5% below list) — sets the bar for market timing.
- Cap rate 14.8% vs local median 4.9% in Warner Robins — top-decile yield for the area; either an underpriced asset or a hidden risk that comps aren't pricing in. Stress-test before assuming the spread holds.
Location & tenants
- Location reads 65/100 on livability (#227 in GA) — a middle-class / working-renter tenant base. Strengths: cost of living A+, housing A+, health & safety A+; Watch: schools D+, employment D+, crime F.
- Houston County (urban): math 43% / reading 46% proficiency, ranked #23 of 174 in GA (top 13%) — families likely to look elsewhere, expect single-tenant / working-renter base with shorter leases.
- Market conditions: Rents rising (+1.7%/yr); 286 active listings in the ZIP; 23 comparable units currently listed for rent nearby; rentals lingering (median 44d on market — plan ~5-8 weeks vacancy on turnover, expect pricing pressure); 57% of comp listings sitting > 30 days — soft ceiling on asking rent; solid renter incomes; 1,545 units permitted in Houston County in 2024 (336 in 5+ unit buildings).
Forward outlook
- Local home prices are declining (-3.0%/yr); year-one equity from $519 of loan paydown is wiped out by about $2k of value loss. Plan a longer hold.
- Houston County population projected at +22% by 2050 — long-run rental-demand tailwind backs the buy-and-hold thesis.
- At projected returns (-3.0% appreciation + 1.7% rent growth), your $21k cash investment doubles in ~5 years — after that, you're playing with house money.
Negotiation context
- It's been on market 18 days — a 2% lower offer ($74k) is reasonable based on typical stale-listing flexibility.
- 4 sale attempts since 9y ago; this cycle's ask has dropped $24k (24%) from the opening price — seller is motivated, your offer sets the floor, not the list.
- Current owner paid $12k; list at $75k implies a 525% gain — meaningful room to come down on a strong offer.
Risks & watch-outs
- Watch-outs: built in 1958 — expect roof / HVAC / electrical / plumbing capex.
- Climate carrying-cost: severe wind risk, 80% chance of damaging wind over 30y; extreme-heat days projected 7→18/yr by 2055 (HVAC capex compounding) — expect insurance premiums to compound above CPI over the hold.
Questions for the listing agent
- Built in 1958 — when were the roof, HVAC, electrical panel, plumbing, and water heater last replaced?
- Is there a deadline driving the sale (1031 exchange, divorce, estate, relocation)? That informs how much negotiation room exists.
- Schools are D-rated, which usually means shorter tenancies and higher turnover. Who's the typical renter profile here, and what's been the actual vacancy rate?
- Crime grade is F in this area — have there been break-ins, vandalism, or insurance claims at this property in the last 3 years? What carrier currently insures it and at what premium?
- What's the average days-on-market for RENTAL listings here right now (not sales)? A rising rental-DOM trend means longer vacancies and softer asking-rent achievability than the comps imply.
- What's the recent tenant-quality profile in this submarket — average credit score on applications, eviction rate, late-payment / NSF rate, and stable-employment percentage? A property-management company in the area should have these aggregated.
- How much new for-sale + rental construction is in the pipeline within 1–3 miles? Heavy new supply typically softens prices + rents 12–24 months out; constrained supply supports both.
Investment metrics
- 1% rule
- 1.70% ✓
- Cap rate
- 14.76%
- Cash-on-cash
- 30.24%
- DSCR
- 2.35
- GRM
- 4.9
CMA / ARV
- ARV (median comp)
- $125,816
- List price
- $75,000
- Delta
- -40.39%
- Verdict
- UNDERPRICED
- Comps
- 20 within 1.0 mi
Show comp detail 12 sales within ~0.75 mi
| Address | Dist | Beds/Ba | Sqft | Sold | Price | $/sf | Match |
|---|---|---|---|---|---|---|---|
| 214 Kingsbury Cir | 0.10mi | 3/1.0 | 845 (0%) | 2mo | $124,000 | $147 | 94 |
| 724 Mcarthur Blvd | 0.44mi | 3/1.0 | 888 (+5%) | 4mo | $115,000 | $130 | 68 |
| 1312 Hartley Ave | 0.65mi | 2/1.0 (-1) | 825 (-2%) | 4mo | $140,000 | $170 | 58 |
| 308 Diggs Blvd | 0.61mi | 2/1.0 (-1) | 888 (+5%) | 0mo | $55,000 | $62 | 58 |
| 221 Meadowdale Dr | 0.60mi | 2/1.0 (-1) | 800 (-5%) | 2mo | $1,100 | $1 | 57 |
| 711 Mcarthur Blvd | 0.50mi | 2/1.0 (-1) | 888 (+5%) | 8mo | $104,500 | $118 | 56 |
| 920 Mcarthur Blvd | 0.61mi | 2/1.0 (-1) | 888 (+5%) | 2mo | $48,000 | $54 | 56 |
| 129 Tinker Blvd | 0.64mi | 2/1.0 (-1) | 888 (+5%) | 8mo | $100,000 | $113 | 50 |
| 601 Paul St | 0.51mi | 3/1.0 | 965 (+14%) | 4mo | $55,000 | $57 | 49 |
| 215 Peachtree Cir | 0.56mi | 2/1.0 (-1) | 744 (-12%) | 3mo | $73,900 | $99 | 46 |
| 215 Peachtree Cir | 0.56mi | 2/1.0 (-1) | 744 (-12%) | 4mo | $73,900 | $99 | 46 |
| 1326 Joseph Ave | 0.67mi | 2/1.0 (-1) | 725 (-14%) | 8mo | $116,000 | $160 | 34 |
Match score weights: distance 35% · size 25% · config 20% · recency 20%. Top-matched comps best support the ARV.
Projected returns pro-forma
-3.0% appreciation · 1.67% rent growth · sell at horizon
- IRR
- 23.4%
- Equity multiple
- 1.95×
- Total profit
- $19,861
- Equity at exit
- $11,183
- IRR
- 30.5%
- Equity multiple
- 3.57×
- Total profit
- $53,948
- Equity at exit
- $6,485
Cash invested: $21,000 (down + closing). Projections, not guarantees.
Landlord ↔ Tenant lean methodology
- Overall (STATE)
- 90 Strongly Landlord-Friendly
- State Georgia
- 90 Strongly Landlord-Friendly · R+3
- County
- — inherits STATE
- City
- — inherits STATE
ZIP-level market 31088
- Rents YoY
- 1.7%
- Active inventory
- 286
- Price-to-rent
- 4.9×
Monthly cashflow live
- Estimated rent
- $1,273 high interval (Pro) →
- Mortgage (P&I)
- −$393
- Tax from tax record
- −$52 /mo · $622/yr
- Insurance
- −$31
- HOA
- −$0
- Vacancy / Maint / Mgmt
- −$267
- Net cashflow
- $529
Break-even live
UW: 25.0% down · 7.5% · 30yr · 1.5% tax · 5.0% vac · 8.0% maint · 8.0% mgmt
Financing live
Cash to close
- Down payment
- $18,750
- Closing costs
- $2,250
- Reserves months
- —
- Total cash needed
- —
Loan-product check · same deal, 3 products live
Conventional
25% down · 7.5% · 30yr
- Down + closing
- —
- Monthly P&I
- —
- Monthly cashflow
- —
- DSCR
- —
- Eligible?
- —
Personal DTI + credit; lowest rate.
DSCR
20% down · 8.5% · 30yr
- Down + closing
- —
- Monthly P&I
- —
- Monthly cashflow
- —
- DSCR
- —
- Eligible?
- —
No personal income docs; deal must DSCR.
Hard money
10% down · 12.0% · 12mo
- Down + closing
- —
- Monthly P&I
- —
- Monthly cashflow
- —
- DSCR
- —
- Eligible?
- —
Short-term bridge; refi at stabilization.
Rent comps 23 comps
| Address | Beds | Baths | Sqft | Rent | $/sqft | DOM | Units | Dist |
|---|---|---|---|---|---|---|---|---|
| 1436 Watson Blvd Warner Robins, GA | 2.0 | 1.5 | 1044 | $1,042 | $1.00 | 13d | 8 | 0.30mi |
| 1436 Watson Blvd Warner Robins, GA | 2.0 | 1.5 | 1044 | $1,070 | $1.02 | 43d | 6 | 0.30mi |
| 103 Dellwood Cir Warner Robins, GA | 2.0 | 1.0 | 1000 | $1,050 | $1.05 | 21d | 1 | 0.44mi |
| 103 Dellwood Cir Unit 107-B Warner Robins, GA | 2.0 | 1.0 | 850 | $725 | $0.85 | 21d | 1 | 0.47mi |
| 114 Forrester Dr Warner Robins, GA | 3.0 | 1.0 | 810 | $1,100 | $1.36 | 43d | 1 | 0.54mi |
| Blue Pines Apartments Warner Robins, GA | 1.0–2.0 | 1.0 | 670 | $1,025 | $1.53 | 13d | 2 | 0.58mi |
| 607 McArthur Blvd Warner Robins, GA | 2.0 | 1.0 | 804 | $1,250 | $1.55 | 21d | 1 | 0.68mi |
| 607 McArthur Blvd Warner Robins, GA | 2.0 | 1.0 | 804 | $1,250 | $1.55 | 43d | 1 | 0.68mi |
| 1311 Alma Ave Warner Robins, GA | 3.0 | 1.0 | 1073 | $1,150 | $1.07 | 43d | 1 | 0.82mi |
| 805 Crestwood Ter Warner Robins, GA | 3.0 | 1.0 | 864 | $1,125 | $1.30 | 43d | 1 | 0.85mi |
| 115 Arnold Blvd Warner Robins, GA | 3.0 | 2.0 | 1037 | $1,300 | $1.25 | 43d | 1 | 0.86mi |
| 314 McArthur Blvd Warner Robins, GA | 3.0 | 1.0 | 1100 | $1,400 | $1.27 | 43d | 1 | 0.90mi |
| 319 Orchard Ln Warner Robins, GA | 3.0 | 1.0 | 950 | $1,400 | $1.47 | 43d | 1 | 1.03mi |
| 111 Marilyn Dr Warner Robins, GA | 3.0 | 1.0 | 912 | $1,175 | $1.29 | 21d | 1 | 1.03mi |
| 111 Marilyn Dr Warner Robins, GA | 3.0 | 1.0 | 912 | $1,250 | $1.37 | 43d | 1 | 1.03mi |
| 202 Wendan Way Warner Robins, GA | 4.0 | 1.0 | 1036 | $1,075 | $1.04 | 13d | 1 | 1.04mi |
| 318 Bruce St Warner Robins, GA | 3.0 | 1.0 | 960 | $1,150 | $1.20 | 43d | 1 | 1.16mi |
| 114 Forrester Dr Warner Robins, GA | 3.0 | 1.0 | 810 | $1,100 | $1.36 | 21d | 1 | 1.16mi |
| 210 Woodcrest Cir Warner Robins, GA | 2.0 | 2.0 | 823 | $1,250 | $1.52 | 43d | 1 | 1.24mi |
| 600 Arizona Ave Warner Robins, GA | 1.0–3.0 | 1.0–1.5 | 912 | $1,100 | $1.21 | 13d | 29 | 1.27mi |
| 1005 Elberta Rd Warner Robins, GA | 1.0–2.0 | 1.0 | 620 | $1,045 | $1.68 | 43d | 19 | 1.46mi |
| 119 Vicki Lynn Dr Warner Robins, GA | 1.0–3.0 | 1.0–2.0 | 962 | $1,199 | $1.25 | 43d | 81 | 1.49mi |
| 119 Vicki Lynn Dr Warner Robins, GA | 1.0–3.0 | 1.0–2.0 | 962 | $1,139 | $1.18 | 13d | 9 | 1.49mi |
Listing history 9 events
-
2026-05-13status Pending 353-char remark
Show marketing remark (353 chars)
Great 1st time Home Buyer , or Investment home, 3BR, 1BA, Back yard completely fenced in. House remodeled in year 2017 with new Architecture Roof, Electrical Upgrade, New Kitchen Cabinets and New HVAC. As an Investment for a Rental range from $1300 to $1,400/mo. Selling " AS IS " Call Listing Agent to schedule a tour. Conventional Financing
-
2026-04-28status Active 353-char remark
Show marketing remark (353 chars)
Great 1st time Home Buyer , or Investment home, 3BR, 1BA, Back yard completely fenced in. House remodeled in year 2017 with new Architecture Roof, Electrical Upgrade, New Kitchen Cabinets and New HVAC. As an Investment for a Rental range from $1300 to $1,400/mo. Selling " AS IS " Call Listing Agent to schedule a tour. Conventional Financing
-
2026-04-28price $75,000 353-char remark
Show marketing remark (353 chars)
Great 1st time Home Buyer , or Investment home, 3BR, 1BA, Back yard completely fenced in. House remodeled in year 2017 with new Architecture Roof, Electrical Upgrade, New Kitchen Cabinets and New HVAC. As an Investment for a Rental range from $1300 to $1,400/mo. Selling " AS IS " Call Listing Agent to schedule a tour. Conventional Financing
-
2026-02-13historical 353-char remark
Show marketing remark (353 chars)
Great 1st time Home Buyer , or Investment home, 3BR, 1BA, Back yard completely fenced in. House remodeled in year 2017 with new Architecture Roof, Electrical Upgrade, New Kitchen Cabinets and New HVAC. As an Investment for a Rental range from $1300 to $1,400/mo. Selling " AS IS " Call Listing Agent to schedule a tour. Conventional Financing
-
2026-02-09$99,000 Active 353-char remark
Show marketing remark (353 chars)
Great 1st time Home Buyer , or Investment home, 3BR, 1BA, Back yard completely fenced in. House remodeled in year 2017 with new Architecture Roof, Electrical Upgrade, New Kitchen Cabinets and New HVAC. As an Investment for a Rental range from $1300 to $1,400/mo. Selling " AS IS " Call Listing Agent to schedule a tour. Conventional Financing
-
2017-02-28soldstatus $12,000 156-char remark
Show marketing remark (156 chars)
Investor Special! SOLD AS IS. This quaint home sits on a beautiful corner lot. This property is priced to sell. Potentially perfect home or INCOME PROPERTY!
-
2017-02-28soldstatus $12,000
Show marketing remark (156 chars)
Investor Special! SOLD AS IS. This quaint home sits on a beautiful corner lot. This property is priced to sell. Potentially perfect home or INCOME PROPERTY!
-
2017-01-23$19,000 156-char remark
Show marketing remark (156 chars)
Investor Special! SOLD AS IS. This quaint home sits on a beautiful corner lot. This property is priced to sell. Potentially perfect home or INCOME PROPERTY!
-
2017-01-23$19,000
Show marketing remark (156 chars)
Investor Special! SOLD AS IS. This quaint home sits on a beautiful corner lot. This property is priced to sell. Potentially perfect home or INCOME PROPERTY!
ⓘ Source: listings_history table (triggers on properties + properties_extension) + one-shot
backfill from property_details.listing_events for pre-trigger history.
Tax reassessment forecast GA · Resets to sale price
- Current annual tax
- $622 · $52/mo
- Projected year-2 tax
- $690 · $58/mo
- Expected delta
- +$68/yr (+$6/mo · 10.9%)
ⓘ Screening estimate from a state-policy table — verify with the county assessor before closing.
Climate risk First Street
- Flood 1/10 Low FEMA zone X (unshaded) · 0% chance over 30 yrs
- Wildfire 1/10 Low
- Heat 7/10 Severe 7 d/yr ≥108°F today · 18 d/yr by 30 yrs out
- Wind 8/10 Severe 80% chance of damaging wind over 30 yrs
- Air quality 3/10 Moderate 2 unhealthy d/yr today · 4 by 30 yrs out
Nearby sold comps map
Loading sold comps map…
Walkable amenities ~0.75 mi
Loading nearby amenities…
Taxation est. · year 1
- Rental income
- $15,274
- − Mortgage interest
- −$4,201
- − Property taxes
- −$622
- − Insurance
- −$375
- − Repairs & maintenance
- −$1,222
- − Management
- −$1,222
- − Depreciation
- −$2,182
- Taxable income
- $5,450
- Est. tax owed @ 24.0%
- −$1,308
- After-tax cash flow
- $5,042/yr
For passive investors: Depreciation is non-cash, so a rental often shows a tax loss while cash-flowing — sheltering income. Rental losses are passive: they offset passive income freely, and up to $25,000/yr can offset ordinary (W-2) income if you actively participate and your MAGI is under $100k (phasing out to $0 by $150k); unused losses carry forward. On sale, claimed depreciation is recaptured at up to 25%, and gains may owe capital-gains tax (a 1031 exchange can defer both). Figures are a year-1 estimate at your 24.0% rate — not tax advice; consult a CPA.
Schools (NCES district)
- District
- Houston County
- NCES district ID
- 1302880
- Math proficiency
- 43% ▼ -7.00%
- Reading proficiency
- 46% ▼ -2.00%
- Median HH income
- $54,823
- Composite
- 38.68/100
- National rank
- #4144
- State rank
- #23 of 174 in GA
Livability — Warner Robins
- Score
- 65/100
- State rank
- #227
- US rank
- #13290
Category grades
Schools grade is shown separately in the Schools card above.
Census & demographics
- Census place
- Warner Robins, GA
- County
- Houston County · 157,321 people
- City population
- 92,102
- Metro
- Warner Robins, GA
- Population (ZIP)
- 58,585
- Household income
- $83,082
- Rent vs Own
- Severe rent burden
- 1668.0
Population outlook (Houston County) Hauer SSP2
- Today (2025)
- 169,502 people
- By 2030
- 178,486 · +5.3%
- By 2040
- 194,642 · +14.8%
- By 2050
- 207,119 · +22.2%
- By 2075
- 231,480 · +36.6%
- By 2100
- 235,034 · +38.7%
Race, ethnicity, and origin ACS 2023
- Neighborhood character
- Diverse neighborhood (Simpson 0.63)
- Race & ethnicity
- White 51% Black 32% Two or more races 9% Hispanic / Latino 7% Asian 4%
- Hispanic origin (detail)
- Mexican 4%
- Common ancestry
- Romanian 2% Slovak 2% Lithuanian 2%
- Foreign-born
- 9% · Canada, Vietnam, Jamaica
- Languages at home
- 90% English-only · Spanish 5% Other Asian/Pacific 2% Vietnamese 2%
Political lean MEDSL · Houston
- 2024 margin
- R (+11.3) · D 44.0% · R 55.3%
- 2008→2024 swing
- +8.9pp toward D · 2008: -20.2pp · 2024: -11.3pp
- All cycles
- 2024: R+11.3 2020: R+12.4 2016: R+21.6 2012: R+20.7 2008: R+20.2
Not yet ingested
- Civics
- —
Market trends
- HPI YoY
- ▼ -135.75%
- Current HPI
- 219.8261
- Rent YoY
- ▲ 1.67%
- Metro
- Warner Robins, GA
- State GDP YoY
- ▲ 2.66%
- F500 in state
- 28
Industry mix (Fortune 500 HQ in GA)
| Industry | F500 HQs | Revenue |
|---|---|---|
| Paper / Packaging | 2 | $29B |
|
||
| Retail | 1 | $160B |
|
||
| Transportation / Logistics | 1 | $91B |
|
||
| Airlines | 1 | $62B |
|
||
| Consumer Goods | 1 | $47B |
|
||
| Utilities | 1 | $25B |
|
||
Price history
+294.7% since first listed9 events — show timeline
- 2026-05-13 Pending — CGMLS
- 2026-04-28 Relisted — CGMLS
- 2026-04-28 Price Changed $75,000 CGMLS
- 2026-02-13 Delisted — CGMLS
- 2026-02-09 Listed $99,000 CGMLS
- 2017-02-28 Sold (MLS) $12,000 GAMLS
- 2017-02-28 Sold (MLS) $12,000 FMLS
- 2017-01-23 Listed $19,000 GAMLS
- 2017-01-23 Listed $19,000 FMLS
Property tax history
+9.2%/yrLatest (2025): $622 · +5.2% YoY. Source: county tax records.
Cash-flow waterfall
monthlySold comps — $/sqft
last 12 mo · ≤1 miLoading sold comps…