1508 Cabo Dr · Riverbank, CA
Flood risk 1/10 · Minimal
- FEMA flood zone
- X (unshaded)
- Chance of flooding over 30 yrs
- 0.0%
- Est. flood insurance / yr
- $507 – $1,088
Fire risk 6/10 · Moderate
- Est. fire insurance / yr
- $659 – $1,223
Heat risk 6/10 · Moderate
- Hot days now (above 102°F)
- 7 days/yr
- Hot days in 30 yrs
- 15 days/yr
Wind risk 1/10 · Minimal
- Chance of severe wind over 30 yrs
- —
Air-quality risk 10/10 · Severe
- Unhealthy air days now
- 28 days/yr
- Unhealthy air days in 30 yrs
- 32 days/yr
Risk factors via First Street. Map © Google.
Why this score? — see what drove the B grade
The composite is a weighted blend of 9 inputs, each scored 0–100. Each bar is that input's sub-score; the figure is the points it added to the 100-point composite (weight × sub-score).
- Cash flow +30.0/30.0
- 1% rule +10.0/10.0
- DSCR +10.0/10.0
- ARV discount +7.5/15.0
- Schools +4.4/10.0
- Condition / age +4.0/5.0
- Livability +2.9/5.0
- Rent growth +2.5/5.0
- Appreciation +0.0/10.0
$131,900
🖨 Deal sheet 📄 Offer letter ✓ Due diligence
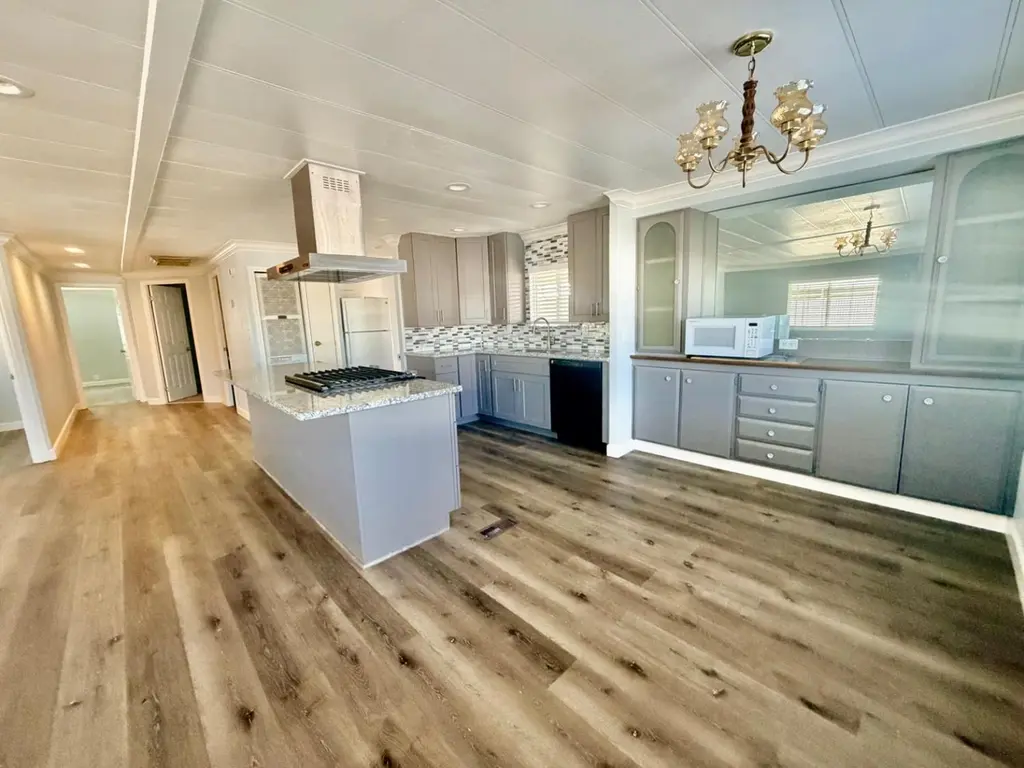
Listing remarks
This nicely updated double-wide home combines comfort and functionality at a great price. Recent upgrades include new flooring, fresh interior paint, and elegant 6-inch crown molding that brings a polished feel throughout. The kitchen features granite countertops and brand-new appliances, creating a practical yet inviting space for daily living. With 3 bedrooms and 2 full baths, there's plenty of room to suit your needs, and each bedroom comes with a walk-in closet for ample storage. Outside, you find an exterior storage shed and mature fruit trees that add to the charm, also the park has RV storage for an additional fee. Conveniently located near shopping, Costco, dining, Super Walmart, an
Key facts
- Walk-in closet
- New flooring
- Fresh interior paint
Tags
Property features AI
Finance
- Other: Located in Modesto, CA 95357 (1508 Cabo Dr); Directions: Coffee Rd to Claribel
- HOA & community: No homeowners association; Senior community
Exterior
- Parking: Attached covered parking (no garage)
- Utilities: Individual gas meter; 220V in kitchen; Public water; Public sewer
- Home design: Manufactured home in park; Double wide; Remodeled/updated; Built in 1973
- Construction: Aluminum and wood skirting; Other roof type
- Exterior features: Private backyard; Landscaped areas; Storage structure
Interior
- Kitchen: Gas cook top; Range hood; Garbage disposal; Kitchen island; Breakfast area; Slab countertops
- Bedrooms: 3 bedrooms
- Flooring: Carpet; Laminate
- Bathrooms: 2 full bathrooms; Shower stall(s)
- Heating & cooling: Central heating; Central air conditioning
- Interior features: Updated/remodeled interior; Dual-pane full windows; Living room with flexible/other features; Breakfast area and island in kitchen; Slab countertops; Kitchen and family/dining combined; additional space in kitchen
- Laundry & utility: Indoor laundry area
Neighborhood map
What this means for you Summary
Snapshot
- This is a 3-bed/2.0-bath manufactured listed at $132k. Condition is rated good.
Deal economics
- At list price, monthly cash flow is $725 ($9k/yr) — positive.
- The deal already cash-flows at list — no discount required.
- Meets the 1% rule at list price ($2k rent vs $132k).
- Recommended offer: $128k (3.0% below list) — sets the bar for market timing.
- Cap rate 12.9% vs local median 3.0% in Riverbank — top-decile yield for the area; either an underpriced asset or a hidden risk that comps aren't pricing in. Stress-test before assuming the spread holds.
Location & tenants
- Location reads 57/100 on livability (#757 in CA) — a working-class tenant base; expect higher turnover. Strengths: housing A+, crime B+, employment B; Watch: schools F, amenities D-, commute F.
- Sylvan Union Elementary (urban): math 44% / reading 52% proficiency, ranked #457 of 1,400 in CA (top 33%) — families likely to look elsewhere, expect single-tenant / working-renter base with shorter leases.
- Market conditions: 91 active listings in the ZIP; 3 comparable units currently listed for rent nearby; rentals leasing fast (median 14d on market — plan ~1-2 weeks tenant-placement turnaround); 923 units permitted in Stanislaus County in 2024 (63 in 5+ unit buildings).
Forward outlook
- Local home prices are declining (-3.0%/yr); year-one equity from $912 of loan paydown is wiped out by about $4k of value loss. Plan a longer hold.
- Stanislaus County population projected at +14% by 2050 — modest demand growth; plan on rents tracking national, not racing it.
- At projected returns (-3.0% appreciation + 3.0% rent growth), your $37k cash investment doubles in ~6 years — after that, you're playing with house money.
Negotiation context
- It's been on market 59 days — a 3% lower offer ($128k) is reasonable based on typical stale-listing flexibility.
Risks & watch-outs
- Climate carrying-cost: major wildfire risk; extreme-heat days projected 7→15/yr by 2055 (HVAC capex compounding) — expect insurance premiums to compound above CPI over the hold.
Questions for the listing agent
- It's been on market 59 days. Have you received any prior offers? Is the seller open to a 3% concession, seller financing, or rate buy-down credit?
- Built in 1973 — when were the roof, HVAC, electrical panel, plumbing, and water heater last replaced?
- Is there a deadline driving the sale (1031 exchange, divorce, estate, relocation)? That informs how much negotiation room exists.
- Schools are F-rated, which usually means shorter tenancies and higher turnover. Who's the typical renter profile here, and what's been the actual vacancy rate?
- What's the average days-on-market for RENTAL listings here right now (not sales)? A rising rental-DOM trend means longer vacancies and softer asking-rent achievability than the comps imply.
- What's the recent tenant-quality profile in this submarket — average credit score on applications, eviction rate, late-payment / NSF rate, and stable-employment percentage? A property-management company in the area should have these aggregated.
- How much new for-sale + rental construction is in the pipeline within 1–3 miles? Heavy new supply typically softens prices + rents 12–24 months out; constrained supply supports both.
Investment metrics
- 1% rule
- 1.57% ✓
- Cap rate
- 12.89%
- Cash-on-cash
- 23.57%
- DSCR
- 2.05
- GRM
- 5.3
CMA / ARV
No comps found within radius.
Projected returns pro-forma
-3.0% appreciation · 3.0% rent growth · sell at horizon
- IRR
- 16.7%
- Equity multiple
- 1.67×
- Total profit
- $24,857
- Equity at exit
- $19,667
- IRR
- 25.3%
- Equity multiple
- 3.20×
- Total profit
- $81,260
- Equity at exit
- $11,404
Cash invested: $36,932 (down + closing). Projections, not guarantees.
Landlord ↔ Tenant lean methodology
- Overall (STATE)
- 18 Strongly Tenant-Friendly
- State California
- 18 Strongly Tenant-Friendly · D+13
- County
- — inherits STATE
- City
- — inherits STATE
ZIP-level market 95357
- Home prices YoY
- -28.8%
- Active inventory
- 91
- Price-to-rent
- 5.3×
Monthly cashflow live
- Estimated rent
- $2,072 medium interval (Pro) →
- Mortgage (P&I)
- −$692
- Tax est. 1.5%
- −$165 /mo · $1,978/yr
- Insurance
- −$55
- HOA
- −$0
- Vacancy / Maint / Mgmt
- −$435
- Net cashflow
- $725
Break-even live
UW: 25.0% down · 7.5% · 30yr · 1.5% tax · 5.0% vac · 8.0% maint · 8.0% mgmt
Financing live
Cash to close
- Down payment
- $32,975
- Closing costs
- $3,957
- Reserves months
- —
- Total cash needed
- —
Loan-product check · same deal, 3 products live
Conventional
25% down · 7.5% · 30yr
- Down + closing
- —
- Monthly P&I
- —
- Monthly cashflow
- —
- DSCR
- —
- Eligible?
- —
Personal DTI + credit; lowest rate.
DSCR
20% down · 8.5% · 30yr
- Down + closing
- —
- Monthly P&I
- —
- Monthly cashflow
- —
- DSCR
- —
- Eligible?
- —
No personal income docs; deal must DSCR.
Hard money
10% down · 12.0% · 12mo
- Down + closing
- —
- Monthly P&I
- —
- Monthly cashflow
- —
- DSCR
- —
- Eligible?
- —
Short-term bridge; refi at stabilization.
Rent comps 3 comps
| Address | Beds | Baths | Sqft | Rent | $/sqft | DOM | Units | Dist |
|---|---|---|---|---|---|---|---|---|
| 3904 Monteview Dr Unit 1 Modesto, CA | 3.0 | 2.0 | 1100 | $1,995 | $1.81 | 21d | 1 | 1.04mi |
| 1305 Sylvan Meadows Dr Unit C Modesto, CA | 2.0 | 1.5 | 1037 | $2,150 | $2.07 | 13d | 1 | 1.29mi |
| 939 Claremont Ct Modesto, CA | 3.0 | 2.5 | 1406 | $2,100 | $1.49 | 13d | 1 | 1.39mi |
Listing history 16 events
-
2026-06-18days on market $131,900 Active 59 DOM
-
2026-06-17days on market $131,900 Active 58 DOM
-
2026-06-16days on market $131,900 Active 57 DOM
-
2026-06-15days on market $131,900 Active 56 DOM
-
2026-06-14days on market $131,900 Active 54 DOM
-
2026-06-13days on market $131,900 Active 53 DOM
-
2026-06-10days on market $131,900 Active 51 DOM
-
2026-06-09days on market $131,900 Active 50 DOM
-
2026-06-08days on market $131,900 Active 49 DOM
-
2026-06-07days on market $131,900 Active 48 DOM
-
2026-06-05pricedays on market $131,900 Active 45 DOM
-
2026-06-03days on market $134,900 Active 44 DOM
-
2026-06-02days on market $134,900 Active 43 DOM
-
2026-06-01days on market $134,900 Active 42 DOM
-
2026-05-31days on market $134,900 Active 41 DOM
-
2026-05-30days on market $134,900 Active 40 DOM
ⓘ Source: listings_history table (triggers on properties + properties_extension) + one-shot
backfill from property_details.listing_events for pre-trigger history.
Climate risk First Street
- Flood 1/10 Low FEMA zone X (unshaded) · 0% chance over 30 yrs
- Wildfire 6/10 Major
- Heat 6/10 Major 7 d/yr ≥102°F today · 15 d/yr by 30 yrs out
- Wind 1/10 Low
- Air quality 10/10 Extreme 28 unhealthy d/yr today · 32 by 30 yrs out
Nearby sold comps map
Loading sold comps map…
Walkable amenities ~0.75 mi
Loading nearby amenities…
Taxation est. · year 1
- Rental income
- $24,864
- − Mortgage interest
- −$7,388
- − Property taxes
- −$1,978
- − Insurance
- −$660
- − Repairs & maintenance
- −$1,989
- − Management
- −$1,989
- − Depreciation
- −$3,837
- Taxable income
- $7,022
- Est. tax owed @ 24.0%
- −$1,685
- After-tax cash flow
- $7,019/yr
For passive investors: Depreciation is non-cash, so a rental often shows a tax loss while cash-flowing — sheltering income. Rental losses are passive: they offset passive income freely, and up to $25,000/yr can offset ordinary (W-2) income if you actively participate and your MAGI is under $100k (phasing out to $0 by $150k); unused losses carry forward. On sale, claimed depreciation is recaptured at up to 25%, and gains may owe capital-gains tax (a 1031 exchange can defer both). Figures are a year-1 estimate at your 24.0% rate — not tax advice; consult a CPA.
Condition & rehab AI · 12 photos
This nicely updated double-wide home is move-in ready with recent upgrades and a polished feel throughout.
Value-add opportunities
- Both landscaping — enhances curb appeal and adds value
- Both storage shed — increases storage and adds value
- Both fruit trees — enhances curb appeal and adds value
Renovation cost estimate screening
Value-add ROI direction
- Both landscaping — enhances curb appeal and adds value ↑
- Both storage shed — increases storage and adds value ↑
- Both fruit trees — enhances curb appeal and adds value ↑
ⓘ Cost ranges are severity-bucket heuristics (US national rule-of-thumb). Get contractor quotes + a written scope before underwriting a rehab budget.
Schools (NCES district)
- District
- Sylvan Union Elementary
- NCES district ID
- 0638670
- Math proficiency
- 44% ▲ 2.00%
- Reading proficiency
- 52% ▬ 0.00%
- Median HH income
- $61,181
- Composite
- 44.28/100
- National rank
- #6167
- State rank
- #457 of 1400 in CA
Livability — Riverbank
- Score
- 57/100
- State rank
- #757
- US rank
- #22107
Category grades
Schools grade is shown separately in the Schools card above.
Census & demographics
- City population
- 25,593
- Population (ZIP)
- 14,283
Population outlook (Stanislaus County) Hauer SSP2
- Today (2025)
- 579,493 people
- By 2030
- 598,000 · +3.2%
- By 2040
- 630,930 · +8.9%
- By 2050
- 658,300 · +13.6%
- By 2075
- 712,363 · +22.9%
- By 2100
- 719,805 · +24.2%
Race, ethnicity, and origin ACS 2023
- Neighborhood character
- Diverse neighborhood (Simpson 0.64)
- Race & ethnicity
- Hispanic / Latino 46% White 37% Two or more races 16% Black 6% Asian 5% Native American 2% Pacific Islander 1%
- Hispanic origin (detail)
- Mexican 42%
- Common ancestry
- Russian 3% Italian 2% Iranian 2%
- Foreign-born
- 19% · Canada
- Languages at home
- 59% English-only · Spanish 31% Other Asian/Pacific 2% Other Indo-European 2%
Political lean MEDSL · Stanislaus
- 2024 margin
- R (+11.0) · D 43.2% · R 54.2% · Other 2.6%
- 2008→2024 swing
- -12.7pp toward R · 2008: 1.7pp · 2024: -11.0pp
- All cycles
- 2024: R+11.0 2020: D+0.8 2016: D+0.6 2012: D+0.7 2008: D+1.7
Not yet ingested
- Civics
- —
Market trends
- HPI YoY
- ▼ -114.94%
- Current HPI
- 283.9315
- Rent YoY
- —
- Metro
- —
- State GDP YoY
- ▲ 3.21%
- F500 in state
- 116
Industry mix (Fortune 500 HQ in CA)
| Industry | F500 HQs | Revenue |
|---|---|---|
| Technology | 27 | $1,492B |
|
||
| Financial Services | 3 | $174B |
|
||
| Retail | 3 | $44B |
|
||
| Insurance | 3 | $26B |
|
||
| Media / Entertainment | 2 | $115B |
|
||
| Pharmaceuticals / Biotech | 2 | $62B |
|
||
Cash-flow waterfall
monthlySold comps — $/sqft
last 12 mo · ≤1 miLoading sold comps…