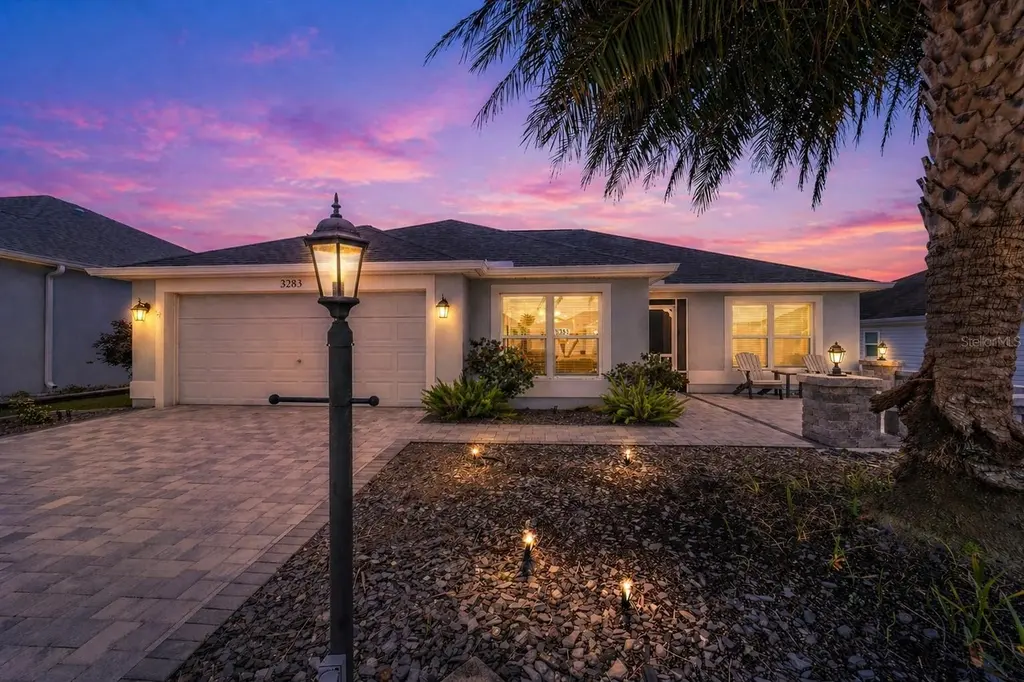
3283 Peterson Pl · Fruitland Park, FL
Flood risk 1/10 · Minimal
- FEMA flood zone
- X (unshaded)
- Chance of flooding over 30 yrs
- 0.0%
- Est. flood insurance / yr
- $507 – $1,088
Fire risk 2/10 · Minimal
- Est. fire insurance / yr
- $947 – $1,759
Heat risk 9/10 · Severe
- Hot days now (above 108°F)
- 7 days/yr
- Hot days in 30 yrs
- 23 days/yr
Wind risk 9/10 · Severe
- Chance of severe wind over 30 yrs
- 99.0%
Air-quality risk 3/10 · Minor
- Unhealthy air days now
- 2 days/yr
- Unhealthy air days in 30 yrs
- 4 days/yr
Risk factors via First Street. Map © Google.
Why this score? — see what drove the D grade
The composite is a weighted blend of 9 inputs, each scored 0–100. Each bar is that input's sub-score; the figure is the points it added to the 100-point composite (weight × sub-score).
- ARV discount +11.4/15.0
- Appreciation +10.0/10.0
- Cash flow +6.1/30.0
- Schools +4.2/10.0
- Livability +3.5/5.0
- 1% rule +2.8/10.0
- Rent growth +2.5/5.0
- Condition / age +2.5/5.0
- DSCR +0.4/10.0
$380,000
🖨 Deal sheet (PDF) 📄 Offer letter ✓ Due diligence
Listing remarks
Welcome to the Village of Pine Hills, where this beautifully maintained JASMINE MODEL (3 BEDROOM, 2 BATH) offers the perfect blend of comfort, style, and investment potential with TURNKEY option available separately. As you arrive, you’re immediately greeted by standout curb appeal with a PAVERED DRIVEWAY and a spacious PAVERED FRONT PORCH—an inviting place to enjoy your morning coffee. The SCREENED-IN FRONT ENTRY adds both charm and functionality, allowing you to enjoy Florida breezes year-round. Step through the entrance and into a welcoming FOYER that opens to a light and airy OPEN FLOOR PLAN featuring LUXURY VINYL PLANK FLOORING and VAULTED CEILINGS. To your left, the kitche
Key facts
- 5,492 sq ft lot
- 2 garage spots
- Community pool
Property features AI
Finance
- Other: Furnished: negotiable
- Financial info: Lease restrictions apply
- HOA & community: Community clubhouse; Community mailbox; Deed restrictions; Dog park; Fitness center; Golf carts allowed; Golf; Park; Community pool; Racquetball; Street lights; Senior community; Pets allowed; Total monthly fees approximately $204; Total annual fees approximately $2,448; Other annual assessment approximately $611; CDD present
Exterior
- Parking: Attached garage with 2 spaces
- Security: Smoke detectors
- Utilities: Public water; Public sewer; Electricity connected; Cable available; Broadband/high-speed internet available; Water connected
- Home design: Single family residence; One story; Northwest-facing; Entry level: One
- Construction: Block and stucco construction; Shingle roof; Slab foundation; Builder model: Jasmine; Built as a single-story home
- Exterior features: Front porch; Rear porch; Exterior lighting; Rain gutters; Sliding doors; Irrigation equipment; Paved roads
Interior
- Kitchen: Dishwasher; Disposal; Exhaust fan; Freezer; Microwave; Range; Refrigerator
- Bedrooms: 3 bedrooms
- Flooring: Carpet
- Bathrooms: 2 full bathrooms
- Heating & cooling: Central heating; Central air conditioning
- Interior features: Ceiling fans; Eat-in kitchen; Living room/dining room combo; Open floorplan; Split bedroom layout; Vaulted ceilings; Walk-in closets
- Laundry & utility: Washer and dryer included; Inside laundry room
Neighborhood map
What this means for you Summary
Snapshot
- This is a 3-bed/2.0-bath single-family listed at $380k.
Deal economics
- At list price, monthly cash flow is $-711 ($-9k/yr) — negative.
- To cash-flow at today's rent, offer at most $254k (33.1% below list).
- To meet the 1% rule (rent ≥ 1% of price), the offer needs to be $296k (22.1% below list).
- Recommended offer: $254k (33.1% below list) — sets the bar for cash-flow.
Location & tenants
- Location reads 70/100 on livability (#447 in FL) — a middle-class / working-renter tenant base. Strengths: housing A+, crime A, health & safety A-; Watch: schools D, amenities F, commute F.
- Lake (suburban): math 49% / reading 50% proficiency, ranked #37 of 73 in FL (top 51%) — families likely to look elsewhere, expect single-tenant / working-renter base with shorter leases.
- Market conditions: 265 active listings in the ZIP; 5 comparable units currently listed for rent nearby; rentals leasing fast (median 13d on market — plan ~1-2 weeks tenant-placement turnaround); solid renter incomes; 4,799 units permitted in Lake County in 2024 (814 in 5+ unit buildings).
- This rent runs 37% of the median local income ($97k/yr) — at the standard rent-burdened threshold; future hikes will face affordability resistance.
Forward outlook
- In year one you build about $41k of equity ($3k loan paydown + $38k appreciation (10.0% local appreciation)).
- Lake County population projected at +37% by 2050 — long-run rental-demand tailwind backs the buy-and-hold thesis.
- By year 2, paydown + projected appreciation supports a ~$65k cash-out refi (75% LTV) — recoverable capital for the next deal without selling this one.
Negotiation context
- It's been on market 49 days — a 3% lower offer ($369k) is reasonable based on typical stale-listing flexibility.
Risks & watch-outs
- Climate carrying-cost: severe wind risk, 99% chance of damaging wind over 30y; extreme-heat days projected 7→23/yr by 2055 (HVAC capex compounding) — expect insurance premiums to compound above CPI over the hold.
Questions for the listing agent
- What do current leases actually rent for vs. the listed asking? Can we see a recent rent roll and the last 12 months of T-12 income?
- It's been on market 49 days. Have you received any prior offers? Is the seller open to a 33% concession, seller financing, or rate buy-down credit?
- What does the HOA fee cover, when was the last increase, and are there any pending special assessments or reserve-fund shortfalls?
- Is there a deadline driving the sale (1031 exchange, divorce, estate, relocation)? That informs how much negotiation room exists.
- Schools are D-rated, which usually means shorter tenancies and higher turnover. Who's the typical renter profile here, and what's been the actual vacancy rate?
- The area grade is low — what's the realistic commute time and amenity access for the typical tenant pool here? Any planned neighborhood developments (good or bad) we should know about?
- What's the average days-on-market for RENTAL listings here right now (not sales)? A rising rental-DOM trend means longer vacancies and softer asking-rent achievability than the comps imply.
- What's the recent tenant-quality profile in this submarket — average credit score on applications, eviction rate, late-payment / NSF rate, and stable-employment percentage? A property-management company in the area should have these aggregated.
- How much new for-sale + rental construction is in the pipeline within 1–3 miles? Heavy new supply typically softens prices + rents 12–24 months out; constrained supply supports both.
Investment metrics
- 1% rule
- 0.78% ✗
- Cap rate
- 4.05%
- Cash-on-cash
- -8.02%
- DSCR
- 0.64
- GRM
- 10.7
CMA / ARV
- ARV (on-the-fly)
- $416,306
- Comps found
- 6
Show comp detail 6 sales within ~0.75 mi
| Address | Dist | Beds/Ba | Sqft | Sold | Price | $/sf | Match |
|---|---|---|---|---|---|---|---|
| 744 Shelton St | 0.14mi | 3/2.0 | 1,474 (-10%) | 13mo | $275,000 | $187 | 66 |
| 832 Parrish Pl | 0.51mi | 3/2.0 | 1,652 (+1%) | 12mo | $425,000 | $257 | 65 |
| 2975 Bowles Pl | 0.53mi | 3/2.0 | 1,652 (+1%) | 20mo | $500,000 | $303 | 58 |
| 1049 Carver Ct | 0.75mi | 3/2.0 | 1,652 (+1%) | 17mo | $420,000 | $254 | 50 |
| 301 Brookstone Ln | 0.57mi | 3/2.0 | 1,774 (+8%) | 14mo | $355,000 | $200 | 48 |
| 3180 Dressendorfer Dr | 0.62mi | 3/2.0 | 1,781 (+9%) | 15mo | $385,000 | $216 | 44 |
Match score weights: distance 35% · size 25% · config 20% · recency 20%. Top-matched comps best support the ARV.
Projected returns pro-forma
10.0% appreciation · 3.0% rent growth · sell at horizon
- IRR
- 18.7%
- Equity multiple
- 2.52×
- Total profit
- $161,974
- Equity at exit
- $342,334
- IRR
- 17.3%
- Equity multiple
- 5.82×
- Total profit
- $513,206
- Equity at exit
- $738,256
Cash invested: $106,400 (down + closing). Projections, not guarantees.
Landlord ↔ Tenant lean methodology
- Overall (STATE)
- 87 Strongly Landlord-Friendly
- State Florida
- 87 Strongly Landlord-Friendly · R+3
- County
- — inherits STATE
- City
- — inherits STATE
ZIP-level market 32163
- Home prices YoY
- 9.8%
- Active inventory
- 265
- Price-to-rent
- 10.7×
Monthly cashflow live
- Estimated rent
- $2,959 high interval (Pro) →
- Mortgage (P&I)
- −$1,993
- Tax from tax record
- −$694 /mo · $8,324/yr
- Insurance
- −$158
- HOA
- −$204
- Vacancy / Maint / Mgmt
- −$621
- Net cashflow
- $-711
Break-even live
Sensitivity live
| Price | -10% $-496 | -5% $-604 | +0% $-711 | +5% $-819 | +10% $-926 |
|---|---|---|---|---|---|
| Rent | -10% $-945 | -5% $-828 | +0% $-711 | +5% $-594 | +10% $-477 |
| Rate | -1.0pp $-520 | -0.5pp $-614 | base $-711 | +0.5pp $-810 | +1.0pp $-910 |
UW: 25.0% down · 7.5% · 30yr · 1.5% tax · 5.0% vac · 8.0% maint · 8.0% mgmt
Financing live
Cash to close
- Down payment
- $95,000
- Closing costs
- $11,400
- Reserves months
- —
- Total cash needed
- —
Loan-product check · same deal, 3 products live
Conventional
25% down · 7.5% · 30yr
- Down + closing
- —
- Monthly P&I
- —
- Monthly cashflow
- —
- DSCR
- —
- Eligible?
- —
Personal DTI + credit; lowest rate.
DSCR
20% down · 8.5% · 30yr
- Down + closing
- —
- Monthly P&I
- —
- Monthly cashflow
- —
- DSCR
- —
- Eligible?
- —
No personal income docs; deal must DSCR.
Hard money
10% down · 12.0% · 12mo
- Down + closing
- —
- Monthly P&I
- —
- Monthly cashflow
- —
- DSCR
- —
- Eligible?
- —
Short-term bridge; refi at stabilization.
Rent comps 5 comps
| Address | Beds | Baths | Sqft | Rent | $/sqft | DOM | Units | Dist |
|---|---|---|---|---|---|---|---|---|
| 1609 Hoofprint Ct Fruitland Park, FL | 4.0 | 2.0 | 2128 | $2,191 | $1.03 | 5d | 1 | 0.61mi |
| 3225 Wise Way The Villages, FL | 3.0 | 2.0 | 1652 | $2,650 | $1.60 | 24d | 1 | 0.83mi |
| 1069 Becker Ave The Villages, FL | 3.0 | 2.0 | 1656 | $5,000 | $3.02 | 24d | 1 | 0.84mi |
| 3530 E Harbor Dr Fruitland Park, FL | 1.0–3.0 | 1.0–2.0 | 1061 | $2,014 | $1.90 | 2d | 37 | 0.93mi |
| 307 Willard Ave Fruitland Park, FL | 3.0 | 2.0 | 1796 | $1,881 | $1.05 | 13d | 1 | 1.37mi |
HOA detail
- Monthly dues
- $204 · $2,448/yr
Listing history 14 events
-
2026-06-18days on market $380,000 Active 49 DOM
-
2026-06-17days on market $380,000 Active 48 DOM
-
2026-06-16days on market $380,000 Active 47 DOM
-
2026-06-15days on market $380,000 Active 46 DOM
-
2026-06-13days on market $380,000 Active 44 DOM
-
2026-06-09days on market $380,000 Active 40 DOM
-
2026-06-08days on market $380,000 Active 39 DOM
-
2026-06-07days on market $380,000 Active 38 DOM
-
2026-06-04days on market $380,000 Active 35 DOM
-
2026-06-03days on market $380,000 Active 34 DOM
-
2026-06-02days on market $380,000 Active 33 DOM
-
2026-06-01days on market $380,000 Active 32 DOM
-
2026-05-31days on market $380,000 Active 31 DOM
-
2026-04-30$380,000 Active
ⓘ Source: listings_history table (triggers on properties + properties_extension) + one-shot
backfill from property_details.listing_events for pre-trigger history.
Tax reassessment forecast FL · Resets to sale price
- Current annual tax
- $8,324 · $694/mo
- Projected year-2 tax
- $8,324 · $694/mo
- Expected delta
- $0/yr ($0/mo · 0.0%)
ⓘ Screening estimate from a state-policy table — verify with the county assessor before closing.
Climate risk First Street
- Flood 1/10 Low FEMA zone X (unshaded) · 0% chance over 30 yrs
- Wildfire 2/10 Low
- Heat 9/10 Extreme 7 d/yr ≥108°F today · 23 d/yr by 30 yrs out
- Wind 9/10 Extreme 99% chance of damaging wind over 30 yrs
- Air quality 3/10 Moderate 2 unhealthy d/yr today · 4 by 30 yrs out
Nearby sold comps map
Loading sold comps map…
Walkable amenities ~0.75 mi
Loading nearby amenities…
Taxation est. · year 1
- Rental income
- $35,509
- − Mortgage interest
- −$21,286
- − Property taxes
- −$8,324
- − Insurance
- −$1,900
- − Repairs & maintenance
- −$2,841
- − Management
- −$2,841
- − HOA
- −$2,448
- − Depreciation
- −$11,055
- Taxable loss
- −$15,185
- Est. tax savings @ 24.0%
- +$3,644
- After-tax cash flow
- $-4,889/yr
For passive investors: Depreciation is non-cash, so a rental often shows a tax loss while cash-flowing — sheltering income. Rental losses are passive: they offset passive income freely, and up to $25,000/yr can offset ordinary (W-2) income if you actively participate and your MAGI is under $100k (phasing out to $0 by $150k); unused losses carry forward. On sale, claimed depreciation is recaptured at up to 25%, and gains may owe capital-gains tax (a 1031 exchange can defer both). Figures are a year-1 estimate at your 24.0% rate — not tax advice; consult a CPA.
Schools (NCES district)
- District
- Lake
- NCES district ID
- 1201050
- Math proficiency
- 49% ▼ -7.00%
- Reading proficiency
- 50% ▼ -4.00%
- Median HH income
- $46,632
- Composite
- 42.05/100
- National rank
- #3327
- State rank
- #37 of 73 in FL
Livability — Fruitland Park
- Score
- 70/100
- State rank
- #447
- US rank
- #8098
Category grades
Schools grade is shown separately in the Schools card above.
Census & demographics
- Census place
- Fruitland Park, FL
- County
- Sumter County · 110,591 people
- City population
- 12,196
- Metro
- The Villages, FL
- Population (ZIP)
- 28,549
- Household income
- $96,775
- Rent vs Own
- Severe rent burden
- 307.0
Population outlook (Lake County) Hauer SSP2
- Today (2025)
- 386,640 people
- By 2030
- 417,107 · +7.9%
- By 2040
- 476,676 · +23.3%
- By 2050
- 531,296 · +37.4%
- By 2075
- 648,303 · +67.7%
- By 2100
- 698,530 · +80.7%
Race, ethnicity, and origin ACS 2023
- Neighborhood character
- Predominantly White (95%)
- Race & ethnicity
- White 95% Two or more races 2% Hispanic / Latino 2% Asian 1%
- Common ancestry
- Romanian 6% Lithuanian 3% Iranian 3%
- Foreign-born
- 6% · Canada, Vietnam
- Languages at home
- 96% English-only · Spanish 2% Vietnamese 1% Other Indo-European 0%
Political lean MEDSL · Lake
- 2024 margin
- Strong R (+24.7) · D 37.3% · R 62.0%
- 2008→2024 swing
- -11.2pp toward R · 2008: -13.5pp · 2024: -24.7pp
- All cycles
- 2024: R+24.7 2020: R+20.0 2016: R+23.1 2012: R+17.1 2008: R+13.5
Not yet ingested
- Civics
- —
Market trends
- HPI YoY
- ▲ 20.47%
- Current HPI
- 229.0075
- Rent YoY
- —
- Metro
- The Villages, FL
- State GDP YoY
- ▲ 3.28%
- F500 in state
- 36
Industry mix (Fortune 500 HQ in FL)
| Industry | F500 HQs | Revenue |
|---|---|---|
| Industrial Technology | 2 | $29B |
|
||
| Insurance | 2 | $17B |
|
||
| Retail | 1 | $60B |
|
||
| Technology Distribution | 1 | $58B |
|
||
| Homebuilding | 1 | $35B |
|
||
| Technology Manufacturing | 1 | $35B |
|
||
Price history
1 event — show timeline
- 2026-04-30 Listed $380,000 Stellar MLS as Distributed by MLS Grid
Property tax history
+13.7%/yrLatest (2025): $8,324 · +1.1% YoY. Source: county tax records.
Cash-flow waterfall
monthlySold comps — $/sqft
last 12 mo · ≤1 miLoading sold comps…