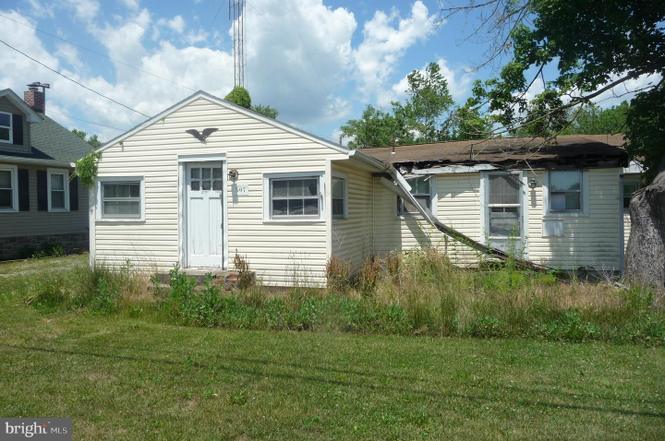
507 E Main St · Emmitsburg, MD
Flood risk No data
- FEMA flood zone
- —
- Chance of flooding over 30 yrs
- —
- Est. flood insurance / yr
- —
Fire risk No data
- Est. fire insurance / yr
- —
Heat risk No data
- Hot days now (above threshold)
- —
- Hot days in 30 yrs
- —
Wind risk No data
- Chance of severe wind over 30 yrs
- —
Air-quality risk No data
- Unhealthy air days now
- —
- Unhealthy air days in 30 yrs
- —
Risk factors via First Street. Map © Google.
Why this score? — see what drove the B- grade
The composite is a weighted blend of 9 inputs, each scored 0–100. Each bar is that input's sub-score; the figure is the points it added to the 100-point composite (weight × sub-score).
- Cash flow +30.0/30.0
- 1% rule +10.0/10.0
- DSCR +10.0/10.0
- ARV discount +7.5/15.0
- Livability +3.7/5.0
- Schools +3.4/10.0
- Rent growth +2.5/5.0
- Condition / age +2.5/5.0
- Appreciation +0.0/10.0
$74,900
🖨 Deal sheet (PDF) 📄 Offer letter ✓ Due diligence
Listing remarks
Offer Deadline of Wednesday June 17th at 50m. Great location with a double lot alongside 509 E Main St with Mixed Use Zoning for $74,900. Tear down the existing structure and build something great! Hold Harmless Agreement Required to Show which can be found in Documents.
Key facts
- Double lot
- Mixed use zoning
- 6,000 sq ft lot
Tags
Property features AI
Finance
- Other: Ground rent paid annually
- Financial info: Land assessed separately from improvements; Improvement and land assessed values available
Exterior
- Parking: Other parking
- Utilities: Public water; Public sewer
- Home design: Detached property; Fee simple ownership
- Construction: Vinyl siding; Other foundation; Above-grade and below-grade other structures; Year built per assessor
- Exterior features: Additional lot(s); Tidal water not present
Interior
- Bedrooms: 3 bedrooms on the main level
- Bathrooms: 1 full bathroom on the main level; 1 full bathroom total
- Heating & cooling: Other heating; Other cooling; Other hot water
- Interior features: No basement
Neighborhood map
What this means for you Summary
Snapshot
- This is a 3-bed/1.0-bath single-family listed at $75k.
Deal economics
- At list price, monthly cash flow is $738 ($9k/yr) — positive.
- The deal already cash-flows at list — no discount required.
- Meets the 1% rule at list price ($2k rent vs $75k).
- Cap rate 18.1% vs local median 2.0% in Emmitsburg — top-decile yield for the area; either an underpriced asset or a hidden risk that comps aren't pricing in. Stress-test before assuming the spread holds.
Location & tenants
- Location reads 74/100 on livability (#114 in MD, #4,757 nationally) — a middle-class / working-renter tenant base. Strengths: housing A+, health & safety A+, crime B+; Watch: amenities F, commute F.
- Frederick County Public Schools (other): math 27% / reading 43% proficiency, ranked #4 of 24 in MD (top 17%) — families likely to look elsewhere, expect single-tenant / working-renter base with shorter leases.
- Zoned schools: Emmitsburg Elementary (math 17% / reading 17%, grade F, #408 of 860 statewide, top 50%, 216 students, 42% FRL); Thurmont Middle (math 11% / reading 37%, grade F, #114 of 225 statewide, top 52%, 546 students, 41% FRL); Catoctin High (math 62% / reading 67%, grade B-, #55 of 222 statewide, top 26%, 784 students, 34% FRL) — zoned schools average 39% FRL vs 20% district-wide (18 pts higher); higher-poverty schools than district average — tighter screening recommended.
- Market conditions: 29 active listings in the ZIP; 1,562 units permitted in Frederick County in 2024 (374 in 5+ unit buildings).
Forward outlook
- Local home prices are declining (-3.0%/yr); year-one equity from $518 of loan paydown is wiped out by about $2k of value loss. Plan a longer hold.
- Frederick County population projected at +15% by 2050 — long-run rental-demand tailwind backs the buy-and-hold thesis.
- At projected returns (-3.0% appreciation + 3.0% rent growth), your $21k cash investment doubles in ~3 years — after that, you're playing with house money.
Negotiation context
- Only 7 days on market — expect competitive offers; lowballing is unlikely to land.
- 2 sale attempts since 25y ago with the ask held roughly flat each time — persistent listings suggest the price (not the market) is what's stuck; bring a comps-based counter.
Risks & watch-outs
- Watch-outs: built in 1947 — expect roof / HVAC / electrical / plumbing capex.
Questions for the listing agent
- Built in 1947 — when were the roof, HVAC, electrical panel, plumbing, and water heater last replaced?
- Is there a deadline driving the sale (1031 exchange, divorce, estate, relocation)? That informs how much negotiation room exists.
- Schools are D-rated, which usually means shorter tenancies and higher turnover. Who's the typical renter profile here, and what's been the actual vacancy rate?
- What's the average days-on-market for RENTAL listings here right now (not sales)? A rising rental-DOM trend means longer vacancies and softer asking-rent achievability than the comps imply.
- What's the recent tenant-quality profile in this submarket — average credit score on applications, eviction rate, late-payment / NSF rate, and stable-employment percentage? A property-management company in the area should have these aggregated.
- How much new for-sale + rental construction is in the pipeline within 1–3 miles? Heavy new supply typically softens prices + rents 12–24 months out; constrained supply supports both.
Investment metrics
- 1% rule
- 2.19% ✓
- Cap rate
- 18.11%
- Cash-on-cash
- 42.21%
- DSCR
- 2.88
- GRM
- 3.8
CMA / ARV
- ARV (on-the-fly)
- $259,720
- Comps found
- 7
Show comp detail 7 sales within ~0.75 mi
| Address | Dist | Beds/Ba | Sqft | Sold | Price | $/sf | Match |
|---|---|---|---|---|---|---|---|
| 9 Heritage Ln | 0.18mi | 3/2.0 | 1,236 (+2%) | 0mo | $340,000 | $275 | 83 |
| 12 1st Ave | 0.15mi | 3/1.5 | 1,131 (-6%) | 15mo | $270,000 | $239 | 68 |
| 17335 N Seton Ave | 0.41mi | 2/1.0 (-1) | 1,170 (-3%) | 11mo | $251,000 | $215 | 62 |
| 1008 Flat Run Ct | 0.12mi | 3/2.0 | 1,108 (-8%) | 18mo | $345,000 | $311 | 62 |
| 325 N Seton Ave | 0.35mi | 3/1.0 | 1,080 (-11%) | 10mo | $185,000 | $171 | 58 |
| 111 Seton Ave N | 0.38mi | 3/1.0 | 1,386 (+15%) | 13mo | $140,000 | $101 | 47 |
| 17347 N Seton Ave N | 0.43mi | 3/2.0 | 1,384 (+15%) | 15mo | $250,000 | $181 | 39 |
Match score weights: distance 35% · size 25% · config 20% · recency 20%. Top-matched comps best support the ARV.
Projected returns pro-forma
-3.0% appreciation · 3.0% rent growth · sell at horizon
- IRR
- 38.9%
- Equity multiple
- 2.66×
- Total profit
- $34,899
- Equity at exit
- $11,168
- IRR
- 45.4%
- Equity multiple
- 5.34×
- Total profit
- $91,089
- Equity at exit
- $6,476
Cash invested: $20,972 (down + closing). Projections, not guarantees.
Landlord ↔ Tenant lean methodology
- Overall (STATE)
- 27 Tenant-Leaning
- State Maryland
- 27 Tenant-Leaning · D+14
- County
- — inherits STATE
- City
- — inherits STATE
ZIP-level market 21727
- Home prices YoY
- -5.7%
- Active inventory
- 29
- Price-to-rent
- 3.8×
Monthly cashflow live
- Estimated rent
- $1,637 medium interval (Pro) →
- Mortgage (P&I)
- −$393
- Tax from tax record
- −$131 /mo · $1,574/yr
- Insurance
- −$31
- HOA
- −$0
- Vacancy / Maint / Mgmt
- −$344
- Net cashflow
- $738
Break-even live
Sensitivity live
| Price | -10% $780 | -5% $759 | +0% $738 | +5% $717 | +10% $695 |
|---|---|---|---|---|---|
| Rent | -10% $608 | -5% $673 | +0% $738 | +5% $802 | +10% $867 |
| Rate | -1.0pp $775 | -0.5pp $757 | base $738 | +0.5pp $718 | +1.0pp $699 |
UW: 25.0% down · 7.5% · 30yr · 1.5% tax · 5.0% vac · 8.0% maint · 8.0% mgmt
Financing live
Cash to close
- Down payment
- $18,725
- Closing costs
- $2,247
- Reserves months
- —
- Total cash needed
- —
Loan-product check · same deal, 3 products live
Conventional
25% down · 7.5% · 30yr
- Down + closing
- —
- Monthly P&I
- —
- Monthly cashflow
- —
- DSCR
- —
- Eligible?
- —
Personal DTI + credit; lowest rate.
DSCR
20% down · 8.5% · 30yr
- Down + closing
- —
- Monthly P&I
- —
- Monthly cashflow
- —
- DSCR
- —
- Eligible?
- —
No personal income docs; deal must DSCR.
Hard money
10% down · 12.0% · 12mo
- Down + closing
- —
- Monthly P&I
- —
- Monthly cashflow
- —
- DSCR
- —
- Eligible?
- —
Short-term bridge; refi at stabilization.
Listing history 9 events
-
2026-06-21status $74,900 Pending 7 DOM
-
2026-06-18days on market $74,900 Active 7 DOM
-
2026-06-17days on market $74,900 Active 6 DOM
-
2026-06-16days on market $74,900 Active 5 DOM
-
2026-06-15remarks 274-char remark
-
2026-06-15days on market $74,900 Active 4 DOM
-
2026-06-13days on market $74,900 Active 2 DOM
-
2026-06-13remarks 228-char remark
-
2026-06-13$74,900 Active 1 DOM
ⓘ Source: listings_history table (triggers on properties + properties_extension) + one-shot
backfill from property_details.listing_events for pre-trigger history.
Tax reassessment forecast MD · Partial reset (capped growth)
- Current annual tax
- $1,574 · $131/mo
- Projected year-2 tax
- $1,574 · $131/mo
- Expected delta
- $0/yr ($0/mo · 0.0%)
ⓘ Screening estimate from a state-policy table — verify with the county assessor before closing.
Nearby sold comps map
Loading sold comps map…
Walkable amenities ~0.75 mi
Loading nearby amenities…
Taxation est. · year 1
- Rental income
- $19,639
- − Mortgage interest
- −$4,196
- − Property taxes
- −$1,574
- − Insurance
- −$374
- − Repairs & maintenance
- −$1,571
- − Management
- −$1,571
- − Depreciation
- −$2,179
- Taxable income
- $8,174
- Est. tax owed @ 24.0%
- −$1,962
- After-tax cash flow
- $6,891/yr
For passive investors: Depreciation is non-cash, so a rental often shows a tax loss while cash-flowing — sheltering income. Rental losses are passive: they offset passive income freely, and up to $25,000/yr can offset ordinary (W-2) income if you actively participate and your MAGI is under $100k (phasing out to $0 by $150k); unused losses carry forward. On sale, claimed depreciation is recaptured at up to 25%, and gains may owe capital-gains tax (a 1031 exchange can defer both). Figures are a year-1 estimate at your 24.0% rate — not tax advice; consult a CPA.
Schools (NCES district)
- District
- Frederick County Public Schools
- NCES district ID
- 2400330
- Math proficiency
- 27% ▼ -23.00%
- Reading proficiency
- 43% ▼ -15.00%
- Median HH income
- $84,020
- Composite
- 33.54/100
- National rank
- #5429
- State rank
- #4 of 24 in MD
Livability — Emmitsburg
- Score
- 74/100
- State rank
- #114
- US rank
- #4757
Category grades
Schools grade is shown separately in the Schools card above.
Census & demographics
- Census place
- Emmitsburg, MD
- Population (ZIP)
- 6,079
Population outlook (Frederick County) Hauer SSP2
- Today (2025)
- 269,438 people
- By 2030
- 280,160 · +4.0%
- By 2040
- 298,408 · +10.8%
- By 2050
- 311,062 · +15.4%
- By 2075
- 342,819 · +27.2%
- By 2100
- 351,361 · +30.4%
Race, ethnicity, and origin ACS 2023
- Neighborhood character
- Predominantly White (77%)
- Race & ethnicity
- White 77% Hispanic / Latino 9% Two or more races 9% Black 9%
- Hispanic origin (detail)
- Mexican 3%
- Common ancestry
- Romanian 2% Lithuanian 2% Italian 1%
- Foreign-born
- 9% · Canada
- Languages at home
- 87% English-only · Spanish 8% Other Indo-European 1%
Political lean MEDSL · Frederick
- 2024 margin
- Lean D (+8.8) · D 53.2% · R 44.4% · Other 2.5%
- 2008→2024 swing
- +9.9pp toward D · 2008: -1.0pp · 2024: 8.8pp
- All cycles
- 2024: D+8.8 2020: D+9.6 2016: R+4.0 2012: R+3.9 2008: R+1.0
Not yet ingested
- Civics
- —
Market trends
- HPI YoY
- ▼ -15.22%
- Current HPI
- 251.1905
- Rent YoY
- —
- Metro
- —
- State GDP YoY
- ▲ 2.97%
- F500 in state
- 12
Industry mix (Fortune 500 HQ in MD)
| Industry | F500 HQs | Revenue |
|---|---|---|
| Aerospace / Defense | 1 | $71B |
|
||
| Utilities | 1 | $25B |
|
||
| Hotels | 1 | $24B |
|
||
| Consumer Goods | 1 | $7B |
|
||
| Real Estate | 1 | $6B |
|
||
| Chemicals | 1 | $2B |
|
||
Price history
+20.8% since first listed5 events — show timeline
- 2026-06-11 Listed $74,900 BRIGHT MLS
- 2014-11-25 Sold (Public Records) $75,000 Public Records
- 2001-03-27 Listed $62,000 MRIS
- 2001-03-27 Sold (MLS) $62,000 MRIS
- 2001-03-27 Delisted — MRIS
Property tax history
+1.6%/yrLatest (2025): $1,574 · +8.4% YoY. Source: county tax records.
Cash-flow waterfall
monthlySold comps — $/sqft
last 12 mo · ≤1 miLoading sold comps…