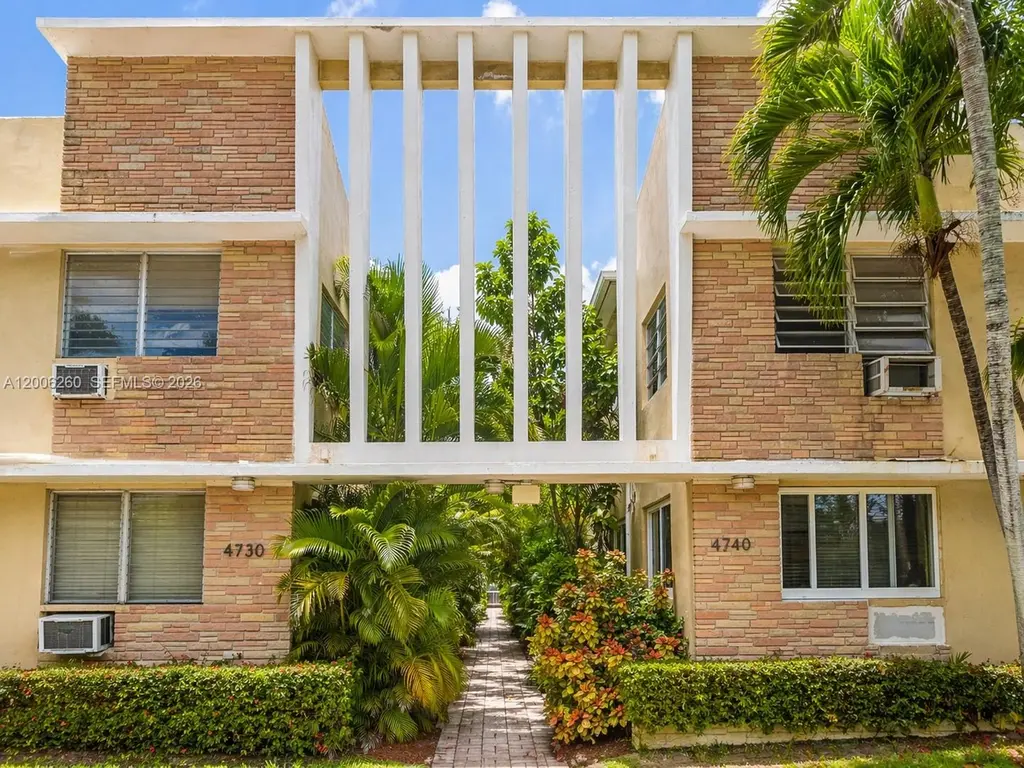
4740 Pine Tree Dr #20 · Miami Beach, FL
Flood risk 9/10 · Severe
- FEMA flood zone
- AE
- Chance of flooding over 30 yrs
- 0.99%
- Est. flood insurance / yr
- $1,737 – $8,500
Fire risk 1/10 · Minimal
- Est. fire insurance / yr
- $947 – $1,759
Heat risk 10/10 · Severe
- Hot days now (above 101°F)
- 7 days/yr
- Hot days in 30 yrs
- 28 days/yr
Wind risk 10/10 · Severe
- Chance of severe wind over 30 yrs
- 99.0%
Air-quality risk 2/10 · Minimal
- Unhealthy air days now
- 1 days/yr
- Unhealthy air days in 30 yrs
- 1 days/yr
Risk factors via First Street. Map © Google.
Why this score? — see what drove the B+ grade
The composite is a weighted blend of 9 inputs, each scored 0–100. Each bar is that input's sub-score; the figure is the points it added to the 100-point composite (weight × sub-score).
- Cash flow +30.0/30.0
- 1% rule +10.0/10.0
- DSCR +10.0/10.0
- ARV discount +7.5/15.0
- Appreciation +5.5/10.0
- Schools +4.2/10.0
- Livability +4.0/5.0
- Rent growth +3.4/5.0
- Condition / age +2.5/5.0
$179,900
🖨 Deal sheet 📄 Offer letter ✓ Due diligence
Listing remarks
Grand opportunity to own on quiet, private Pine Tree Drive in Miami Beach. This 1-bedroom, 1-bath co-op offers a peaceful setting with a bayfront feel in one of the area’s most desirable neighborhoods. Featuring hardwood floors throughout, the unit is full of potential and ready for your personal touch. Ideal for an end user looking to create a charming Miami Beach home or for an investor seeking an opportunity in a prime location. Just moments from shops, restaurants, and houses of worship, this home offers comfort, convenience, and the best of Miami Beach living. Cash only. Co-op. Schedule your tour today.
Key facts
- Miami beach living
- Prime location
- Hardwood floors
Tags
Property features AI
Finance
- Financial info: Pets allowed with restrictions
- HOA & community: Monthly association fee; Association amenities include boat dock, pier and pool; Association fee covers common areas, laundry, grounds maintenance and pool(s); Community of 32 units
Exterior
- Parking: On-street parking
- Security: Key card entry
- Home design: Attached property; 2 stories; Entry on first level
- Construction: Block construction; Effective year built
- Exterior features: Deck; Canal-front waterfront
Interior
- Kitchen: Electric range; Refrigerator
- Bedrooms: Bedroom located on the main level
- Flooring: Laminate flooring
- Bathrooms: 1 full bathroom
- Heating & cooling: Wall furnace heating; Wall/window air conditioning units
- Interior features: First floor entry; Bedroom on main level
Neighborhood map
What this means for you Summary
Snapshot
- This is a 1-bed/1.0-bath condo listed at $180k.
Deal economics
- At list price, monthly cash flow is $980 ($12k/yr) — positive.
- The deal already cash-flows at list — no discount required.
- Meets the 1% rule at list price ($4k rent vs $180k).
- Recommended offer: $175k (3.0% below list) — sets the bar for market timing.
- Cap rate 15.7% vs local median 1.5% in Miami Beach — top-decile yield for the area; either an underpriced asset or a hidden risk that comps aren't pricing in. Stress-test before assuming the spread holds.
Location & tenants
- Location reads 80/100 on livability (#108 in FL, #1,672 nationally) — a professional / high-income tenant draw. Strengths: crime A+, commute A+, health & safety A+; Watch: housing C-, amenities D-, cost of living F.
- Miami-Dade (suburban): math 45% / reading 54% proficiency, ranked #40 of 73 in FL (top 55%) — families likely to look elsewhere, expect single-tenant / working-renter base with shorter leases; 64% free/reduced lunch — lower-income household profile, screen leases tightly.
- Market conditions: Rents rising (+3.5%/yr); 670 active listings in the ZIP; solid renter incomes; 10,051 units permitted in Miami-Dade County in 2024 (7,758 in 5+ unit buildings).
- This rent runs 42% of the median local income ($107k/yr) — at the standard rent-burdened threshold; future hikes will face affordability resistance.
Forward outlook
- In year one you build about $3k of equity ($1k loan paydown + $2k appreciation (1.0% local appreciation)).
- Miami-Dade County population projected at +28% by 2050 — long-run rental-demand tailwind backs the buy-and-hold thesis.
- At projected returns (1.0% appreciation + 3.5% rent growth), your $50k cash investment doubles in ~4 years — after that, you're playing with house money.
- By year 10, paydown + projected appreciation supports a ~$31k cash-out refi (75% LTV) — recoverable capital for the next deal without selling this one.
Negotiation context
- It's been on market 57 days — a 3% lower offer ($175k) is reasonable based on typical stale-listing flexibility.
- 4 sale attempts since 2y ago with the ask held roughly flat each time — persistent listings suggest the price (not the market) is what's stuck; bring a comps-based counter.
Risks & watch-outs
- Watch-outs: flood insurance adds $427/mo; built in 1948 — expect roof / HVAC / electrical / plumbing capex.
- Climate carrying-cost: in FEMA flood zone AE (mandatory federal flood insurance); severe wind risk, 99% chance of damaging wind over 30y; extreme-heat days projected 7→28/yr by 2055 (HVAC capex compounding) — expect insurance premiums to compound above CPI over the hold.
Questions for the listing agent
- It's been on market 57 days. Have you received any prior offers? Is the seller open to a 3% concession, seller financing, or rate buy-down credit?
- Built in 1948 — when were the roof, HVAC, electrical panel, plumbing, and water heater last replaced?
- What's the actual annual flood-insurance premium (NFIP or private), and is the property in a SFHA with mandatory coverage?
- What does the HOA fee cover, when was the last increase, and are there any pending special assessments or reserve-fund shortfalls?
- Any open or pending special assessments — roof, HVAC, plumbing, elevator, façade? What's the per-unit balance and payoff schedule, and is the seller paying it off at close or rolling it to the buyer?
- Is there a deadline driving the sale (1031 exchange, divorce, estate, relocation)? That informs how much negotiation room exists.
- Schools are A-rated — typically a magnet for longer-tenancy family renters. What's the average tenant stay here, and is there a school-zone premium baked into asking?
- What's the average days-on-market for RENTAL listings here right now (not sales)? A rising rental-DOM trend means longer vacancies and softer asking-rent achievability than the comps imply.
- What's the recent tenant-quality profile in this submarket — average credit score on applications, eviction rate, late-payment / NSF rate, and stable-employment percentage? A property-management company in the area should have these aggregated.
- How much new apartment / multifamily construction is in the pipeline within 1–3 miles? Heavy new supply (>2% of stock underway) typically softens rents 12–24 months out; light construction supports rent growth.
Investment metrics
- 1% rule
- 2.08% ✓
- Cap rate
- 15.67%
- Cash-on-cash
- 33.50%
- DSCR
- 2.49
- GRM
- 4.0
CMA / ARV
No comps found within radius.
Projected returns pro-forma
0.96% appreciation · 3.52% rent growth · sell at horizon
- IRR
- 26.2%
- Equity multiple
- 2.35×
- Total profit
- $67,935
- Equity at exit
- $61,087
- IRR
- 29.4%
- Equity multiple
- 4.64×
- Total profit
- $183,161
- Equity at exit
- $80,926
Cash invested: $50,372 (down + closing). Projections, not guarantees.
Landlord ↔ Tenant lean methodology
- Overall (STATE)
- 87 Strongly Landlord-Friendly
- State Florida
- 87 Strongly Landlord-Friendly · R+3
- County
- — inherits STATE
- City
- — inherits STATE
ZIP-level market 33140
- Home prices YoY
- 0.3%
- Rents YoY
- 3.5%
- Active inventory
- 670
- Price-to-rent
- 4.0×
Monthly cashflow live
- Estimated rent
- $3,750 medium interval (Pro) →
- Mortgage (P&I)
- −$943
- Tax from tax record
- −$145 /mo · $1,741/yr
- Insurance
- −$75
- Flood insurance flood zone
- −$427 /mo · $5,118/yr
- HOA
- −$393
- Vacancy / Maint / Mgmt
- −$788
- Net cashflow
- $980
Break-even live
UW: 25.0% down · 7.5% · 30yr · 1.5% tax · 5.0% vac · 8.0% maint · 8.0% mgmt
Financing live
Cash to close
- Down payment
- $44,975
- Closing costs
- $5,397
- Reserves months
- —
- Total cash needed
- —
Loan-product check · same deal, 3 products live
Conventional
25% down · 7.5% · 30yr
- Down + closing
- —
- Monthly P&I
- —
- Monthly cashflow
- —
- DSCR
- —
- Eligible?
- —
Personal DTI + credit; lowest rate.
DSCR
20% down · 8.5% · 30yr
- Down + closing
- —
- Monthly P&I
- —
- Monthly cashflow
- —
- DSCR
- —
- Eligible?
- —
No personal income docs; deal must DSCR.
Hard money
10% down · 12.0% · 12mo
- Down + closing
- —
- Monthly P&I
- —
- Monthly cashflow
- —
- DSCR
- —
- Eligible?
- —
Short-term bridge; refi at stabilization.
HOA detail condo
- Monthly dues
- $393 · $4,716/yr
- Assessments
- None detected in remarks — confirm with the listing agent.
Listing history 24 events
-
2026-06-18days on market $179,900 Active 57 DOM
-
2026-06-17days on market $179,900 Active 56 DOM
-
2026-06-16days on market $179,900 Active 55 DOM
-
2026-06-15days on market $179,900 Active 54 DOM
-
2026-06-13days on market $179,900 Active 52 DOM
-
2026-06-09days on market $179,900 Active 48 DOM
-
2026-06-08days on market $179,900 Active 47 DOM
-
2026-06-07days on market $179,900 Active 46 DOM
-
2026-06-04days on market $179,900 Active 43 DOM
-
2026-06-03days on market $179,900 Active 42 DOM
-
2026-06-02days on market $179,900 Active 41 DOM
-
2026-06-01days on market $179,900 Active 40 DOM
-
2026-05-31days on market $179,900 Active 39 DOM
-
2026-04-22$179,900 Active
-
2026-02-14historical $1,850
-
2025-12-21historical
-
2025-12-08$159,000 Active
-
2025-10-31price $1,850
-
2025-09-11price $1,897
-
2025-08-29$1,995
-
2025-06-12historical
-
2025-03-27price $189,000
-
2025-03-21price $191,000
-
2024-12-03$199,000 Active
ⓘ Source: listings_history table (triggers on properties + properties_extension) + one-shot
backfill from property_details.listing_events for pre-trigger history.
Tax reassessment forecast FL · Resets to sale price
- Current annual tax
- $1,741 · $145/mo
- Projected year-2 tax
- $1,741 · $145/mo
- Expected delta
- $0/yr ($0/mo · 0.0%)
ⓘ Screening estimate from a state-policy table — verify with the county assessor before closing.
Climate risk First Street
- Flood 9/10 Extreme FEMA zone AE · 99% chance over 30 yrs
- Wildfire 1/10 Low
- Heat 10/10 Extreme 7 d/yr ≥101°F today · 28 d/yr by 30 yrs out
- Wind 10/10 Extreme 99% chance of damaging wind over 30 yrs
- Air quality 2/10 Low 1 unhealthy d/yr today · 1 by 30 yrs out
Nearby sold comps map
Loading sold comps map…
Walkable amenities ~0.75 mi
Loading nearby amenities…
Taxation est. · year 1
- Rental income
- $45,003
- − Mortgage interest
- −$10,077
- − Property taxes
- −$1,741
- − Insurance
- −$6,018
- − Repairs & maintenance
- −$3,600
- − Management
- −$3,600
- − HOA
- −$4,716
- − Depreciation
- −$5,233
- Taxable income
- $10,017
- Est. tax owed @ 24.0%
- −$2,404
- After-tax cash flow
- $9,352/yr
For passive investors: Depreciation is non-cash, so a rental often shows a tax loss while cash-flowing — sheltering income. Rental losses are passive: they offset passive income freely, and up to $25,000/yr can offset ordinary (W-2) income if you actively participate and your MAGI is under $100k (phasing out to $0 by $150k); unused losses carry forward. On sale, claimed depreciation is recaptured at up to 25%, and gains may owe capital-gains tax (a 1031 exchange can defer both). Figures are a year-1 estimate at your 24.0% rate — not tax advice; consult a CPA.
Schools (NCES district)
- District
- Miami-Dade
- NCES district ID
- 1200390
- Math proficiency
- 45% ▼ -16.00%
- Reading proficiency
- 54% ▼ -5.00%
- Median HH income
- $43,928
- Composite
- 41.76/100
- National rank
- #3397
- State rank
- #40 of 73 in FL
Livability — Miami Beach
- Score
- 80/100
- State rank
- #108
- US rank
- #1672
Category grades
Schools grade is shown separately in the Schools card above.
Census & demographics
- Census place
- Miami Beach, FL
- County
- Miami-Dade County · 2,697,751 people
- City population
- 90,533
- Metro
- Miami-Fort Lauderdale-Pompano Beach, FL
- Population (ZIP)
- 20,342
- Household income
- $107,063
- Rent vs Own
- Severe rent burden
- 870.0
Population outlook (Miami-Dade County) Hauer SSP2
- Today (2025)
- 3,126,439 people
- By 2030
- 3,325,765 · +6.4%
- By 2040
- 3,697,561 · +18.3%
- By 2050
- 4,012,134 · +28.3%
- By 2075
- 4,605,612 · +47.3%
- By 2100
- 4,866,598 · +55.7%
Race, ethnicity, and origin ACS 2023
- Neighborhood character
- Diverse neighborhood (Simpson 0.59)
- Race & ethnicity
- White 46% Hispanic / Latino 44% Two or more races 23% Black 3% Asian 2%
- Hispanic origin (detail)
- Mexican 2% Puerto Rican 2% Cuban 19% Salvadoran 6%
- Common ancestry
- Scotch-Irish 5% Romanian 3% Italian 3%
- Foreign-born
- 44% · Canada, Dominican Republic, Jamaica
- Languages at home
- 43% English-only · Spanish 45% Other Indo-European 6% French/Haitian/Cajun 2%
Political lean MEDSL · Miami-Dade
- 2024 margin
- R (+11.4) · D 43.9% · R 55.4%
- 2008→2024 swing
- -27.6pp toward R · 2008: 16.1pp · 2024: -11.4pp
- All cycles
- 2024: R+11.4 2020: D+7.3 2016: D+29.6 2012: D+23.7 2008: D+16.1
Not yet ingested
- Civics
- —
Market trends
- HPI YoY
- ▲ 0.96%
- Current HPI
- 302.8514
- Rent YoY
- ▲ 3.52%
- Metro
- Miami-Fort Lauderdale-Pompano Beach, FL
- State GDP YoY
- ▲ 3.28%
- F500 in state
- 36
Industry mix (Fortune 500 HQ in FL)
| Industry | F500 HQs | Revenue |
|---|---|---|
| Industrial Technology | 2 | $29B |
|
||
| Insurance | 2 | $17B |
|
||
| Retail | 1 | $60B |
|
||
| Technology Distribution | 1 | $58B |
|
||
| Homebuilding | 1 | $35B |
|
||
| Technology Manufacturing | 1 | $35B |
|
||
Price history
-9.6% since first listed11 events — show timeline
- 2026-04-22 Listed $179,900 MARMLS
- 2026-02-14 Rental Removed $1,850 MARMLS
- 2025-12-21 Listing Removed — MARMLS
- 2025-12-08 Listed $159,000 MARMLS
- 2025-10-31 Price Changed $1,850 MARMLS
- 2025-09-11 Price Changed $1,897 MARMLS
- 2025-08-29 Listed for Rent $1,995 MARMLS
- 2025-06-12 Listing Removed — MARMLS
- 2025-03-27 Price Changed $189,000 MARMLS
- 2025-03-21 Price Changed $191,000 MARMLS
- 2024-12-03 Listed $199,000 MARMLS
Property tax history
+1.7%/yrLatest (2025): $1,741 · -24.5% YoY. Source: county tax records.
Cash-flow waterfall
monthlySold comps — $/sqft
last 12 mo · ≤1 miLoading sold comps…