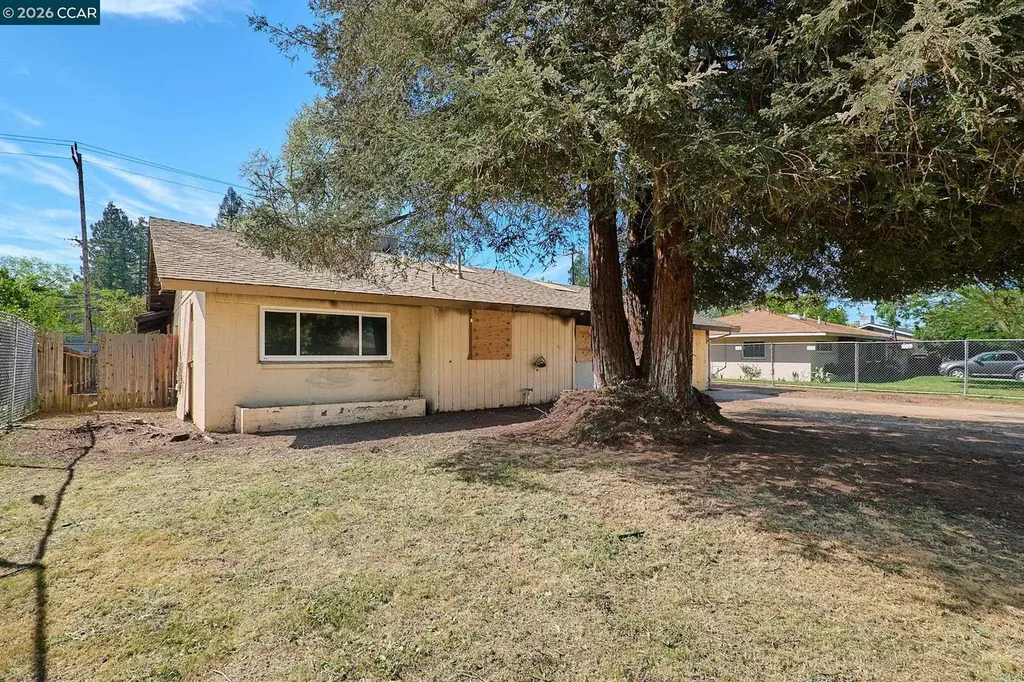
3530 William Way · Arden-Arcade, CA
Flood risk 1/10 · Minimal
- FEMA flood zone
- X (unshaded)
- Chance of flooding over 30 yrs
- 0.0%
- Est. flood insurance / yr
- $507 – $1,088
Fire risk 1/10 · Minimal
- Est. fire insurance / yr
- $659 – $1,223
Heat risk 7/10 · Major
- Hot days now (above 102°F)
- 7 days/yr
- Hot days in 30 yrs
- 15 days/yr
Wind risk 1/10 · Minimal
- Chance of severe wind over 30 yrs
- —
Air-quality risk 10/10 · Severe
- Unhealthy air days now
- 33 days/yr
- Unhealthy air days in 30 yrs
- 38 days/yr
Risk factors via First Street. Map © Google.
Why this score? — see what drove the C- grade
The composite is a weighted blend of 9 inputs, each scored 0–100. Each bar is that input's sub-score; the figure is the points it added to the 100-point composite (weight × sub-score).
- Cash flow +21.7/30.0
- ARV discount +7.5/15.0
- DSCR +6.9/10.0
- 1% rule +6.2/10.0
- Schools +4.4/10.0
- Livability +2.5/5.0
- Condition / age +2.5/5.0
- Rent growth +2.4/5.0
- Appreciation +0.0/10.0
$224,950
🖨 Deal sheet (PDF) 📄 Offer letter ✓ Due diligence
Listing remarks
PLEASE READ ENTIRE LISTING AND DISCLOSURES PRIOR TO TEXTING LISTING AGENT! Opportunities Abound !!! Check out this 4 Bed 2 Bath Home on a HUGE 11,323 FT LOT. THIS HOME NEEDS MAJOR REPAIRS DUE TO SEVERE FIRE DAMAGE! NO ESTIMATES HAVE BEEN DONE - DO YOUR OWN DUE DILIGENCE! Home WILL NOT qualify for financing (Other than Hard Money) due to fire damage. Please see seller disclosure link IN MLS DOCS LINK to include fire report (Cause unknown but appears to have centered in garage) SEND YOUR HIGHEST AND BEST OFFER RIGHT AWAY!!! LISTING AGENT CANNOT REPRESENT BUYERS - SORRY Hurry, this home is priced to move quickly
Key facts
- 0.26 acre lot
- Garage
- Built 1953
Neighborhood map
What this means for you Summary
Snapshot
- This is a 4-bed/2.0-bath single-family listed at $225k.
Deal economics
- At list price, monthly cash flow is $348 ($4k/yr) — positive.
- The deal already cash-flows at list — no discount required.
- Meets the 1% rule at list price ($3k rent vs $225k).
- Cap rate 8.1% vs local median 2.3% in Arden-Arcade — top-decile yield for the area; either an underpriced asset or a hidden risk that comps aren't pricing in. Stress-test before assuming the spread holds.
Location & tenants
- Location reads: area grade C — affects rentability + tenant quality, not the cash-flow math above.
- San Juan Unified (suburban): math 40% / reading 62% proficiency, ranked #138 of 517 in CA (top 27%) — acceptable for families but not a draw, mixed tenant base, ~2y average lease.
- Market conditions: Rents soft (-0.5%/yr); 95 active listings in the ZIP; 11 comparable units currently listed for rent nearby; rentals at typical pace (median 17d on market — plan ~3-4 weeks tenant-placement turnaround); 6,825 units permitted in Sacramento County in 2024 (1,752 in 5+ unit buildings).
- At $2,517/mo this rent would consume 46% of the median local household income ($65k/yr) (locally 2609% of renters already pay >50% of income on rent) — very limited rent-growth headroom before tenants either downsize or default.
Forward outlook
- Local home prices are declining (-3.0%/yr); year-one equity from $2k of loan paydown is wiped out by about $7k of value loss. Plan a longer hold.
- Sacramento County population projected at +17% by 2050 — long-run rental-demand tailwind backs the buy-and-hold thesis.
Negotiation context
- Only 6 days on market — expect competitive offers; lowballing is unlikely to land.
- 2 sale attempts with the ask held roughly flat each time — persistent listings suggest the price (not the market) is what's stuck; bring a comps-based counter.
Risks & watch-outs
- Watch-outs: built in 1953 — expect roof / HVAC / electrical / plumbing capex.
- Climate carrying-cost: extreme-heat days projected 7→15/yr by 2055 (HVAC capex compounding) — expect insurance premiums to compound above CPI over the hold.
Questions for the listing agent
- Built in 1953 — when were the roof, HVAC, electrical panel, plumbing, and water heater last replaced?
- Is there a deadline driving the sale (1031 exchange, divorce, estate, relocation)? That informs how much negotiation room exists.
- What's the average days-on-market for RENTAL listings here right now (not sales)? A rising rental-DOM trend means longer vacancies and softer asking-rent achievability than the comps imply.
- What's the recent tenant-quality profile in this submarket — average credit score on applications, eviction rate, late-payment / NSF rate, and stable-employment percentage? A property-management company in the area should have these aggregated.
- How much new for-sale + rental construction is in the pipeline within 1–3 miles? Heavy new supply typically softens prices + rents 12–24 months out; constrained supply supports both.
Investment metrics
- 1% rule
- 1.12% ✓
- Cap rate
- 8.15%
- Cash-on-cash
- 6.62%
- DSCR
- 1.29
- GRM
- 7.4
CMA / ARV
- ARV (on-the-fly)
- $547,104
- Comps found
- 12
Show comp detail 12 sales within ~0.75 mi
| Address | Dist | Beds/Ba | Sqft | Sold | Price | $/sf | Match |
|---|---|---|---|---|---|---|---|
| 3530 William Way | 0.00mi | 4/2.0 | 1,668 (0%) | 1mo | $280,000 | $168 | 99 |
| 3620 West Way | 0.12mi | 3/2.0 (-1) | 1,605 (-4%) | 1mo | $600,000 | $374 | 82 |
| 3825 Sunnyvale Ave | 0.37mi | 3/1.0 (-1) | 1,700 (+2%) | 3mo | $578,200 | $340 | 68 |
| 3524 Pope Ave | 0.45mi | 3/2.0 (-1) | 1,629 (-2%) | 4mo | $475,000 | $292 | 67 |
| 3414 Club Ln | 0.35mi | 3/2.0 (-1) | 1,786 (+7%) | 0mo | $615,000 | $344 | 67 |
| 3310 Potter Ln | 0.30mi | 3/2.0 (-1) | 1,818 (+9%) | 1mo | $650,000 | $358 | 65 |
| 3624 Woodcrest Rd | 0.49mi | 4/2.0 | 1,788 (+7%) | 3mo | $550,000 | $308 | 63 |
| 3233 Northwood Rd | 0.47mi | 3/2.0 (-1) | 1,584 (-5%) | 4mo | $485,000 | $306 | 62 |
| 3309 Brookwood Rd | 0.45mi | 4/2.0 | 1,861 (+12%) | 2mo | $610,000 | $328 | 58 |
| 3704 Gratia Ave | 0.24mi | 3/1.0 (-1) | 1,428 (-14%) | 0mo | $420,000 | $294 | 56 |
| 3801 Woodcrest Rd | 0.51mi | 4/2.0 | 1,874 (+12%) | 4mo | $505,000 | $269 | 52 |
| 3245 Becerra Way | 0.56mi | 4/1.5 | 1,447 (-13%) | 1mo | $590,000 | $408 | 49 |
Match score weights: distance 35% · size 25% · config 20% · recency 20%. Top-matched comps best support the ARV.
Projected returns pro-forma
-3.0% appreciation · 0.0% rent growth · sell at horizon
- IRR
- -9.7%
- Equity multiple
- 0.66×
- Total profit
- $-21,597
- Equity at exit
- $33,541
- IRR
- -5.2%
- Equity multiple
- 0.71×
- Total profit
- $-18,435
- Equity at exit
- $19,450
Cash invested: $62,986 (down + closing). Projections, not guarantees.
Landlord ↔ Tenant lean methodology
- Overall (STATE)
- 18 Strongly Tenant-Friendly
- State California
- 18 Strongly Tenant-Friendly · D+13
- County
- — inherits STATE
- City
- — inherits STATE
ZIP-level market 95821
- Rents YoY
- -0.5%
- Active inventory
- 95
- Price-to-rent
- 7.4×
Monthly cashflow live
- Estimated rent
- $2,517 high interval (Pro) →
- Mortgage (P&I)
- −$1,180
- Tax from tax record
- −$367 /mo · $4,409/yr
- Insurance
- −$94
- HOA
- −$0
- Vacancy / Maint / Mgmt
- −$529
- Net cashflow
- $348
Break-even live
Sensitivity live
| Price | -10% $475 | -5% $411 | +0% $348 | +5% $284 | +10% $220 |
|---|---|---|---|---|---|
| Rent | -10% $149 | -5% $248 | +0% $348 | +5% $447 | +10% $546 |
| Rate | -1.0pp $461 | -0.5pp $405 | base $348 | +0.5pp $289 | +1.0pp $230 |
UW: 25.0% down · 7.5% · 30yr · 1.5% tax · 5.0% vac · 8.0% maint · 8.0% mgmt
Financing live
Cash to close
- Down payment
- $56,238
- Closing costs
- $6,748
- Reserves months
- —
- Total cash needed
- —
Loan-product check · same deal, 3 products live
Conventional
25% down · 7.5% · 30yr
- Down + closing
- —
- Monthly P&I
- —
- Monthly cashflow
- —
- DSCR
- —
- Eligible?
- —
Personal DTI + credit; lowest rate.
DSCR
20% down · 8.5% · 30yr
- Down + closing
- —
- Monthly P&I
- —
- Monthly cashflow
- —
- DSCR
- —
- Eligible?
- —
No personal income docs; deal must DSCR.
Hard money
10% down · 12.0% · 12mo
- Down + closing
- —
- Monthly P&I
- —
- Monthly cashflow
- —
- DSCR
- —
- Eligible?
- —
Short-term bridge; refi at stabilization.
Rent comps 11 comps
| Address | Beds | Baths | Sqft | Rent | $/sqft | DOM | Units | Dist |
|---|---|---|---|---|---|---|---|---|
| 3142 Edison Ave Unit 1 Sacramento, CA | 3.0 | 1.0 | 1200 | $1,605 | $1.34 | 44d | 1 | 0.44mi |
| 3610 Auburn Blvd Sacramento, CA | 3.0 | 2.0 | 1140 | $2,395 | $2.10 | 8d | 1 | 0.47mi |
| 2929 Burnece St Sacramento, CA | 3.0 | 1.0 | 1240 | $2,495 | $2.01 | 13d | 1 | 0.82mi |
| 3107 Clairidge Way Sacramento, CA | 3.0 | 2.0 | 1761 | $2,795 | $1.59 | 44d | 1 | 0.83mi |
| 4249 Oterol Ct Sacramento, CA | 3.0 | 2.0 | 1339 | $3,000 | $2.24 | 17d | 1 | 0.96mi |
| 4209 Horgan Way Sacramento, CA | 4.0 | 2.0 | 1450 | $2,750 | $1.90 | 24d | 1 | 1.00mi |
| 2840 Becerra Way Sacramento, CA | 3.0 | 2.0 | 1400 | $3,150 | $2.25 | 8d | 1 | 1.07mi |
| 3644 Kings Way Sacramento, CA | 3.0 | 1.0–2.0 | 830 | $2,453 | $2.96 | 2d | 23 | 1.26mi |
| 4205 Lyle St Sacramento, CA | 3.0 | 1.0 | 1200 | $2,700 | $2.25 | 44d | 1 | 1.32mi |
| 4437 Rutgers Way Sacramento, CA | 3.0 | 2.5 | 2113 | $2,995 | $1.42 | 44d | 1 | 1.36mi |
| 2391 Carlsbad Ave Sacramento, CA | 3.0 | 1.0 | 1372 | $2,575 | $1.88 | 8d | 1 | 1.50mi |
Listing history 5 events
-
2026-04-02status Pending
-
2026-04-02status Active
-
2026-03-30status Pending
-
2026-03-25$224,950 Active
-
2015-08-26soldstatus $230,000
ⓘ Source: listings_history table (triggers on properties + properties_extension) + one-shot
backfill from property_details.listing_events for pre-trigger history.
Tax reassessment forecast CA · Resets to sale price
- Current annual tax
- $4,409 · $367/mo
- Projected year-2 tax
- $4,409 · $367/mo
- Expected delta
- $0/yr ($0/mo · 0.0%)
ⓘ Screening estimate from a state-policy table — verify with the county assessor before closing.
Climate risk First Street
- Flood 1/10 Low FEMA zone X (unshaded) · 0% chance over 30 yrs
- Wildfire 1/10 Low
- Heat 7/10 Severe 7 d/yr ≥102°F today · 15 d/yr by 30 yrs out
- Wind 1/10 Low
- Air quality 10/10 Extreme 33 unhealthy d/yr today · 38 by 30 yrs out
Nearby sold comps map
Loading sold comps map…
Walkable amenities ~0.75 mi
Loading nearby amenities…
Taxation est. · year 1
- Rental income
- $30,204
- − Mortgage interest
- −$12,601
- − Property taxes
- −$4,409
- − Insurance
- −$1,125
- − Repairs & maintenance
- −$2,416
- − Management
- −$2,416
- − Depreciation
- −$6,544
- Taxable income
- $693
- Est. tax owed @ 24.0%
- −$166
- After-tax cash flow
- $4,005/yr
For passive investors: Depreciation is non-cash, so a rental often shows a tax loss while cash-flowing — sheltering income. Rental losses are passive: they offset passive income freely, and up to $25,000/yr can offset ordinary (W-2) income if you actively participate and your MAGI is under $100k (phasing out to $0 by $150k); unused losses carry forward. On sale, claimed depreciation is recaptured at up to 25%, and gains may owe capital-gains tax (a 1031 exchange can defer both). Figures are a year-1 estimate at your 24.0% rate — not tax advice; consult a CPA.
Schools (NCES district)
- District
- San Juan Unified
- NCES district ID
- 0634620
- Math proficiency
- 40% ▲ 3.00%
- Reading proficiency
- 62% ▲ 16.00%
- Median HH income
- $55,655
- Composite
- 44.07/100
- National rank
- #2878
- State rank
- #138 of 517 in CA
Livability — Arden-Arcade
No livability data for this city. (Only ~50 U.S. cities are tracked.)
Census & demographics
- Census place
- Arden-Arcade, CA
- County
- Sacramento County · 1,539,646 people
- City population
- 100,586
- Metro
- Sacramento-Roseville-Folsom, CA
- Population (ZIP)
- 38,064
- Household income
- $64,963
- Rent vs Own
- Severe rent burden
- 2609.0
Population outlook (Sacramento County) Hauer SSP2
- Today (2025)
- 1,660,763 people
- By 2030
- 1,732,990 · +4.3%
- By 2040
- 1,855,755 · +11.7%
- By 2050
- 1,941,335 · +16.9%
- By 2075
- 2,046,162 · +23.2%
- By 2100
- 1,961,444 · +18.1%
Race, ethnicity, and origin ACS 2023
- Neighborhood character
- Diverse neighborhood (Simpson 0.68)
- Race & ethnicity
- White 50% Hispanic / Latino 20% Asian 13% Two or more races 12% Black 8%
- Hispanic origin (detail)
- Mexican 14%
- Common ancestry
- Lithuanian 3% Slovak 3% Scotch-Irish 2%
- Foreign-born
- 23% · Canada, China
- Languages at home
- 70% English-only · Spanish 10% Other Indo-European 9% Russian/Polish/Slavic 5%
Political lean MEDSL · Sacramento
- 2024 margin
- D (+19.7) · D 58.1% · R 38.4% · Other 3.5%
- 2008→2024 swing
- +0.7pp no change · 2008: 19.0pp · 2024: 19.7pp
- All cycles
- 2024: D+19.7 2020: D+25.3 2016: D+23.7 2012: D+16.3 2008: D+19.0
Not yet ingested
- Civics
- —
Market trends
- HPI YoY
- ▼ -485.09%
- Current HPI
- 306.3799
- Rent YoY
- ▼ -0.49%
- Metro
- Sacramento-Roseville-Folsom, CA
- State GDP YoY
- ▲ 3.21%
- F500 in state
- 116
Industry mix (Fortune 500 HQ in CA)
| Industry | F500 HQs | Revenue |
|---|---|---|
| Technology | 27 | $1,492B |
|
||
| Financial Services | 3 | $174B |
|
||
| Retail | 3 | $44B |
|
||
| Insurance | 3 | $26B |
|
||
| Media / Entertainment | 2 | $115B |
|
||
| Pharmaceuticals / Biotech | 2 | $62B |
|
||
Price history
-2.2% since first listed5 events — show timeline
- 2026-04-02 Pending — bridgeMLS, Bay East AOR, or Contra Costa AOR
- 2026-04-02 Relisted — bridgeMLS, Bay East AOR, or Contra Costa AOR
- 2026-03-30 Pending — bridgeMLS, Bay East AOR, or Contra Costa AOR
- 2026-03-25 Listed $224,950 bridgeMLS, Bay East AOR, or Contra Costa AOR
- 2015-08-26 Sold (Public Records) $230,000 Public Records
Property tax history
+12.6%/yrLatest (2025): $4,409 · +1.0% YoY. Source: county tax records.
Cash-flow waterfall
monthlySold comps — $/sqft
last 12 mo · ≤1 miLoading sold comps…