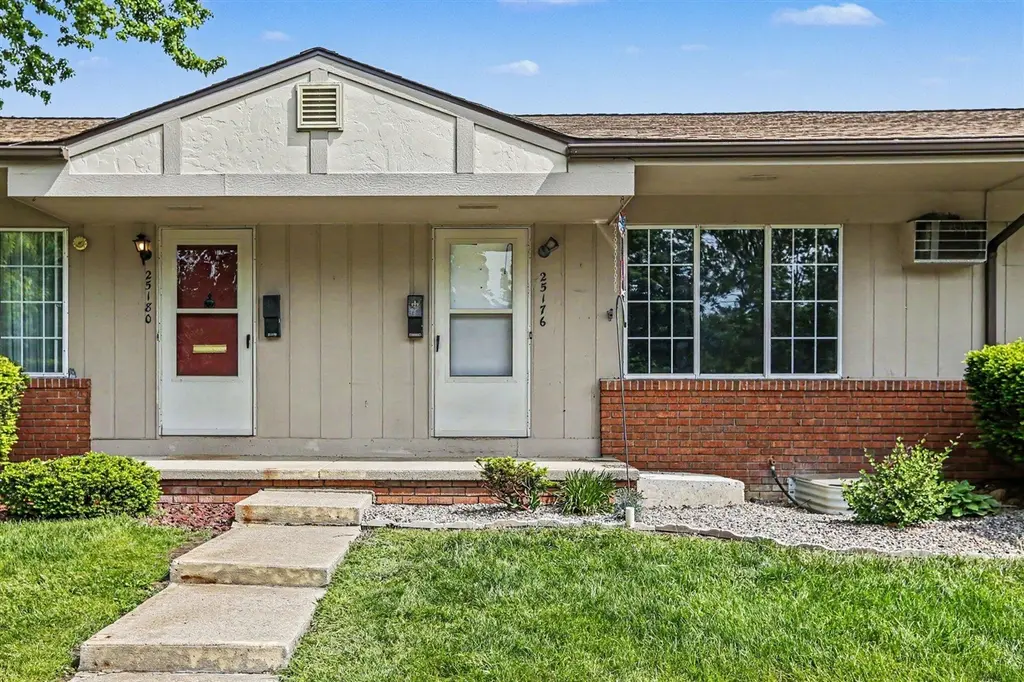
25176 Potomac Dr #2 · South Lyon, MI
Flood risk 1/10 · Minimal
- FEMA flood zone
- X (unshaded)
- Chance of flooding over 30 yrs
- 0.0%
- Est. flood insurance / yr
- $473 – $860
Fire risk 3/10 · Minor
- Est. fire insurance / yr
- $784 – $1,456
Heat risk 3/10 · Minor
- Hot days now (above 96°F)
- 7 days/yr
- Hot days in 30 yrs
- 16 days/yr
Wind risk 2/10 · Minimal
- Chance of severe wind over 30 yrs
- —
Air-quality risk 2/10 · Minimal
- Unhealthy air days now
- 1 days/yr
- Unhealthy air days in 30 yrs
- 2 days/yr
Risk factors via First Street. Map © Google.
Why this score? — see what drove the C+ grade
The composite is a weighted blend of 9 inputs, each scored 0–100. Each bar is that input's sub-score; the figure is the points it added to the 100-point composite (weight × sub-score).
- Cash flow +23.5/30.0
- 1% rule +10.0/10.0
- DSCR +7.6/10.0
- ARV discount +7.5/15.0
- Schools +4.7/10.0
- Livability +4.2/5.0
- Rent growth +2.5/5.0
- Condition / age +2.5/5.0
- Appreciation +0.0/10.0
$109,900
🖨 Deal sheet 📄 Offer letter ✓ Due diligence
Listing remarks MLS
Welcome home to this charming condo in the desirable 55+ Colonial Acres community! Offering a flexible main level layout designed for comfortable everyday living, this home also features a finished basement complete with an egress window--perfect for a 3rd bedroom, home office, or hobby space. Relax and unwind on the covered back porch while enjoying the peaceful surroundings. The HOA takes care of all exterior maintenance and provides access to fantastic amenities including a community pool and clubhouse, making for truly low-maintenance living. Conveniently located just a short drive from Kensington Metropark, shopping, dining, and several golf course options, this home combines comfort, convenience, and community all in one!
Key facts
- Clubhouse
- Community pool
- Finished basement
Tags
Property features AI
Finance
- HOA & community: Monthly association fee (includes water, trash, sewer, heat, snow removal, and lawn/yard care); Pets allowed
Exterior
- Utilities: Public water
- Home design: Ranch-style residence; Condominium; Built in 1977
- Construction: Brick and wood siding exterior; Asphalt roof
- Exterior features: Paved road access; Clubhouse, meeting room, and community pool (association amenities)
Interior
- Kitchen: Kitchen (12 x 8); Oven; Refrigerator
- Bedrooms: Primary bedroom (11 x 9); Second bedroom (13 x 8)
- Bathrooms: One full bathroom (5 x 8)
- Heating & cooling: Baseboard heating; Wall unit air conditioning
- Interior features: Six total rooms; Full basement
- Laundry & utility: Laundry room (16 x 20)
Neighborhood map
What this means for you Summary
Snapshot
- This is a 3-bed/1.0-bath condo listed at $110k.
Deal economics
- At list price, monthly cash flow is $206 ($2k/yr) — positive.
- The deal already cash-flows at list — no discount required.
- Meets the 1% rule at list price ($2k rent vs $110k).
- Recommended offer: $108k (1.5% below list) — sets the bar for market timing.
- Cap rate 8.5% vs local median 2.8% in South Lyon — top-decile yield for the area; either an underpriced asset or a hidden risk that comps aren't pricing in. Stress-test before assuming the spread holds.
Location & tenants
- Location reads 83/100 on livability (#46 in MI, #953 nationally) — a professional / high-income tenant draw. Strengths: crime A+, cost of living A+, housing A+; Watch: amenities C-, commute F.
- South Lyon Community Schools (suburban): math 46% / reading 59% proficiency, ranked #74 of 540 in MI (top 14%) — acceptable for families but not a draw, mixed tenant base, ~2y average lease; only 16% free/reduced lunch — higher-income household profile.
- Market conditions: 345 active listings in the ZIP; 8 comparable units currently listed for rent nearby; rentals leasing fast (median 3d on market — plan ~1-2 weeks tenant-placement turnaround); high-income renter base; 2,614 units permitted in Oakland County in 2024 (721 in 5+ unit buildings).
- This rent is only 17% of the median local income ($132k/yr) — well below the 30% rent-burden line; pricing power to push rent on renewal without tenant pushback.
Forward outlook
- Local home prices are declining (-3.0%/yr); year-one equity from $760 of loan paydown is wiped out by about $3k of value loss. Plan a longer hold.
- Oakland County population projected at +10% by 2050 — modest demand growth; plan on rents tracking national, not racing it.
Negotiation context
- It's been on market 20 days — a 2% lower offer ($108k) is reasonable based on typical stale-listing flexibility.
- 7 sale attempts since 6y ago with the ask held roughly flat each time — persistent listings suggest the price (not the market) is what's stuck; bring a comps-based counter.
- Current owner paid $80k; 37% above their basis — modest negotiation headroom, anchor on the comps not their cost.
Risks & watch-outs
- Watch-outs: HOA is 28% of rent.
Questions for the listing agent
- Built in 1977 — when were the roof, HVAC, electrical panel, plumbing, and water heater last replaced?
- What does the HOA fee cover, when was the last increase, and are there any pending special assessments or reserve-fund shortfalls?
- Any open or pending special assessments — roof, HVAC, plumbing, elevator, façade? What's the per-unit balance and payoff schedule, and is the seller paying it off at close or rolling it to the buyer?
- Is there a deadline driving the sale (1031 exchange, divorce, estate, relocation)? That informs how much negotiation room exists.
- Schools are B-rated — typically a magnet for longer-tenancy family renters. What's the average tenant stay here, and is there a school-zone premium baked into asking?
- What's the average days-on-market for RENTAL listings here right now (not sales)? A rising rental-DOM trend means longer vacancies and softer asking-rent achievability than the comps imply.
- What's the recent tenant-quality profile in this submarket — average credit score on applications, eviction rate, late-payment / NSF rate, and stable-employment percentage? A property-management company in the area should have these aggregated.
- How much new apartment / multifamily construction is in the pipeline within 1–3 miles? Heavy new supply (>2% of stock underway) typically softens rents 12–24 months out; light construction supports rent growth.
Investment metrics
- 1% rule
- 1.73% ✓
- Cap rate
- 8.54%
- Cash-on-cash
- 8.04%
- DSCR
- 1.36
- GRM
- 4.8
CMA / ARV
No comps found within radius.
Projected returns pro-forma
-3.0% appreciation · 3.0% rent growth · sell at horizon
- IRR
- -3.7%
- Equity multiple
- 0.86×
- Total profit
- $-4,321
- Equity at exit
- $16,386
- IRR
- 6.3%
- Equity multiple
- 1.47×
- Total profit
- $14,605
- Equity at exit
- $9,502
Cash invested: $30,772 (down + closing). Projections, not guarantees.
Landlord ↔ Tenant lean methodology
- Overall (STATE)
- 62 Landlord-Friendly
- State Michigan
- 62 Landlord-Friendly · EVEN
- County
- — inherits STATE
- City
- — inherits STATE
ZIP-level market 48178
- Active inventory
- 345
- Price-to-rent
- 4.8×
Monthly cashflow live
- Estimated rent
- $1,906 high interval (Pro) →
- Mortgage (P&I)
- −$576
- Tax est. 1.5%
- −$137 /mo · $1,648/yr
- Insurance
- −$46
- HOA
- −$540
- Vacancy / Maint / Mgmt
- −$400
- Net cashflow
- $206
Break-even live
UW: 25.0% down · 7.5% · 30yr · 1.5% tax · 5.0% vac · 8.0% maint · 8.0% mgmt
Financing live
Cash to close
- Down payment
- $27,475
- Closing costs
- $3,297
- Reserves months
- —
- Total cash needed
- —
Loan-product check · same deal, 3 products live
Conventional
25% down · 7.5% · 30yr
- Down + closing
- —
- Monthly P&I
- —
- Monthly cashflow
- —
- DSCR
- —
- Eligible?
- —
Personal DTI + credit; lowest rate.
DSCR
20% down · 8.5% · 30yr
- Down + closing
- —
- Monthly P&I
- —
- Monthly cashflow
- —
- DSCR
- —
- Eligible?
- —
No personal income docs; deal must DSCR.
Hard money
10% down · 12.0% · 12mo
- Down + closing
- —
- Monthly P&I
- —
- Monthly cashflow
- —
- DSCR
- —
- Eligible?
- —
Short-term bridge; refi at stabilization.
Rent comps 8 comps
| Address | Beds | Baths | Sqft | Rent | $/sqft | DOM | Units | Dist |
|---|---|---|---|---|---|---|---|---|
| 549 Lakewood Dr South Lyon, MI | 1.0–2.0 | 1.0 | 850 | $1,379 | $1.62 | 1d | 1 | 0.28mi |
| 663 Jamie Vis South Lyon, MI | 3.0 | 2.5 | 1560 | $2,749 | $1.76 | 1d | 1 | 0.31mi |
| 671 E Crest Ln South Lyon, MI | 3.0 | 1.5 | 1589 | $2,250 | $1.42 | 16d | 1 | 0.40mi |
| 425 Donovan St South Lyon, MI | 2.0–3.0 | 1.0 | 1027 | $1,700 | $1.66 | 1d | 1 | 0.58mi |
| 113 W Liberty St Unit 1 South Lyon, MI | 3.0 | 1.0 | 1050 | $1,700 | $1.62 | 17d | 1 | 0.81mi |
| 825 W Lake St South Lyon, MI | 1.0–2.0 | 1.0 | 738 | $1,746 | $2.36 | 1d | 7 | 0.94mi |
| 200 Brookwood Dr South Lyon, MI | 2.0 | 2.0 | 1193 | $1,672 | $1.40 | 3d | 3 | 1.03mi |
| 249 Brookwood Dr #2 South Lyon, MI | 2.0 | 1.0 | 1079 | $1,475 | $1.37 | 43d | 1 | 1.15mi |
HOA detail condo
- Monthly dues
- $540 · $6,480/yr
- Likely covers
- exterior maint.pool
- Assessments
- None detected in remarks — confirm with the listing agent.
Listing history 14 events
-
2026-06-18days on market $109,900 Active 20 DOM
-
2026-06-17days on market $109,900 Active 19 DOM
-
2026-06-16days on market $109,900 Active 18 DOM
-
2026-06-15days on market $109,900 Active 17 DOM
-
2026-06-13days on market $109,900 Active 15 DOM
-
2026-06-13days on market $109,900 Active 14 DOM
-
2026-06-09days on market $109,900 Active 11 DOM
-
2026-06-08days on market $109,900 Active 10 DOM
-
2026-06-07days on market $109,900 Active 9 DOM
-
2026-06-04days on market $109,900 Active 6 DOM
-
2026-06-03days on market $109,900 Active 5 DOM
-
2026-06-02days on market $109,900 Active 4 DOM
-
2026-06-01days on market $109,900 Active 3 DOM
-
2026-05-31days on market $109,900 Active 2 DOM
ⓘ Source: listings_history table (triggers on properties + properties_extension) + one-shot
backfill from property_details.listing_events for pre-trigger history.
Climate risk First Street
- Flood 1/10 Low FEMA zone X (unshaded) · 0% chance over 30 yrs
- Wildfire 3/10 Moderate
- Heat 3/10 Moderate 7 d/yr ≥96°F today · 16 d/yr by 30 yrs out
- Wind 2/10 Low
- Air quality 2/10 Low 1 unhealthy d/yr today · 2 by 30 yrs out
Nearby sold comps map
Loading sold comps map…
Walkable amenities ~0.75 mi
Loading nearby amenities…
Taxation est. · year 1
- Rental income
- $22,870
- − Mortgage interest
- −$6,156
- − Property taxes
- −$1,648
- − Insurance
- −$550
- − Repairs & maintenance
- −$1,830
- − Management
- −$1,830
- − HOA
- −$6,480
- − Depreciation
- −$3,197
- Taxable income
- $1,179
- Est. tax owed @ 24.0%
- −$283
- After-tax cash flow
- $2,190/yr
For passive investors: Depreciation is non-cash, so a rental often shows a tax loss while cash-flowing — sheltering income. Rental losses are passive: they offset passive income freely, and up to $25,000/yr can offset ordinary (W-2) income if you actively participate and your MAGI is under $100k (phasing out to $0 by $150k); unused losses carry forward. On sale, claimed depreciation is recaptured at up to 25%, and gains may owe capital-gains tax (a 1031 exchange can defer both). Figures are a year-1 estimate at your 24.0% rate — not tax advice; consult a CPA.
Schools (NCES district)
- District
- South Lyon Community Schools
- NCES district ID
- 2632250
- Math proficiency
- 46% ▼ -10.00%
- Reading proficiency
- 59% ▼ -4.00%
- Median HH income
- $71,419
- Composite
- 46.86/100
- National rank
- #2372
- State rank
- #74 of 540 in MI
Livability — South Lyon
- Score
- 83/100
- State rank
- #46
- US rank
- #953
Category grades
Schools grade is shown separately in the Schools card above.
Census & demographics
- Census place
- South Lyon, MI
- County
- Oakland County · 1,009,092 people
- City population
- 37,789
- Metro
- Detroit-Warren-Dearborn, MI
- Population (ZIP)
- 37,789
- Household income
- $131,558
- Rent vs Own
- Severe rent burden
- 141.0
Population outlook (Oakland County) Hauer SSP2
- Today (2025)
- 1,335,747 people
- By 2030
- 1,375,100 · +2.9%
- By 2040
- 1,435,385 · +7.5%
- By 2050
- 1,469,250 · +10.0%
- By 2075
- 1,531,946 · +14.7%
- By 2100
- 1,450,485 · +8.6%
Race, ethnicity, and origin ACS 2023
- Neighborhood character
- Predominantly White (88%)
- Race & ethnicity
- White 88% Two or more races 4% Asian 4% Hispanic / Latino 3% Black 1%
- Common ancestry
- Romanian 14% Lithuanian 4% Slovak 4%
- Foreign-born
- 7% · Canada, South Korea, China
- Languages at home
- 93% English-only · Other Indo-European 2% Other Asian/Pacific 1% Chinese 1%
Political lean MEDSL · Oakland
- 2024 margin
- D (+10.6) · D 54.4% · R 43.8% · Other 1.9%
- 2008→2024 swing
- -3.9pp toward R · 2008: 14.5pp · 2024: 10.6pp
- All cycles
- 2024: D+10.6 2020: D+14.1 2016: D+8.1 2012: D+8.1 2008: D+14.5
Not yet ingested
- Civics
- —
Market trends
- HPI YoY
- ▼ -251.96%
- Current HPI
- 197.5122
- Rent YoY
- —
- Metro
- Detroit-Warren-Dearborn, MI
- State GDP YoY
- ▲ 1.37%
- F500 in state
- 28
Industry mix (Fortune 500 HQ in MI)
| Industry | F500 HQs | Revenue |
|---|---|---|
| Automotive Parts | 3 | $48B |
|
||
| Automotive | 2 | $372B |
|
||
| Chemicals | 1 | $45B |
|
||
| Automotive Retail | 1 | $29B |
|
||
| Healthcare / Medical Devices | 1 | $23B |
|
||
| Automotive Technology | 1 | $20B |
|
||
Price history
+69.1% since first listed21 events — show timeline
- 2026-05-29 Listed $109,900 SW Michigan MLS
- 2026-05-29 Listed $109,900 REALCOMP
- 2026-05-29 Listed $109,900 MiRealSource-MiMLS
- 2024-04-09 Sold (MLS) $80,000 MiRealSource-MiMLS
- 2024-04-09 Sold (MLS) $80,000 REALCOMP
- 2024-04-08 Pending — MiRealSource-MiMLS
- 2024-04-08 Pending — REALCOMP
- 2024-03-27 Contingent — MiRealSource-MiMLS
- 2024-03-27 Contingent — REALCOMP
- 2024-03-15 Listed $85,900 MiRealSource-MiMLS
- 2024-03-15 Listed $85,900 REALCOMP
- 2024-03-12 Coming Soon $85,900 MiRealSource-MiMLS
- 2024-03-12 Coming Soon $85,900 REALCOMP
- 2020-08-13 Sold (MLS) $59,995 MiRealSource-MiMLS
- 2020-08-13 Sold (MLS) $59,995 REALCOMP
- 2020-08-03 Pending — MiRealSource-MiMLS
- 2020-08-03 Pending — REALCOMP
- 2020-06-30 Price Changed $59,995 MiRealSource-MiMLS
- 2020-06-30 Price Changed $59,995 REALCOMP
- 2020-02-06 Listed $65,000 MiRealSource-MiMLS
- 2020-02-06 Listed $65,000 REALCOMP
Cash-flow waterfall
monthlySold comps — $/sqft
last 12 mo · ≤1 miLoading sold comps…