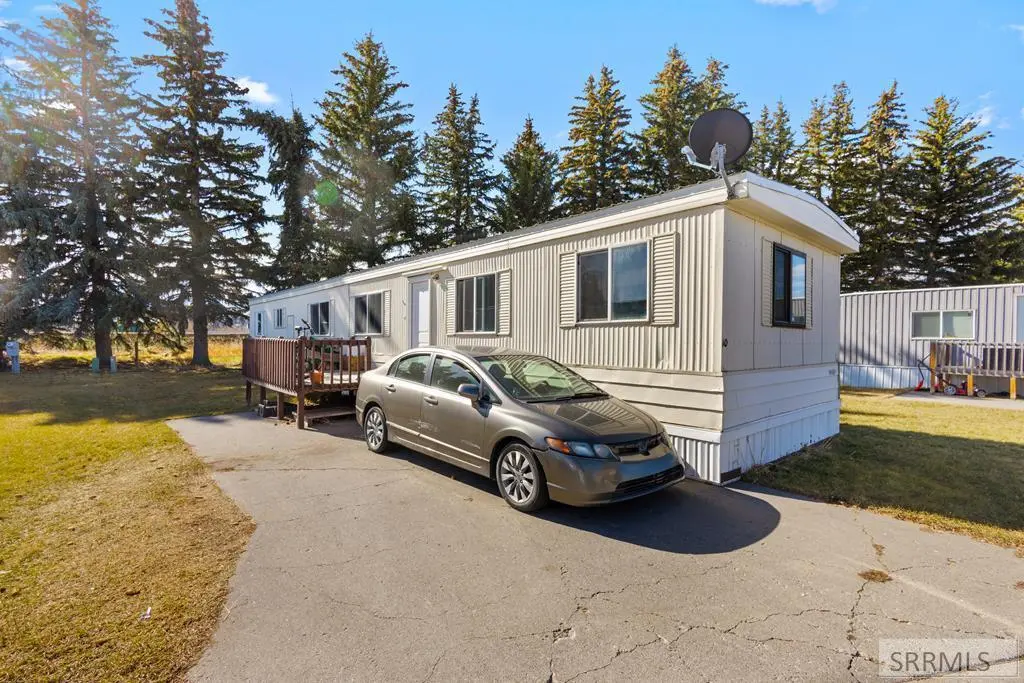
387 Airport Rd #10 · Rexburg, ID
Flood risk 1/10 · Minimal
- FEMA flood zone
- X
- Chance of flooding over 30 yrs
- 0.0%
- Est. flood insurance / yr
- $473 – $860
Fire risk 1/10 · Minimal
- Est. fire insurance / yr
- $584 – $1,086
Heat risk 3/10 · Minor
- Hot days now (above 90°F)
- 7 days/yr
- Hot days in 30 yrs
- 19 days/yr
Wind risk 1/10 · Minimal
- Chance of severe wind over 30 yrs
- —
Air-quality risk 6/10 · Moderate
- Unhealthy air days now
- 9 days/yr
- Unhealthy air days in 30 yrs
- 10 days/yr
Risk factors via First Street. Map © Google.
Why this score? — see what drove the B grade
The composite is a weighted blend of 9 inputs, each scored 0–100. Each bar is that input's sub-score; the figure is the points it added to the 100-point composite (weight × sub-score).
- Cash flow +30.0/30.0
- 1% rule +10.0/10.0
- DSCR +10.0/10.0
- ARV discount +7.5/15.0
- Livability +3.8/5.0
- Schools +3.7/10.0
- Rent growth +3.2/5.0
- Condition / age +2.5/5.0
- Appreciation +0.0/10.0
$70,000
🖨 Deal sheet 📄 Offer letter ✓ Due diligence
Listing remarks MLS
This single wide mobile home is perfect for a primary residence or investment property. It is a solid structure and has many updates with new LVP laminate flooring, a new gas furnace, a newer roof and windows. The trailer park is quiet and has mature trees and lawn. The lot rent is $350/month. Come take a look.
Key facts
- Great natural light
- Newer roof
- New lvp flooring
Tags
Neighborhood map
What this means for you Summary
Snapshot
- This is a 2-bed/1.0-bath manufactured listed at $70k.
Deal economics
- At list price, monthly cash flow is $424 ($5k/yr) — positive.
- The deal already cash-flows at list — no discount required.
- Meets the 1% rule at list price ($1k rent vs $70k).
Location & tenants
- Location reads 76/100 on livability (#25 in ID, #3,515 nationally) — a middle-class / working-renter tenant base. Strengths: crime A+, amenities A+, health & safety A+; Watch: housing C-, commute F, employment F.
- Madison District (town): math 44% / reading 47% proficiency, ranked #50 of 92 in ID (top 54%) — families likely to look elsewhere, expect single-tenant / working-renter base with shorter leases.
- Market conditions: Rents rising (+2.6%/yr); 384 active listings in the ZIP; 2 comparable units currently listed for rent nearby; 274 units permitted in Madison County in 2024 (80 in 5+ unit buildings).
Forward outlook
- Local home prices are declining (-3.0%/yr); year-one equity from $484 of loan paydown is wiped out by about $2k of value loss. Plan a longer hold.
- Madison County population projected at +10% by 2050 — modest demand growth; plan on rents tracking national, not racing it.
- At projected returns (-3.0% appreciation + 2.6% rent growth), your $20k cash investment doubles in ~5 years — after that, you're playing with house money.
Negotiation context
- Only 13 days on market — expect competitive offers; lowballing is unlikely to land.
- 2 sale attempts since 2y ago with the ask held roughly flat each time — persistent listings suggest the price (not the market) is what's stuck; bring a comps-based counter.
Questions for the listing agent
- Built in 1977 — when were the roof, HVAC, electrical panel, plumbing, and water heater last replaced?
- Is there a deadline driving the sale (1031 exchange, divorce, estate, relocation)? That informs how much negotiation room exists.
- Schools are B-rated — typically a magnet for longer-tenancy family renters. What's the average tenant stay here, and is there a school-zone premium baked into asking?
- What's the average days-on-market for RENTAL listings here right now (not sales)? A rising rental-DOM trend means longer vacancies and softer asking-rent achievability than the comps imply.
- What's the recent tenant-quality profile in this submarket — average credit score on applications, eviction rate, late-payment / NSF rate, and stable-employment percentage? A property-management company in the area should have these aggregated.
- How much new for-sale + rental construction is in the pipeline within 1–3 miles? Heavy new supply typically softens prices + rents 12–24 months out; constrained supply supports both.
Investment metrics
- 1% rule
- 1.64% ✓
- Cap rate
- 13.56%
- Cash-on-cash
- 25.96%
- DSCR
- 2.16
- GRM
- 5.1
CMA / ARV
No comps found within radius.
Projected returns pro-forma
-3.0% appreciation · 2.6% rent growth · sell at horizon
- IRR
- 19.2%
- Equity multiple
- 1.78×
- Total profit
- $15,219
- Equity at exit
- $10,437
- IRR
- 27.3%
- Equity multiple
- 3.36×
- Total profit
- $46,222
- Equity at exit
- $6,052
Cash invested: $19,600 (down + closing). Projections, not guarantees.
Landlord ↔ Tenant lean methodology
- Overall (STATE)
- 91 Strongly Landlord-Friendly
- State Idaho
- 91 Strongly Landlord-Friendly · R+18
- County
- — inherits STATE
- City
- — inherits STATE
ZIP-level market 83440
- Rents YoY
- 2.6%
- Active inventory
- 384
- Price-to-rent
- 5.1×
Monthly cashflow live
- Estimated rent
- $1,149 medium interval (Pro) →
- Mortgage (P&I)
- −$367
- Tax est. 1.5%
- −$88 /mo · $1,050/yr
- Insurance
- −$29
- HOA
- −$0
- Vacancy / Maint / Mgmt
- −$241
- Net cashflow
- $424
Break-even live
UW: 25.0% down · 7.5% · 30yr · 1.5% tax · 5.0% vac · 8.0% maint · 8.0% mgmt
Financing live
Cash to close
- Down payment
- $17,500
- Closing costs
- $2,100
- Reserves months
- —
- Total cash needed
- —
Loan-product check · same deal, 3 products live
Conventional
25% down · 7.5% · 30yr
- Down + closing
- —
- Monthly P&I
- —
- Monthly cashflow
- —
- DSCR
- —
- Eligible?
- —
Personal DTI + credit; lowest rate.
DSCR
20% down · 8.5% · 30yr
- Down + closing
- —
- Monthly P&I
- —
- Monthly cashflow
- —
- DSCR
- —
- Eligible?
- —
No personal income docs; deal must DSCR.
Hard money
10% down · 12.0% · 12mo
- Down + closing
- —
- Monthly P&I
- —
- Monthly cashflow
- —
- DSCR
- —
- Eligible?
- —
Short-term bridge; refi at stabilization.
Rent comps 2 comps
| Address | Beds | Baths | Sqft | Rent | $/sqft | DOM | Units | Dist |
|---|---|---|---|---|---|---|---|---|
| 810 Pioneer Rd Rexburg, ID | 2.0 | 1.0 | 800 | $1,100 | $1.38 | 20d | 1 | 1.03mi |
| 600 Pioneer Rd Rexburg, ID | 1.0–2.0 | 1.0 | 756 | $1,150 | $1.52 | 13d | 14 | 1.46mi |
Listing history 5 events
-
2026-03-31status Pending
-
2026-03-18$70,000 Active
-
2025-03-10soldstatus Closed 312-char remark
Show marketing remark (312 chars)
This single wide mobile home is perfect for a primary residence or investment property. It is a solid structure and has many updates with new LVP laminate flooring, a new gas furnace, a newer roof and windows. The trailer park is quiet and has mature trees and lawn. The lot rent is $350/month. Come take a look.
-
2025-02-21status Pending 312-char remark
Show marketing remark (312 chars)
This single wide mobile home is perfect for a primary residence or investment property. It is a solid structure and has many updates with new LVP laminate flooring, a new gas furnace, a newer roof and windows. The trailer park is quiet and has mature trees and lawn. The lot rent is $350/month. Come take a look.
-
2024-12-18$69,000 Active 312-char remark
Show marketing remark (312 chars)
This single wide mobile home is perfect for a primary residence or investment property. It is a solid structure and has many updates with new LVP laminate flooring, a new gas furnace, a newer roof and windows. The trailer park is quiet and has mature trees and lawn. The lot rent is $350/month. Come take a look.
ⓘ Source: listings_history table (triggers on properties + properties_extension) + one-shot
backfill from property_details.listing_events for pre-trigger history.
Climate risk First Street
- Flood 1/10 Low FEMA zone X · 0% chance over 30 yrs
- Wildfire 1/10 Low
- Heat 3/10 Moderate 7 d/yr ≥90°F today · 19 d/yr by 30 yrs out
- Wind 1/10 Low
- Air quality 6/10 Major 9 unhealthy d/yr today · 10 by 30 yrs out
Nearby sold comps map
Loading sold comps map…
Walkable amenities ~0.75 mi
Loading nearby amenities…
Taxation est. · year 1
- Rental income
- $13,789
- − Mortgage interest
- −$3,921
- − Property taxes
- −$1,050
- − Insurance
- −$350
- − Repairs & maintenance
- −$1,103
- − Management
- −$1,103
- − Depreciation
- −$2,036
- Taxable income
- $4,225
- Est. tax owed @ 24.0%
- −$1,014
- After-tax cash flow
- $4,074/yr
For passive investors: Depreciation is non-cash, so a rental often shows a tax loss while cash-flowing — sheltering income. Rental losses are passive: they offset passive income freely, and up to $25,000/yr can offset ordinary (W-2) income if you actively participate and your MAGI is under $100k (phasing out to $0 by $150k); unused losses carry forward. On sale, claimed depreciation is recaptured at up to 25%, and gains may owe capital-gains tax (a 1031 exchange can defer both). Figures are a year-1 estimate at your 24.0% rate — not tax advice; consult a CPA.
Schools (NCES district)
- District
- Madison District
- NCES district ID
- 1601920
- Math proficiency
- 44% ▲ 2.00%
- Reading proficiency
- 47% ▼ -3.00%
- Median HH income
- $31,737
- Composite
- 37.3/100
- National rank
- #4447
- State rank
- #50 of 92 in ID
Livability — Rexburg
- Score
- 76/100
- State rank
- #25
- US rank
- #3515
Category grades
Schools grade is shown separately in the Schools card above.
Census & demographics
- Census place
- Rexburg, ID
- County
- Madison County · 51,421 people
- City population
- 51,421
- Metro
- Rexburg, ID
- Population (ZIP)
- 51,421
- Household income
- $58,159
- Rent vs Own
- Severe rent burden
- 1480.0
Population outlook (Madison County) Hauer SSP2
- Today (2025)
- 40,126 people
- By 2030
- 41,845 · +4.3%
- By 2040
- 42,742 · +6.5%
- By 2050
- 44,170 · +10.1%
- By 2075
- 43,379 · +8.1%
- By 2100
- 41,607 · +3.7%
Race, ethnicity, and origin ACS 2023
- Neighborhood character
- Predominantly White (84%)
- Race & ethnicity
- White 84% Hispanic / Latino 10% Two or more races 6% Asian 2%
- Hispanic origin (detail)
- Mexican 6%
- Common ancestry
- Italian 5% Slovak 5% Portuguese 2%
- Foreign-born
- 5% · Canada, China
- Languages at home
- 90% English-only · Spanish 7% Chinese 1% Other Indo-European 1%
Political lean MEDSL · Madison
- 2024 margin
- Solid R (+64.3) · D 15.9% · R 80.2% · Other 3.8%
- 2008→2024 swing
- +8.5pp toward D · 2008: -72.8pp · 2024: -64.3pp
- All cycles
- 2024: R+64.3 2020: R+63.7 2016: R+49.3 2012: R+87.5 2008: R+72.8
Not yet ingested
- Civics
- —
Market trends
- HPI YoY
- ▼ -133.02%
- Current HPI
- 241.1775
- Rent YoY
- ▲ 2.60%
- Metro
- Rexburg, ID
- State GDP YoY
- ▲ 4.51%
- F500 in state
- 6
Industry mix (Fortune 500 HQ in ID)
| Industry | F500 HQs | Revenue |
|---|---|---|
| Retail | 1 | $79B |
|
||
| Technology | 1 | $25B |
|
||
| Food / Agriculture | 1 | $6B |
|
||
Price history
+1.4% since first listed5 events — show timeline
- 2026-03-31 Pending — SRMLS
- 2026-03-18 Listed $70,000 SRMLS
- 2025-03-10 Sold (MLS) — SRMLS
- 2025-02-21 Pending — SRMLS
- 2024-12-18 Listed $69,000 SRMLS
Property tax history
+5.5%/yrLatest (2016): $127 · +11.4% YoY. Source: county tax records.
Cash-flow waterfall
monthlySold comps — $/sqft
last 12 mo · ≤1 miLoading sold comps…