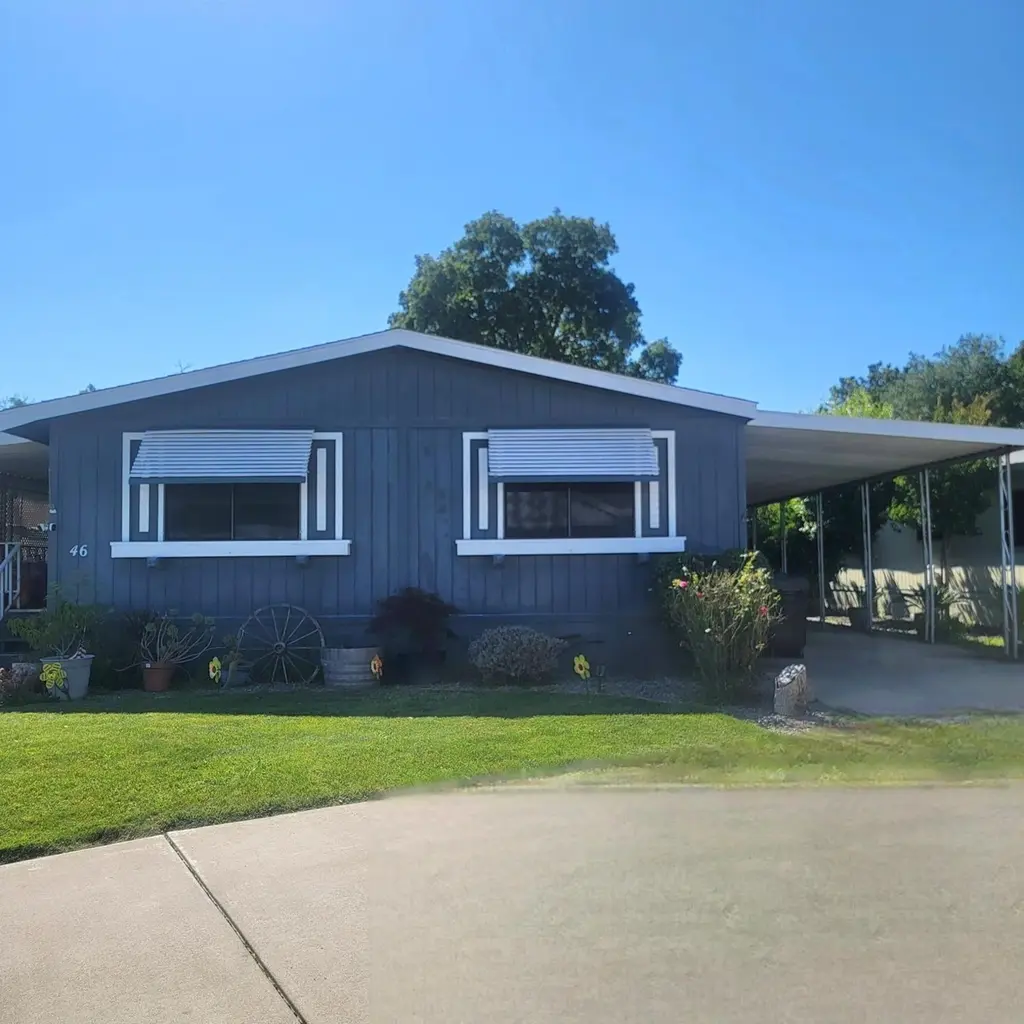
700 2nd St #46 · Galt, CA
Flood risk 1/10 · Minimal
- FEMA flood zone
- X (unshaded)
- Chance of flooding over 30 yrs
- 0.0%
- Est. flood insurance / yr
- $507 – $1,088
Fire risk 6/10 · Moderate
- Est. fire insurance / yr
- $659 – $1,223
Heat risk 7/10 · Major
- Hot days now (above 101°F)
- 7 days/yr
- Hot days in 30 yrs
- 14 days/yr
Wind risk 1/10 · Minimal
- Chance of severe wind over 30 yrs
- —
Air-quality risk 10/10 · Severe
- Unhealthy air days now
- 24 days/yr
- Unhealthy air days in 30 yrs
- 25 days/yr
Risk factors via First Street. Map © Google.
Why this score? — see what drove the B+ grade
The composite is a weighted blend of 9 inputs, each scored 0–100. Each bar is that input's sub-score; the figure is the points it added to the 100-point composite (weight × sub-score).
- Cash flow +30.0/30.0
- ARV discount +15.0/15.0
- 1% rule +10.0/10.0
- DSCR +10.0/10.0
- Schools +4.4/10.0
- Livability +2.9/5.0
- Rent growth +2.5/5.0
- Condition / age +2.5/5.0
- Appreciation +0.0/10.0
$179,000
🖨 Deal sheet (PDF) 📄 Offer letter ✓ Due diligence
Listing remarks
Welcome to the Lovely Heritage Senior Park. Nestled in the Oaks of Galt. This home is a 1568 Square feet, 3 bedroom, 2 bath, upgrades include painting, flooring and water heater, in a great location in the complex. Open floorplan, large kitchen, refrigerator, extra freezer, washer/dryer included, huge living room, inside laundry area with cabinets and closet, includes a garden, fruit trees, and a shed. Park provides many resident activities and has a lovely clubhouse and pool. Low park rent space- $570, includes water, sewer and garbage makes this a dream come true. Pets allowed, RV for additional fee. Please drive the speed limit 10 MPH.
Key facts
- Lovely garden
- Clubhouse
- Open floorplan
Tags
Property features AI
Finance
- Other: Lot is not land-leased (land lease listed separately); Address: 700 2nd St #46, Galt, CA 95632
- HOA & community: No homeowners association; Located in a senior community
Exterior
- Parking: Off-street covered parking; Guest parking available; No garage
- Utilities: Natural gas connected / gas plumbed; Public water; Public sewer; 220 volt outlet in laundry
- Home design: Manufactured home in a park; Double-wide; Built in 1989; Wood skirting; Bay Shore make
- Construction: Composition roof; Wood skirting
- Exterior features: Covered patio; Patio awning; Carport awning; Corner lot; Landscaped front and back with automatic sprinklers
Interior
- Kitchen: Free-standing gas range; Free-standing gas oven; Self-cleaning oven; Hood over range; Dishwasher; Disposal; Ice maker; Free-standing refrigerator; Laminate countertops
- Bedrooms: 3 bedrooms (including master bedroom)
- Flooring: Simulated wood flooring; Laminate flooring
- Bathrooms: 2 full bathrooms; Tub with shower over
- Heating & cooling: Central heating; Ceiling fans
- Interior features: Accessible approach with ramp and accessible doors; Cathedral/vaulted living room ceiling; Dual-pane windows with screens; Patio awning and carport awning; Porch steps and porch ramp; Covered patio
- Laundry & utility: Washer and dryer included; Laundry located in an inside laundry closet/room; Dryer electric; 220 volts in laundry
Neighborhood map
What this means for you Summary
Snapshot
- This is a 3-bed/2.0-bath manufactured listed at $179k.
Deal economics
- At list price, monthly cash flow is $1k ($17k/yr) — positive.
- The deal already cash-flows at list — no discount required.
- Meets the 1% rule at list price ($3k rent vs $179k).
- Cap rate 15.5% vs local median 3.3% in Galt — top-decile yield for the area; either an underpriced asset or a hidden risk that comps aren't pricing in. Stress-test before assuming the spread holds.
Location & tenants
- Location reads 57/100 on livability (#733 in CA) — a working-class tenant base; expect higher turnover. Strengths: housing A+, employment B; Watch: crime C-, schools D, amenities F.
- Galt Joint Union High (town): math 75% / reading 25% proficiency, ranked #137 of 517 in CA (top 26%) — acceptable for families but not a draw, mixed tenant base, ~2y average lease.
- Market conditions: 313 active listings in the ZIP; 2 comparable units currently listed for rent nearby; solid renter incomes; 6,825 units permitted in Sacramento County in 2024 (1,752 in 5+ unit buildings).
- This rent runs 36% of the median local income ($102k/yr) — at the standard rent-burdened threshold; future hikes will face affordability resistance.
Forward outlook
- Local home prices are declining (-3.0%/yr); year-one equity from $1k of loan paydown is wiped out by about $5k of value loss. Plan a longer hold.
- Sacramento County population projected at +17% by 2050 — long-run rental-demand tailwind backs the buy-and-hold thesis.
- At projected returns (-3.0% appreciation + 3.0% rent growth), your $50k cash investment doubles in ~4 years — after that, you're playing with house money.
Negotiation context
- Only 5 days on market — expect competitive offers; lowballing is unlikely to land.
Risks & watch-outs
- Climate carrying-cost: major wildfire risk; extreme-heat days projected 7→14/yr by 2055 (HVAC capex compounding) — expect insurance premiums to compound above CPI over the hold.
Questions for the listing agent
- Is there a deadline driving the sale (1031 exchange, divorce, estate, relocation)? That informs how much negotiation room exists.
- Schools are D-rated, which usually means shorter tenancies and higher turnover. Who's the typical renter profile here, and what's been the actual vacancy rate?
- What's the average days-on-market for RENTAL listings here right now (not sales)? A rising rental-DOM trend means longer vacancies and softer asking-rent achievability than the comps imply.
- What's the recent tenant-quality profile in this submarket — average credit score on applications, eviction rate, late-payment / NSF rate, and stable-employment percentage? A property-management company in the area should have these aggregated.
- How much new for-sale + rental construction is in the pipeline within 1–3 miles? Heavy new supply typically softens prices + rents 12–24 months out; constrained supply supports both.
Investment metrics
- 1% rule
- 1.71% ✓
- Cap rate
- 15.52%
- Cash-on-cash
- 32.96%
- DSCR
- 2.47
- GRM
- 4.9
CMA / ARV
- ARV (on-the-fly)
- $247,744
- Comps found
- 2
Show comp detail 2 sales within ~0.75 mi
| Address | Dist | Beds/Ba | Sqft | Sold | Price | $/sf | Match |
|---|---|---|---|---|---|---|---|
| 700 S 2nd St #28 | 0.00mi | 2/2.0 (-1) | 1,456 (-7%) | 24mo | $230,000 | $158 | 63 |
| 700 2nd St #59 | 0.00mi | 2/2.0 (-1) | 1,344 (-14%) | 13mo | $154,000 | $115 | 60 |
Match score weights: distance 35% · size 25% · config 20% · recency 20%. Top-matched comps best support the ARV.
Projected returns pro-forma
-3.0% appreciation · 3.0% rent growth · sell at horizon
- IRR
- 28.1%
- Equity multiple
- 2.17×
- Total profit
- $58,601
- Equity at exit
- $26,689
- IRR
- 35.5%
- Equity multiple
- 4.26×
- Total profit
- $163,638
- Equity at exit
- $15,477
Cash invested: $50,120 (down + closing). Projections, not guarantees.
Landlord ↔ Tenant lean methodology
- Overall (STATE)
- 18 Strongly Tenant-Friendly
- State California
- 18 Strongly Tenant-Friendly · D+13
- County
- — inherits STATE
- City
- — inherits STATE
ZIP-level market 95632
- Active inventory
- 313
- Price-to-rent
- 4.9×
Monthly cashflow live
- Estimated rent
- $3,066 medium interval (Pro) →
- Mortgage (P&I)
- −$939
- Tax from tax record
- −$32 /mo · $387/yr
- Insurance
- −$75
- HOA
- −$0
- Vacancy / Maint / Mgmt
- −$644
- Net cashflow
- $1,377
Break-even live
Sensitivity live
| Price | -10% $1,478 | -5% $1,427 | +0% $1,377 | +5% $1,326 | +10% $1,061 |
|---|---|---|---|---|---|
| Rent | -10% $1,134 | -5% $1,256 | +0% $1,377 | +5% $1,498 | +10% $1,619 |
| Rate | -1.0pp $1,467 | -0.5pp $1,422 | base $1,377 | +0.5pp $1,330 | +1.0pp $1,283 |
UW: 25.0% down · 7.5% · 30yr · 1.5% tax · 5.0% vac · 8.0% maint · 8.0% mgmt
Financing live
Cash to close
- Down payment
- $44,750
- Closing costs
- $5,370
- Reserves months
- —
- Total cash needed
- —
Loan-product check · same deal, 3 products live
Conventional
25% down · 7.5% · 30yr
- Down + closing
- —
- Monthly P&I
- —
- Monthly cashflow
- —
- DSCR
- —
- Eligible?
- —
Personal DTI + credit; lowest rate.
DSCR
20% down · 8.5% · 30yr
- Down + closing
- —
- Monthly P&I
- —
- Monthly cashflow
- —
- DSCR
- —
- Eligible?
- —
No personal income docs; deal must DSCR.
Hard money
10% down · 12.0% · 12mo
- Down + closing
- —
- Monthly P&I
- —
- Monthly cashflow
- —
- DSCR
- —
- Eligible?
- —
Short-term bridge; refi at stabilization.
Rent comps 2 comps
| Address | Beds | Baths | Sqft | Rent | $/sqft | DOM | Units | Dist |
|---|---|---|---|---|---|---|---|---|
| 111 E St Galt, CA | 4.0 | 2.0 | 1500 | $2,795 | $1.86 | 2d | 1 | 0.24mi |
| 243 Rio Mesa Ct Galt, CA | 3.0 | 2.0 | 1582 | $3,250 | $2.05 | 2d | 1 | 0.53mi |
Tax reassessment forecast CA · Resets to sale price
- Current annual tax
- $387 · $32/mo
- Projected year-2 tax
- $1,360 · $113/mo
- Expected delta
- +$973/yr (+$81/mo · 251.3%)
ⓘ Screening estimate from a state-policy table — verify with the county assessor before closing.
Climate risk First Street
- Flood 1/10 Low FEMA zone X (unshaded) · 0% chance over 30 yrs
- Wildfire 6/10 Major
- Heat 7/10 Severe 7 d/yr ≥101°F today · 14 d/yr by 30 yrs out
- Wind 1/10 Low
- Air quality 10/10 Extreme 24 unhealthy d/yr today · 25 by 30 yrs out
Nearby sold comps map
Loading sold comps map…
Walkable amenities ~0.75 mi
Loading nearby amenities…
Taxation est. · year 1
- Rental income
- $36,792
- − Mortgage interest
- −$10,027
- − Property taxes
- −$387
- − Insurance
- −$895
- − Repairs & maintenance
- −$2,943
- − Management
- −$2,943
- − Depreciation
- −$5,207
- Taxable income
- $14,389
- Est. tax owed @ 24.0%
- −$3,453
- After-tax cash flow
- $13,066/yr
For passive investors: Depreciation is non-cash, so a rental often shows a tax loss while cash-flowing — sheltering income. Rental losses are passive: they offset passive income freely, and up to $25,000/yr can offset ordinary (W-2) income if you actively participate and your MAGI is under $100k (phasing out to $0 by $150k); unused losses carry forward. On sale, claimed depreciation is recaptured at up to 25%, and gains may owe capital-gains tax (a 1031 exchange can defer both). Figures are a year-1 estimate at your 24.0% rate — not tax advice; consult a CPA.
Schools (NCES district)
- District
- Galt Joint Union High
- NCES district ID
- 0614820
- Math proficiency
- 75% ▲ 48.00%
- Reading proficiency
- 25% ▼ -32.00%
- Median HH income
- $62,916
- Composite
- 44.24/100
- National rank
- #2844
- State rank
- #137 of 517 in CA
Livability — Galt
- Score
- 57/100
- State rank
- #733
- US rank
- #21603
Category grades
Schools grade is shown separately in the Schools card above.
Census & demographics
- Census place
- Galt, CA
- County
- Sacramento County · 1,539,646 people
- City population
- 32,493
- Metro
- Sacramento-Roseville-Folsom, CA
- Population (ZIP)
- 32,493
- Household income
- $102,239
- Rent vs Own
- Severe rent burden
- 476.0
Population outlook (Sacramento County) Hauer SSP2
- Today (2025)
- 1,660,763 people
- By 2030
- 1,732,990 · +4.3%
- By 2040
- 1,855,755 · +11.7%
- By 2050
- 1,941,335 · +16.9%
- By 2075
- 2,046,162 · +23.2%
- By 2100
- 1,961,444 · +18.1%
Race, ethnicity, and origin ACS 2023
- Neighborhood character
- Diverse neighborhood (Simpson 0.60)
- Race & ethnicity
- White 45% Hispanic / Latino 44% Two or more races 16% Asian 5% Native American 2% Black 2%
- Hispanic origin (detail)
- Mexican 42%
- Common ancestry
- Russian 4% Italian 2% Slovak 2%
- Foreign-born
- 19% · Canada, China, Vietnam
- Languages at home
- 63% English-only · Spanish 32% Other Indo-European 2% Other Asian/Pacific 1%
Political lean MEDSL · Sacramento
- 2024 margin
- D (+19.7) · D 58.1% · R 38.4% · Other 3.5%
- 2008→2024 swing
- +0.7pp no change · 2008: 19.0pp · 2024: 19.7pp
- All cycles
- 2024: D+19.7 2020: D+25.3 2016: D+23.7 2012: D+16.3 2008: D+19.0
Not yet ingested
- Civics
- —
Market trends
- HPI YoY
- ▼ -309.48%
- Current HPI
- 309.3197
- Rent YoY
- —
- Metro
- Sacramento-Roseville-Folsom, CA
- State GDP YoY
- ▲ 3.21%
- F500 in state
- 116
Industry mix (Fortune 500 HQ in CA)
| Industry | F500 HQs | Revenue |
|---|---|---|
| Technology | 27 | $1,492B |
|
||
| Financial Services | 3 | $174B |
|
||
| Retail | 3 | $44B |
|
||
| Insurance | 3 | $26B |
|
||
| Media / Entertainment | 2 | $115B |
|
||
| Pharmaceuticals / Biotech | 2 | $62B |
|
||
Property tax history
+0.2%/yrLatest (2025): $387 · -1.4% YoY. Source: county tax records.
Cash-flow waterfall
monthlySold comps — $/sqft
last 12 mo · ≤1 miLoading sold comps…