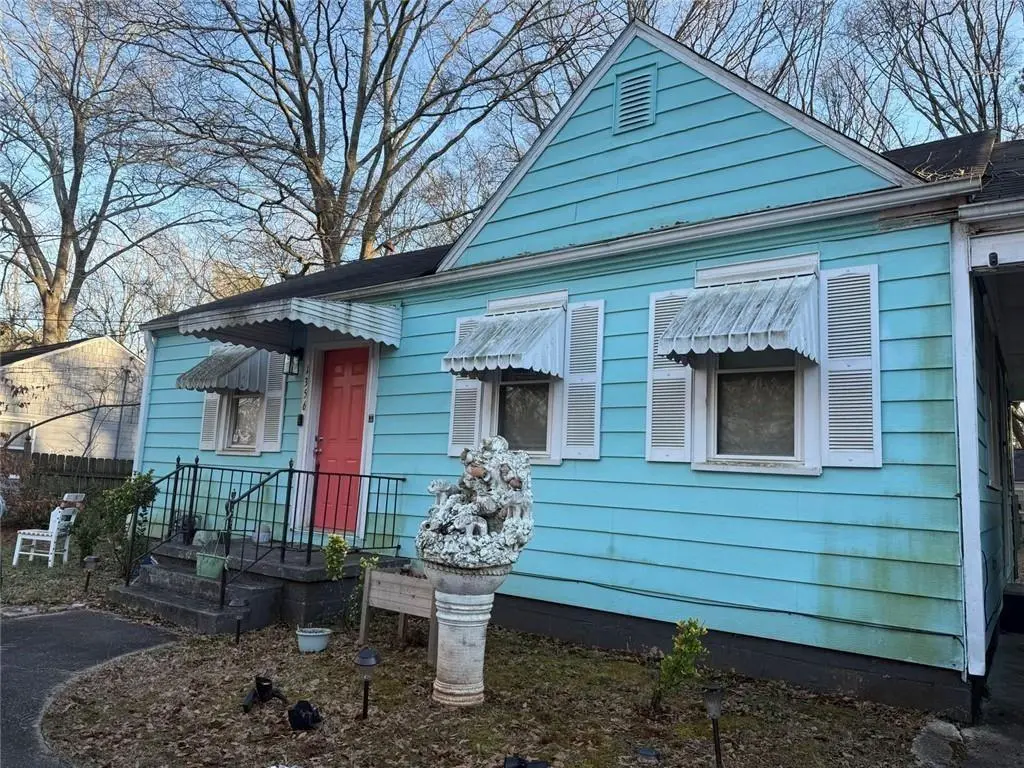
1356 Almont Dr SW · Atlanta, GA
Flood risk 1/10 · Minimal
- FEMA flood zone
- X (unshaded)
- Chance of flooding over 30 yrs
- 0.0%
- Est. flood insurance / yr
- $473 – $860
Fire risk 1/10 · Minimal
- Est. fire insurance / yr
- $963 – $1,789
Heat risk 5/10 · Moderate
- Hot days now (above 104°F)
- 7 days/yr
- Hot days in 30 yrs
- 16 days/yr
Wind risk 6/10 · Moderate
- Chance of severe wind over 30 yrs
- 27.0%
Air-quality risk 4/10 · Minor
- Unhealthy air days now
- 4 days/yr
- Unhealthy air days in 30 yrs
- 6 days/yr
Risk factors via First Street. Map © Google.
Why this score? — see what drove the C+ grade
The composite is a weighted blend of 9 inputs, each scored 0–100. Each bar is that input's sub-score; the figure is the points it added to the 100-point composite (weight × sub-score).
- Cash flow +21.4/30.0
- ARV discount +14.8/15.0
- DSCR +6.8/10.0
- 1% rule +5.6/10.0
- Livability +4.2/5.0
- Rent growth +3.2/5.0
- Schools +2.7/10.0
- Condition / age +2.5/5.0
- Appreciation +0.0/10.0
$165,000
🖨 Deal sheet 📄 Offer letter ✓ Due diligence
Listing remarks MLS
Investor owned, no disclosure- did not live here. Property is vacant and ready to be restored for new owner occupant or flipped by investor. Great rental income in growing community. No creative financing, no owner financing. No blind offers. No assignments. These offers and stipulations will NOT be responded to.
Key facts
- 8,755 sq ft lot
- 2 parking spots
- Built 1948
Neighborhood map
What this means for you Summary
Snapshot
- This is a 2-bed/1.0-bath single-family listed at $165k.
Deal economics
- At list price, monthly cash flow is $243 ($3k/yr) — positive.
- The deal already cash-flows at list — no discount required.
- Meets the 1% rule at list price ($2k rent vs $165k).
- Recommended offer: $155k (6.0% below list) — sets the bar for market timing.
- Cap rate 8.1% vs local median 3.1% in Atlanta — top-decile yield for the area; either an underpriced asset or a hidden risk that comps aren't pricing in. Stress-test before assuming the spread holds.
Location & tenants
- Location reads 83/100 on livability (#6 in GA, #919 nationally) — a professional / high-income tenant draw. Strengths: amenities A+, commute A+, housing A+; Watch: schools C-, cost of living C-.
- Atlanta Public Schools (urban): math 28% / reading 35% proficiency, ranked #80 of 174 in GA (top 46%) — families likely to look elsewhere, expect single-tenant / working-renter base with shorter leases; 71% free/reduced lunch — lower-income household profile, screen leases tightly.
- Market conditions: Rents rising (+2.8%/yr); 452 active listings in the ZIP; 38 comparable units currently listed for rent nearby; rentals at typical pace (median 25d on market — plan ~3-4 weeks tenant-placement turnaround); 11,565 units permitted in Fulton County in 2024 (8,159 in 5+ unit buildings).
- This rent runs 40% of the median local income ($53k/yr) — at the standard rent-burdened threshold; future hikes will face affordability resistance.
Forward outlook
- Local home prices are declining (-3.0%/yr); year-one equity from $1k of loan paydown is wiped out by about $5k of value loss. Plan a longer hold.
- Fulton County population projected at +38% by 2050 — long-run rental-demand tailwind backs the buy-and-hold thesis.
Negotiation context
- It's been on market 82 days — a 6% lower offer ($155k) is reasonable based on typical stale-listing flexibility.
- 5 sale attempts since 20y ago with the ask held roughly flat each time — persistent listings suggest the price (not the market) is what's stuck; bring a comps-based counter.
- Current owner paid $38k; list at $165k implies a 340% gain — meaningful room to come down on a strong offer.
Risks & watch-outs
- Watch-outs: built in 1948 — expect roof / HVAC / electrical / plumbing capex.
- Climate carrying-cost: major wind risk, 27% chance of damaging wind over 30y; extreme-heat days projected 7→16/yr by 2055 (HVAC capex compounding) — expect insurance premiums to compound above CPI over the hold.
Questions for the listing agent
- It's been on market 82 days. Have you received any prior offers? Is the seller open to a 6% concession, seller financing, or rate buy-down credit?
- Built in 1948 — when were the roof, HVAC, electrical panel, plumbing, and water heater last replaced?
- Why hasn't it sold? Are there any deal-killer items the seller is aware of (foundation, flood, title, zoning, code violations)?
- Is there a deadline driving the sale (1031 exchange, divorce, estate, relocation)? That informs how much negotiation room exists.
- What's the average days-on-market for RENTAL listings here right now (not sales)? A rising rental-DOM trend means longer vacancies and softer asking-rent achievability than the comps imply.
- What's the recent tenant-quality profile in this submarket — average credit score on applications, eviction rate, late-payment / NSF rate, and stable-employment percentage? A property-management company in the area should have these aggregated.
- How much new for-sale + rental construction is in the pipeline within 1–3 miles? Heavy new supply typically softens prices + rents 12–24 months out; constrained supply supports both.
Investment metrics
- 1% rule
- 1.06% ✓
- Cap rate
- 8.06%
- Cash-on-cash
- 6.32%
- DSCR
- 1.28
- GRM
- 7.9
CMA / ARV
- ARV (median comp)
- $196,795
- List price
- $165,000
- Delta
- -16.16%
- Verdict
- UNDERPRICED
- Comps
- 20 within 1.0 mi
Show comp detail 11 sales within ~0.75 mi
| Address | Dist | Beds/Ba | Sqft | Sold | Price | $/sf | Match |
|---|---|---|---|---|---|---|---|
| 979 Gaston St SW | 0.31mi | 2/1.0 | 842 (+3%) | 19mo | $207,000 | $246 | 65 |
| 1315 Elizabeth Ave SW | 0.52mi | 2/1.0 | 815 (-0%) | 14mo | $125,000 | $153 | 64 |
| 1225 Bridges Ave SW | 0.26mi | 2/1.0 | 899 (+10%) | 10mo | $95,000 | $106 | 62 |
| 1369 Almont Dr SW | 0.04mi | 3/1.0 (+1) | 924 (+13%) | 14mo | $121,000 | $131 | 60 |
| 1581 Kenmore St SW | 0.45mi | 2/1.0 | 910 (+12%) | 9mo | $199,995 | $220 | 52 |
| 1114 Oakland Dr SW | 0.31mi | 3/1.5 (+1) | 880 (+8%) | 20mo | $110,000 | $125 | 49 |
| 1290 Elizabeth Ave SW | 0.45mi | 2/1.0 | 720 (-12%) | 23mo | $115,000 | $160 | 40 |
| 1391 Elizabeth Ave SW | 0.68mi | 2/1.0 | 933 (+14%) | 6mo | $180,000 | $193 | 39 |
| 1338 Elizabeth Ave SW | 0.56mi | 2/1.0 | 928 (+14%) | 22mo | $215,000 | $232 | 33 |
| 1280 Beecher St SW | 0.53mi | 2/1.0 | 936 (+15%) | 22mo | $185,000 | $198 | 32 |
| 1406 Graymont Dr SW | 0.72mi | 2/1.0 | 900 (+10%) | 22mo | $185,500 | $206 | 31 |
Match score weights: distance 35% · size 25% · config 20% · recency 20%. Top-matched comps best support the ARV.
Projected returns pro-forma
-3.0% appreciation · 2.77% rent growth · sell at horizon
- IRR
- -6.8%
- Equity multiple
- 0.75×
- Total profit
- $-11,613
- Equity at exit
- $24,602
- IRR
- 2.5%
- Equity multiple
- 1.18×
- Total profit
- $8,300
- Equity at exit
- $14,266
Cash invested: $46,200 (down + closing). Projections, not guarantees.
Landlord ↔ Tenant lean methodology
- Overall (STATE)
- 90 Strongly Landlord-Friendly
- State Georgia
- 90 Strongly Landlord-Friendly · R+3
- County
- — inherits STATE
- City
- — inherits STATE
ZIP-level market 30310
- Home prices YoY
- -32.8%
- Rents YoY
- 2.8%
- Active inventory
- 452
- Price-to-rent
- 7.9×
Monthly cashflow live
- Estimated rent
- $1,746 high interval (Pro) →
- Mortgage (P&I)
- −$865
- Tax from tax record
- −$202 /mo · $2,424/yr
- Insurance
- −$69
- HOA
- −$0
- Vacancy / Maint / Mgmt
- −$367
- Net cashflow
- $243
Break-even live
UW: 25.0% down · 7.5% · 30yr · 1.5% tax · 5.0% vac · 8.0% maint · 8.0% mgmt
Financing live
Cash to close
- Down payment
- $41,250
- Closing costs
- $4,950
- Reserves months
- —
- Total cash needed
- —
Loan-product check · same deal, 3 products live
Conventional
25% down · 7.5% · 30yr
- Down + closing
- —
- Monthly P&I
- —
- Monthly cashflow
- —
- DSCR
- —
- Eligible?
- —
Personal DTI + credit; lowest rate.
DSCR
20% down · 8.5% · 30yr
- Down + closing
- —
- Monthly P&I
- —
- Monthly cashflow
- —
- DSCR
- —
- Eligible?
- —
No personal income docs; deal must DSCR.
Hard money
10% down · 12.0% · 12mo
- Down + closing
- —
- Monthly P&I
- —
- Monthly cashflow
- —
- DSCR
- —
- Eligible?
- —
Short-term bridge; refi at stabilization.
Rent comps 38 comps
| Address | Beds | Baths | Sqft | Rent | $/sqft | DOM | Units | Dist |
|---|---|---|---|---|---|---|---|---|
| 1080 Westmont Rd SW Atlanta, GA | 3.0 | 2.0 | 1022 | $2,500 | $2.45 | 15d | 1 | 0.30mi |
| 1084 Cordova St SW Atlanta, GA | 2.0 | 1.0 | 750 | $1,295 | $1.73 | 19d | 1 | 0.39mi |
| 1537 Orlando St SW Atlanta, GA | 2.0 | 1.0 | 1068 | $1,700 | $1.59 | 24d | 1 | 0.39mi |
| 1280 Kenilworth Dr SW Atlanta, GA | 3.0 | 2.0 | 1000 | $1,800 | $1.80 | 24d | 1 | 0.42mi |
| 1291 Lorenzo Dr SW Unit 1 Atlanta, GA | 3.0 | 1.0 | 1100 | $1,825 | $1.66 | 15d | 1 | 0.43mi |
| 1180 Richland Rd SW Atlanta, GA | 3.0 | 2.0 | 1082 | $2,800 | $2.59 | 24d | 1 | 0.45mi |
| 1280 Elizabeth Ave SW Atlanta, GA | 3.0 | 1.0 | 1105 | $1,950 | $1.76 | 24d | 1 | 0.46mi |
| 973 Lawton St SW Atlanta, GA | 3.0 | 1.0 | 912 | $1,575 | $1.73 | 8d | 1 | 0.51mi |
| 1295 Westmont Rd SW Atlanta, GA | 2.0 | 1.0 | 910 | $1,500 | $1.65 | 24d | 1 | 0.54mi |
| 1361 Byrere Ter SW Unit 2 Atlanta, GA | 2.0 | 1.0 | 836 | $1,299 | $1.55 | 24d | 1 | 0.54mi |
| 2159 M L King Jr DR SW Atlanta, GA | 1.0 | 1.0 | 1050 | $800 | $0.76 | 3d | 1 | 0.55mi |
| 1250 Byewood Ln SW Atlanta, GA | 2.0 | 2.0 | 1100 | $2,150 | $1.95 | 24d | 1 | 0.58mi |
| 1226 Byewood Ln SW Unit B Atlanta, GA | 2.0 | 2.0 | 831 | $1,950 | $2.35 | 24d | 1 | 0.60mi |
| 763 Cascade Ave SW Atlanta, GA | 2.0 | 1.0 | 900 | $1,249 | $1.39 | 2d | 5 | 0.68mi |
| 1300 Wichita Dr SW Atlanta, GA | 3.0 | 2.0 | 1077 | $2,200 | $2.04 | 24d | 1 | 0.69mi |
| 1404 Lockwood Dr SW Atlanta, GA | 2.0 | 2.0 | 980 | $1,700 | $1.73 | 8d | 1 | 0.73mi |
| 1587 Olympian Cir SW Unit B Atlanta, GA | 2.0 | 1.0 | 1086 | $1,300 | $1.20 | 24d | 1 | 0.80mi |
| 818 Peeples St SW Atlanta, GA | 2.0 | 1.0 | 936 | $1,500 | $1.60 | 24d | 1 | 0.82mi |
| 1256 Ralph David Abernathy Blvd SW Atlanta, GA | 2.0 | 1.0 | 1000 | $1,200 | $1.20 | 24d | 1 | 0.88mi |
| 801 Joseph E Lowery Blvd SW #2 Atlanta, GA | 1.0 | 1.0 | 560 | $1,450 | $2.59 | 24d | 1 | 0.94mi |
| 565 Langhorn St SW Unit C3 Atlanta, GA | 1.0 | 1.0 | 650 | $995 | $1.53 | 2d | 1 | 0.95mi |
| 825 Erin Ave SW Atlanta, GA | 2.0 | 1.0 | 776 | $3,000 | $3.87 | 24d | 1 | 1.08mi |
| 1194 Lucile Ave SW Unit 4 Atlanta, GA | 2.0 | 1.0 | 950 | $1,375 | $1.45 | 24d | 1 | 1.15mi |
| 717 Lee St SW Atlanta, GA | 1.0–2.0 | 1.0 | 768 | $1,416 | $1.84 | 2d | 5 | 1.15mi |
| 1437 Lucile Ave SW Unit 8 Atlanta, GA | 2.0 | 1.0 | 1060 | $1,800 | $1.70 | 22d | 1 | 1.17mi |
| 725 Catherine St SW Unit 1 Atlanta, GA | 1.0 | 1.0 | 600 | $1,195 | $1.99 | 24d | 1 | 1.19mi |
| 725 Catherine St SW Unit 1 Atlanta, GA | 1.0 | 1.0 | 651 | $1,400 | $2.15 | 15d | 1 | 1.19mi |
| 1155 Lucile Ave SW Unit 4 Atlanta, GA | 2.0 | 2.0 | 926 | $1,525 | $1.65 | 24d | 1 | 1.20mi |
| 1155 Lucile Ave SW Apt 1 Atlanta, GA | 3.0 | 2.0 | 1026 | $1,775 | $1.73 | 24d | 1 | 1.20mi |
| 1170 Greenwich St SW #3 Atlanta, GA | 2.0 | 1.0 | 900 | $1,250 | $1.39 | 19d | 1 | 1.25mi |
| 1246 Allene Ave SW Atlanta, GA | 2.0 | 1.0–2.0 | 896 | $2,110 | $2.35 | 1d | 23 | 1.26mi |
| 806 Murphy Ave SW Atlanta, GA | 1.0–2.0 | 1.0 | 825 | $1,254 | $1.52 | 24d | 8 | 1.28mi |
| 806 Murphy Ave SW Atlanta, GA | 1.0 | 1.0 | 731 | $1,254 | $1.72 | 8d | 3 | 1.28mi |
| 379 Atwood St SW Unit 4 Atlanta, GA | 2.0 | 1.0 | 800 | $1,800 | $2.25 | 24d | 1 | 1.30mi |
| 1729 Evans Dr SW Unit B Atlanta, GA | 2.0 | 1.5 | 1000 | $1,500 | $1.50 | 24d | 1 | 1.35mi |
| 1699 Derry Ave SW Atlanta, GA | 2.0 | 1.0 | 825 | $1,800 | $2.18 | 24d | 1 | 1.38mi |
| 600 Mayland Ave SW Atlanta, GA | 3.0 | 2.0 | 1100 | $2,300 | $2.09 | 24d | 1 | 1.43mi |
| 1133 Mayland Cir SW Atlanta, GA | 3.0 | 2.0 | 1120 | $3,600 | $3.21 | 24d | 1 | 1.50mi |
Listing history 10 events
-
2026-05-31days on market $165,000 Active 82 DOM
-
2026-03-10$165,000 New 317-char remark
Show marketing remark (317 chars)
Investor owned, no disclosure- did not live here. Property is vacant and ready to be restored for new owner occupant or flipped by investor. Great rental income in growing community. No creative financing, no owner financing. No blind offers. No assignments. These offers and stipulations will NOT be responded to.
-
2026-03-10$165,000 Active 317-char remark
Show marketing remark (317 chars)
Investor owned, no disclosure- did not live here. Property is vacant and ready to be restored for new owner occupant or flipped by investor. Great rental income in growing community. No creative financing, no owner financing. No blind offers. No assignments. These offers and stipulations will NOT be responded to.
-
2024-12-31historical
-
2024-12-31historical
-
2024-09-22$195,000 New
-
2024-09-22$195,000 Active
-
2017-01-05soldstatus $37,500
-
2007-06-27soldstatus $55,000
-
2006-11-10$54,900
ⓘ Source: listings_history table (triggers on properties + properties_extension) + one-shot
backfill from property_details.listing_events for pre-trigger history.
Tax reassessment forecast GA · Resets to sale price
- Current annual tax
- $2,424 · $202/mo
- Projected year-2 tax
- $2,424 · $202/mo
- Expected delta
- $0/yr ($0/mo · 0.0%)
ⓘ Screening estimate from a state-policy table — verify with the county assessor before closing.
Climate risk First Street
- Flood 1/10 Low FEMA zone X (unshaded) · 0% chance over 30 yrs
- Wildfire 1/10 Low
- Heat 5/10 Major 7 d/yr ≥104°F today · 16 d/yr by 30 yrs out
- Wind 6/10 Major 27% chance of damaging wind over 30 yrs
- Air quality 4/10 Moderate 4 unhealthy d/yr today · 6 by 30 yrs out
Nearby sold comps map
Loading sold comps map…
Walkable amenities ~0.75 mi
Loading nearby amenities…
Taxation est. · year 1
- Rental income
- $20,954
- − Mortgage interest
- −$9,243
- − Property taxes
- −$2,424
- − Insurance
- −$825
- − Repairs & maintenance
- −$1,676
- − Management
- −$1,676
- − Depreciation
- −$4,800
- Taxable income
- $309
- Est. tax owed @ 24.0%
- −$74
- After-tax cash flow
- $2,847/yr
For passive investors: Depreciation is non-cash, so a rental often shows a tax loss while cash-flowing — sheltering income. Rental losses are passive: they offset passive income freely, and up to $25,000/yr can offset ordinary (W-2) income if you actively participate and your MAGI is under $100k (phasing out to $0 by $150k); unused losses carry forward. On sale, claimed depreciation is recaptured at up to 25%, and gains may owe capital-gains tax (a 1031 exchange can defer both). Figures are a year-1 estimate at your 24.0% rate — not tax advice; consult a CPA.
Schools (NCES district)
- District
- Atlanta Public Schools
- NCES district ID
- 1300120
- Math proficiency
- 28% ▼ -6.00%
- Reading proficiency
- 35% ▼ -2.00%
- Median HH income
- $48,306
- Composite
- 27.27/100
- National rank
- #7006
- State rank
- #80 of 174 in GA
Livability — Atlanta
- Score
- 83/100
- State rank
- #6
- US rank
- #919
Category grades
Schools grade is shown separately in the Schools card above.
Census & demographics
- Census place
- Atlanta, GA
- County
- Fulton County · 1,094,430 people
- City population
- 629,525
- Metro
- Atlanta-Sandy Springs-Alpharetta, GA
- Population (ZIP)
- 27,186
- Household income
- $53,037
- Rent vs Own
- Severe rent burden
- 1676.0
Population outlook (Fulton County) Hauer SSP2
- Today (2025)
- 1,203,707 people
- By 2030
- 1,299,706 · +8.0%
- By 2040
- 1,488,256 · +23.6%
- By 2050
- 1,664,580 · +38.3%
- By 2075
- 2,036,072 · +69.2%
- By 2100
- 2,222,402 · +84.6%
Race, ethnicity, and origin ACS 2023
- Neighborhood character
- Predominantly Black (76%)
- Race & ethnicity
- Black 76% White 14% Two or more races 4% Hispanic / Latino 4% Asian 2%
- Common ancestry
- Lithuanian 1% Slovak 1% Serbian 0%
- Foreign-born
- 5% · Canada, South Korea, Vietnam
- Languages at home
- 92% English-only · Spanish 4% French/Haitian/Cajun 1% Other Indo-European 1%
Political lean MEDSL · Fulton
- 2024 margin
- Solid D (+44.9) · D 71.9% · R 27.0% · Other 1.1%
- 2008→2024 swing
- +9.8pp toward D · 2008: 35.0pp · 2024: 44.9pp
- All cycles
- 2024: D+44.9 2020: D+46.4 2016: D+42.1 2012: D+29.6 2008: D+35.0
Not yet ingested
- Civics
- —
Market trends
- HPI YoY
- ▼ -204.00%
- Current HPI
- 418.7297
- Rent YoY
- ▲ 2.77%
- Metro
- Atlanta-Sandy Springs-Alpharetta, GA
- State GDP YoY
- ▲ 2.66%
- F500 in state
- 28
Industry mix (Fortune 500 HQ in GA)
| Industry | F500 HQs | Revenue |
|---|---|---|
| Paper / Packaging | 2 | $29B |
|
||
| Retail | 1 | $160B |
|
||
| Transportation / Logistics | 1 | $91B |
|
||
| Airlines | 1 | $62B |
|
||
| Consumer Goods | 1 | $47B |
|
||
| Utilities | 1 | $25B |
|
||
Price history
+200.5% since first listed9 events — show timeline
- 2026-03-10 Listed $165,000 FMLS
- 2026-03-10 Listed $165,000 GAMLS
- 2024-12-31 Listing Removed — FMLS
- 2024-12-31 Listing Removed — GAMLS
- 2024-09-22 Listed $195,000 FMLS
- 2024-09-22 Listed $195,000 GAMLS
- 2017-01-05 Sold (Public Records) $37,500 Public Records
- 2007-06-27 Sold (MLS) $55,000 FMLS
- 2006-11-10 Listed $54,900 FMLS
Property tax history
+3.0%/yrLatest (2025): $2,424 · -20.9% YoY. Source: county tax records.
Cash-flow waterfall
monthlySold comps — $/sqft
last 12 mo · ≤1 miLoading sold comps…