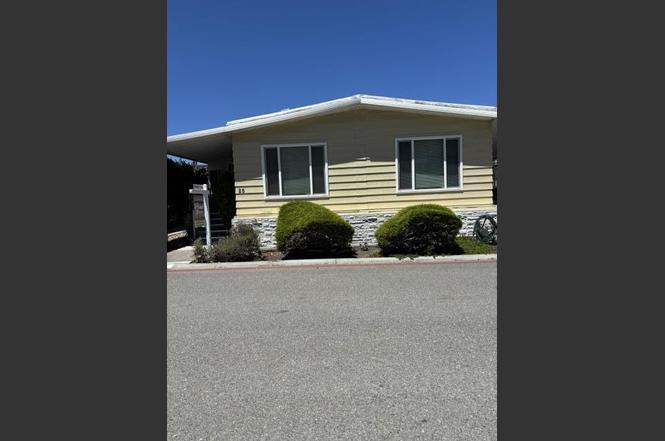
1111 Morse Ave #25 · Sunnyvale, CA
Flood risk 1/10 · Minimal
- FEMA flood zone
- AE
- Chance of flooding over 30 yrs
- 0.0%
- Est. flood insurance / yr
- $1,737 – $8,500
Fire risk 1/10 · Minimal
- Est. fire insurance / yr
- $659 – $1,223
Heat risk 5/10 · Moderate
- Hot days now (above 90°F)
- 7 days/yr
- Hot days in 30 yrs
- 15 days/yr
Wind risk 1/10 · Minimal
- Chance of severe wind over 30 yrs
- —
Air-quality risk 7/10 · Major
- Unhealthy air days now
- 13 days/yr
- Unhealthy air days in 30 yrs
- 13 days/yr
Risk factors via First Street. Map © Google.
Why this score? — see what drove the B+ grade
The composite is a weighted blend of 9 inputs, each scored 0–100. Each bar is that input's sub-score; the figure is the points it added to the 100-point composite (weight × sub-score).
- Cash flow +30.0/30.0
- 1% rule +10.0/10.0
- DSCR +10.0/10.0
- ARV discount +8.6/15.0
- Schools +8.3/10.0
- Livability +4.1/5.0
- Appreciation +3.2/10.0
- Rent growth +3.2/5.0
- Condition / age +2.5/5.0
$253,000
🖨 Deal sheet 📄 Offer letter ✓ Due diligence
Listing remarks MLS
Location, Location! Charming and Affordable Manufacture home in sought-after55+ Community, 2 Bedroom and 2 Bathroom, Approximately 1,440 SQ Feet, Double-Pane Windows, Laminate Flooring Throughout, Kitchen with Quartz Counter Top, Washer and Dryer provided. Club House with Swimming Pool and Jacuzzi, and Large Party Room, etc. Space Rent $1,774.98
Key facts
- Laminate flooring
- Quartz counter top
- Swimming pool
Tags
Property features AI
Finance
- Other: Living area approximately 1,440; Section identifiers: S12910U, S12910X
- HOA & community: Community amenities include barbecue area, billiard room, clubhouse, community pool and sauna/spa/hot tub
Exterior
- Parking: Carport (2 spaces minimum); Covered parking; Guest/visitor parking; Tandem parking; Assigned space number 25 (space rent applies)
- Utilities: Public water; Public sewer; Public utilities
- Home design: Single-story; Manufactured/mobile home
- Construction: Foam roofing
- Exterior features: Foam roof; Pets allowed; Senior community (55+); Leased land (park home site)
Interior
- Kitchen: Gas cooktop; Dishwasher; Garbage disposal; Range hood; Pantry; Refrigerator included; Kitchen and family room combined
- Bedrooms: Two bedrooms (one on ground floor)
- Flooring: Laminate flooring
- Bathrooms: Two full bathrooms with double sinks and shower-and-tub combinations
- Heating & cooling: Central forced air heating; Gas heating; Central forced air cooling
- Interior features: Laundry room with washer and dryer; Wet bar; Cable TV available
- Laundry & utility: Washer and dryer in unit; Storage room
Neighborhood map
What this means for you Summary
Snapshot
- This is a 2-bed/2.0-bath manufactured listed at $253k.
Deal economics
- At list price, monthly cash flow is $1k ($15k/yr) — positive.
- The deal already cash-flows at list — no discount required.
- Meets the 1% rule at list price ($4k rent vs $253k).
- Cap rate 14.1% vs local median 1.2% in Sunnyvale — top-decile yield for the area; either an underpriced asset or a hidden risk that comps aren't pricing in. Stress-test before assuming the spread holds.
Location & tenants
- Location reads 82/100 on livability (#37 in CA, #1,258 nationally) — a professional / high-income tenant draw. Strengths: amenities A+, commute A+, employment A+; Watch: cost of living F.
- Fremont Union High (urban): math 87% / reading 91% proficiency, ranked #6 of 517 in CA (top 1%) — strong family-tenant draw, lease renewals of 3-5y typical.
- Zoned schools: Fremont High (math 67% / reading 82%, grade B+, #78 of 1,170 statewide, top 7%, 2,171 students, 23% FRL).
- Zoned-school proficiency averages 74% at this address vs 89% district-wide (-14 pts) — the specific schools serving this property underperform the Fremont Union High average; the district grade overstates school quality for this exact location.
- Market conditions: Rents rising (+2.6%/yr); 69 active listings in the ZIP; 10 comparable units currently listed for rent nearby; rentals leasing fast (median 2d on market — plan ~1-2 weeks tenant-placement turnaround); high-income renter base; 3,838 units permitted in Santa Clara County in 2024 (1,886 in 5+ unit buildings).
Forward outlook
- Local home prices are declining (-3.0%/yr); year-one equity from $2k of loan paydown is wiped out by about $8k of value loss. Plan a longer hold.
- Santa Clara County population projected at +24% by 2050 — long-run rental-demand tailwind backs the buy-and-hold thesis.
- At projected returns (-3.0% appreciation + 2.6% rent growth), your $71k cash investment doubles in ~6 years — after that, you're playing with house money.
Negotiation context
- Only 7 days on market — expect competitive offers; lowballing is unlikely to land.
- 4 sale attempts since 11y ago with the ask held roughly flat each time — persistent listings suggest the price (not the market) is what's stuck; bring a comps-based counter.
- Current owner paid $145k; list at $253k implies a 74% gain — meaningful room to come down on a strong offer.
Risks & watch-outs
- Watch-outs: flood insurance adds $427/mo.
- Climate carrying-cost: in FEMA flood zone AE (mandatory federal flood insurance); extreme-heat days projected 7→15/yr by 2055 (HVAC capex compounding) — expect insurance premiums to compound above CPI over the hold.
Questions for the listing agent
- Built in 1975 — when were the roof, HVAC, electrical panel, plumbing, and water heater last replaced?
- What's the actual annual flood-insurance premium (NFIP or private), and is the property in a SFHA with mandatory coverage?
- Is there a deadline driving the sale (1031 exchange, divorce, estate, relocation)? That informs how much negotiation room exists.
- Schools are B-rated — typically a magnet for longer-tenancy family renters. What's the average tenant stay here, and is there a school-zone premium baked into asking?
- What's the average days-on-market for RENTAL listings here right now (not sales)? A rising rental-DOM trend means longer vacancies and softer asking-rent achievability than the comps imply.
- What's the recent tenant-quality profile in this submarket — average credit score on applications, eviction rate, late-payment / NSF rate, and stable-employment percentage? A property-management company in the area should have these aggregated.
- How much new for-sale + rental construction is in the pipeline within 1–3 miles? Heavy new supply typically softens prices + rents 12–24 months out; constrained supply supports both.
Investment metrics
- 1% rule
- 1.70% ✓
- Cap rate
- 14.12%
- Cash-on-cash
- 27.95%
- DSCR
- 2.24
- GRM
- 4.9
CMA / ARV
- ARV (on-the-fly)
- $259,200
- Comps found
- 12
Show comp detail 12 sales within ~0.75 mi
| Address | Dist | Beds/Ba | Sqft | Sold | Price | $/sf | Match |
|---|---|---|---|---|---|---|---|
| 1111 Morse Ave Spc 17 | 0.00mi | 2/2.0 | 1,440 (0%) | 6mo | $240,000 | $167 | 95 |
| 1111 Morse Ave #29 | 0.01mi | 2/2.0 | 1,440 (0%) | 6mo | $230,000 | $160 | 94 |
| 1111 Morse Ave #36 | 0.14mi | 2/2.0 | 1,438 (-0%) | 7mo | $199,999 | $139 | 87 |
| 1111 Morse Ave #74 | 0.00mi | 3/2.0 (+1) | 1,540 (+7%) | 4mo | $340,000 | $221 | 80 |
| 690 Persian Dr #61 | 0.55mi | 2/2.0 | 1,464 (+2%) | 2mo | $229,500 | $157 | 70 |
| 690 Persian Dr #4 | 0.56mi | 2/2.0 | 1,440 (0%) | 7mo | $229,900 | $160 | 68 |
| 1050 Borregas Ave #69 | 0.22mi | 3/2.0 (+1) | 1,590 (+10%) | 6mo | $293,000 | $184 | 63 |
| 690 Persian Dr #18 | 0.55mi | 2/2.0 | 1,600 (+11%) | 3mo | $160,000 | $100 | 53 |
| 600 E Weddell Dr #192 | 0.45mi | 3/2.0 (+1) | 1,248 (-13%) | 2mo | $300,000 | $240 | 50 |
| 600 E Weddell Dr #9 | 0.47mi | 3/2.0 (+1) | 1,269 (-12%) | 6mo | $228,000 | $180 | 48 |
| 600 E Weddell Dr #184 | 0.45mi | 3/2.0 (+1) | 1,227 (-15%) | 3mo | $280,000 | $228 | 47 |
| 690 Persian Dr #8 | 0.55mi | 3/2.0 (+1) | 1,602 (+11%) | 6mo | $327,000 | $204 | 45 |
Match score weights: distance 35% · size 25% · config 20% · recency 20%. Top-matched comps best support the ARV.
Projected returns pro-forma
-3.0% appreciation · 2.63% rent growth · sell at horizon
- IRR
- 12.7%
- Equity multiple
- 1.50×
- Total profit
- $35,660
- Equity at exit
- $37,723
- IRR
- 21.3%
- Equity multiple
- 2.78×
- Total profit
- $126,223
- Equity at exit
- $21,875
Cash invested: $70,840 (down + closing). Projections, not guarantees.
Landlord ↔ Tenant lean methodology
- Overall (STATE)
- 18 Strongly Tenant-Friendly
- State California
- 18 Strongly Tenant-Friendly · D+13
- County
- — inherits STATE
- City
- — inherits STATE
ZIP-level market 94089
- Home prices YoY
- -1.1%
- Rents YoY
- 2.6%
- Active inventory
- 69
- Price-to-rent
- 4.9×
Monthly cashflow live
- Estimated rent
- $4,302 high interval (Pro) →
- Mortgage (P&I)
- −$1,327
- Tax est. 1.5%
- −$316 /mo · $3,795/yr
- Insurance
- −$105
- Flood insurance flood zone
- −$427 /mo · $5,118/yr
- HOA
- −$0
- Vacancy / Maint / Mgmt
- −$903
- Net cashflow
- $1,224
Break-even live
UW: 25.0% down · 7.5% · 30yr · 1.5% tax · 5.0% vac · 8.0% maint · 8.0% mgmt
Financing live
Cash to close
- Down payment
- $63,250
- Closing costs
- $7,590
- Reserves months
- —
- Total cash needed
- —
Loan-product check · same deal, 3 products live
Conventional
25% down · 7.5% · 30yr
- Down + closing
- —
- Monthly P&I
- —
- Monthly cashflow
- —
- DSCR
- —
- Eligible?
- —
Personal DTI + credit; lowest rate.
DSCR
20% down · 8.5% · 30yr
- Down + closing
- —
- Monthly P&I
- —
- Monthly cashflow
- —
- DSCR
- —
- Eligible?
- —
No personal income docs; deal must DSCR.
Hard money
10% down · 12.0% · 12mo
- Down + closing
- —
- Monthly P&I
- —
- Monthly cashflow
- —
- DSCR
- —
- Eligible?
- —
Short-term bridge; refi at stabilization.
Rent comps 10 comps
| Address | Beds | Baths | Sqft | Rent | $/sqft | DOM | Units | Dist |
|---|---|---|---|---|---|---|---|---|
| 1063 Morse Ave Sunnyvale, CA | 1.0–2.0 | 1.0–2.0 | 844 | $5,014 | $5.94 | 1d | 14 | 0.26mi |
| 621 Tasman Dr Sunnyvale, CA | 1.0–2.0 | 1.0–2.0 | 959 | $4,557 | $4.75 | 1d | 9 | 0.50mi |
| 550 E Weddell Dr Sunnyvale, CA | 1.0–3.0 | 1.0–2.0 | 1255 | $4,986 | $3.97 | 1d | 8 | 0.50mi |
| 1220 N Fair Oaks Ave Sunnyvale, CA | 1.0–2.0 | 1.0–2.0 | 887 | $4,780 | $5.39 | 1d | 4 | 0.52mi |
| 785 N Fair Oaks Ave #8 Sunnyvale, CA | 2.0 | 1.0 | 926 | $3,300 | $3.56 | 10d | 1 | 0.74mi |
| 781 N Fair Oaks Ave #6 Sunnyvale, CA | 3.0 | 2.0 | 1134 | $3,795 | $3.35 | 16d | 1 | 0.74mi |
| 676 Johanna Ave Unit 2 Sunnyvale, CA | 2.0 | 1.0 | 892 | $2,650 | $2.97 | 1d | 1 | 0.98mi |
| 1271 Lawrence Station Rd Sunnyvale, CA | 1.0–2.0 | 1.0–2.5 | 1417 | $5,197 | $3.67 | 1d | 7 | 1.22mi |
| 725 San Simeon St #1617 Sunnyvale, CA | 3.0 | 2.0 | 1008 | $5,400 | $5.36 | 1d | 1 | 1.34mi |
| 450 N Mathilda Ave Sunnyvale, CA | 1.0–2.0 | 1.0–2.0 | 810 | $4,217 | $5.21 | 1d | 4 | 1.36mi |
Listing history 6 events
-
2026-06-18days on market $253,000 Active 7 DOM
-
2026-06-17days on market $253,000 Active 6 DOM
-
2026-06-16days on market $253,000 Active 5 DOM
-
2026-06-15days on market $253,000 Active 4 DOM
-
2026-06-13remarks 347-char remark
-
2026-06-13$253,000 Active 2 DOM
ⓘ Source: listings_history table (triggers on properties + properties_extension) + one-shot
backfill from property_details.listing_events for pre-trigger history.
Climate risk First Street
- Flood 1/10 Low FEMA zone AE · 0% chance over 30 yrs
- Wildfire 1/10 Low
- Heat 5/10 Major 7 d/yr ≥90°F today · 15 d/yr by 30 yrs out
- Wind 1/10 Low
- Air quality 7/10 Severe 13 unhealthy d/yr today · 13 by 30 yrs out
Nearby sold comps map
Loading sold comps map…
Walkable amenities ~0.75 mi
Loading nearby amenities…
Taxation est. · year 1
- Rental income
- $51,622
- − Mortgage interest
- −$14,172
- − Property taxes
- −$3,795
- − Insurance
- −$6,384
- − Repairs & maintenance
- −$4,130
- − Management
- −$4,130
- − Depreciation
- −$7,360
- Taxable income
- $11,652
- Est. tax owed @ 24.0%
- −$2,797
- After-tax cash flow
- $11,885/yr
For passive investors: Depreciation is non-cash, so a rental often shows a tax loss while cash-flowing — sheltering income. Rental losses are passive: they offset passive income freely, and up to $25,000/yr can offset ordinary (W-2) income if you actively participate and your MAGI is under $100k (phasing out to $0 by $150k); unused losses carry forward. On sale, claimed depreciation is recaptured at up to 25%, and gains may owe capital-gains tax (a 1031 exchange can defer both). Figures are a year-1 estimate at your 24.0% rate — not tax advice; consult a CPA.
Schools (NCES district)
- District
- Fremont Union High
- NCES district ID
- 0614430
- Math proficiency
- 87% ▲ 9.00%
- Reading proficiency
- 91% ▲ 10.00%
- Median HH income
- $128,947
- Composite
- 82.66/100
- National rank
- #20
- State rank
- #6 of 517 in CA
Livability — Sunnyvale
- Score
- 82/100
- State rank
- #37
- US rank
- #1258
Category grades
Schools grade is shown separately in the Schools card above.
Census & demographics
- Census place
- Sunnyvale, CA
- County
- Santa Clara County · 1,806,974 people
- City population
- 154,236
- Metro
- San Jose-Sunnyvale-Santa Clara, CA
- Population (ZIP)
- 22,699
- Household income
- $158,304
- Rent vs Own
- Severe rent burden
- 558.0
Population outlook (Santa Clara County) Hauer SSP2
- Today (2025)
- 2,179,074 people
- By 2030
- 2,301,297 · +5.6%
- By 2040
- 2,528,195 · +16.0%
- By 2050
- 2,712,135 · +24.5%
- By 2075
- 2,998,701 · +37.6%
- By 2100
- 2,931,429 · +34.5%
Race, ethnicity, and origin ACS 2023
- Neighborhood character
- Diverse neighborhood (Simpson 0.68)
- Race & ethnicity
- Asian 45% White 24% Hispanic / Latino 24% Two or more races 9% Black 2%
- Hispanic origin (detail)
- Mexican 17%
- Common ancestry
- Scotch-Irish 2% Lithuanian 1% Estonian 1%
- Foreign-born
- 51% · Canada, China, Vietnam
- Languages at home
- 40% English-only · Spanish 18% Chinese 12% Other Asian/Pacific 8%
Political lean MEDSL · Santa Clara
- 2024 margin
- Solid D (+40.0) · D 68.1% · R 28.1% · Other 3.8%
- 2008→2024 swing
- -0.9pp no change · 2008: 40.9pp · 2024: 40.0pp
- All cycles
- 2024: D+40.0 2020: D+47.4 2016: D+52.5 2012: D+42.1 2008: D+40.9
Not yet ingested
- Civics
- —
Market trends
- HPI YoY
- ▼ -3.70%
- Current HPI
- 338.6935
- Rent YoY
- ▲ 2.63%
- Metro
- San Jose-Sunnyvale-Santa Clara, CA
- State GDP YoY
- ▲ 3.21%
- F500 in state
- 116
Industry mix (Fortune 500 HQ in CA)
| Industry | F500 HQs | Revenue |
|---|---|---|
| Technology | 27 | $1,492B |
|
||
| Financial Services | 3 | $174B |
|
||
| Retail | 3 | $44B |
|
||
| Insurance | 3 | $26B |
|
||
| Media / Entertainment | 2 | $115B |
|
||
| Pharmaceuticals / Biotech | 2 | $62B |
|
||
Price history
+94.6% since first listed9 events — show timeline
- 2026-06-12 Listed $253,000 bridgeMLS, Bay East AOR, or Contra Costa AOR
- 2026-06-12 Listed $253,000 MLSListings
- 2017-11-10 Sold (MLS) $145,000 MLSListings
- 2017-10-18 Pending — MLSListings
- 2017-09-27 Price Changed $149,888 MLSListings
- 2017-09-16 Listed $165,000 MLSListings
- 2015-02-03 Pending — MLSListings
- 2015-01-31 Sold (MLS) $130,000 MLSListings
- 2015-01-06 Listed $130,000 MLSListings
Cash-flow waterfall
monthlySold comps — $/sqft
last 12 mo · ≤1 miLoading sold comps…