 Multi-family
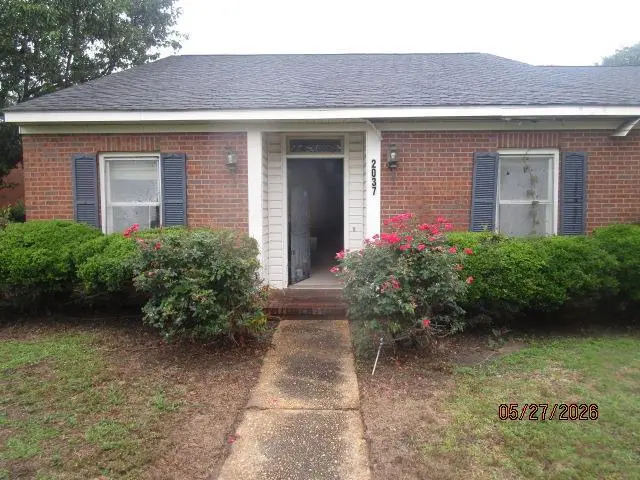
2037 Stuart Ave · Albany, GA
Flood risk 1/10 · Minimal
- FEMA flood zone
- D
- Chance of flooding over 30 yrs
- 0.0%
- Est. flood insurance / yr
- $544 – $1,084
Fire risk 2/10 · Minimal
- Est. fire insurance / yr
- $963 – $1,789
Heat risk 8/10 · Major
- Hot days now (above 109°F)
- 7 days/yr
- Hot days in 30 yrs
- 19 days/yr
Wind risk 8/10 · Major
- Chance of severe wind over 30 yrs
- 98.0%
Air-quality risk 3/10 · Minor
- Unhealthy air days now
- 4 days/yr
- Unhealthy air days in 30 yrs
- 4 days/yr
Risk factors via First Street. Map © Google.
Why this score? — see what drove the B- grade
The composite is a weighted blend of 9 inputs, each scored 0–100. Each bar is that input's sub-score; the figure is the points it added to the 100-point composite (weight × sub-score).
- Cash flow +30.0/30.0
- 1% rule +10.0/10.0
- DSCR +10.0/10.0
- ARV discount +7.5/15.0
- Rent growth +4.8/5.0
- Livability +3.0/5.0
- Condition / age +2.5/5.0
- Schools +1.1/10.0
- Appreciation +0.0/10.0
$84,000
🖨 Deal sheet 📄 Offer letter ✓ Due diligence
Multi-family units
County records classify this as Multi-Family (2-4 Unit). Listing-text estimate: 1 unit. estimate disagrees with records
Listing remarks
LARGE OPRN SPACE WITH A LIVING ROOM AND A KITCHEN, STORAGE, 2 BEDROOMS 2 BATHS. SOLD AS IS. THIS PROPERTY MAY QUALIFY FOR SELLER FINANCING ( VENDEE) IF PROPERTY WAS BUILT PRIOR TO 1978, LEAD BASED PAINT POTENTIALLY EXISTS.
Key facts
- 5,227 sq ft lot
- Built 1991
- Listed 16 days
Property features AI
Finance
- HOA & community: No community amenities listed
Exterior
- Parking: Paved parking; No garage
- Security: Smoke detectors
- Home design: Single family residence; One level
- Construction: Brick construction
- Exterior features: Patio; Landscaped lot; Other lot features
Interior
- Kitchen: Dishwasher
- Bathrooms: 2 full bathrooms
- Interior features: Dishwasher; No fireplace
- Laundry & utility: Outdoor laundry area
Neighborhood map
What this means for you Summary
Snapshot
- This is a 2-bed/2.0-bath multifamily listed at $84k.
Deal economics
- At list price, monthly cash flow is $807 ($10k/yr) — positive.
- The deal already cash-flows at list — no discount required.
- Meets the 1% rule at list price ($2k rent vs $84k).
- Recommended offer: $83k (1.5% below list) — sets the bar for market timing.
- Cap rate 17.8% vs local median 4.7% in Albany — top-decile yield for the area; either an underpriced asset or a hidden risk that comps aren't pricing in. Stress-test before assuming the spread holds.
Location & tenants
- Location reads 60/100 on livability (#371 in GA) — a middle-class / working-renter tenant base. Strengths: cost of living A+, housing A-, health & safety B+; Watch: schools F, crime F, amenities F.
- Dougherty County (urban): math 12% / reading 16% proficiency, ranked #163 of 174 in GA (top 94%) — low school quality limits family demand, transient renter base, plan for 1-2y turnover; 79% free/reduced lunch — lower-income household profile, screen leases tightly.
- Market conditions: Rents rising fast (+9.4%/yr); 184 active listings in the ZIP; 11 comparable units currently listed for rent nearby; rentals at typical pace (median 21d on market — plan ~3-4 weeks tenant-placement turnaround); 45 units permitted in Dougherty County in 2024 (20 in 5+ unit buildings).
- This rent runs 43% of the median local income ($51k/yr) — at the standard rent-burdened threshold; future hikes will face affordability resistance.
Forward outlook
- Local home prices are declining (-3.0%/yr); year-one equity from $581 of loan paydown is wiped out by about $3k of value loss. Plan a longer hold.
- Dougherty County population projected at -24% by 2050 — secular population decline; favor cash flow + early exit over multi-decade hold.
- At projected returns (-3.0% appreciation + 8.0% rent growth), your $24k cash investment doubles in ~3 years — after that, you're playing with house money.
Negotiation context
- It's been on market 17 days — a 2% lower offer ($83k) is reasonable based on typical stale-listing flexibility.
Risks & watch-outs
- Climate carrying-cost: severe wind risk, 98% chance of damaging wind over 30y; extreme-heat days projected 7→19/yr by 2055 (HVAC capex compounding) — expect insurance premiums to compound above CPI over the hold.
Questions for the listing agent
- Is there a deadline driving the sale (1031 exchange, divorce, estate, relocation)? That informs how much negotiation room exists.
- Schools are F-rated, which usually means shorter tenancies and higher turnover. Who's the typical renter profile here, and what's been the actual vacancy rate?
- Crime grade is F in this area — have there been break-ins, vandalism, or insurance claims at this property in the last 3 years? What carrier currently insures it and at what premium?
- What's the average days-on-market for RENTAL listings here right now (not sales)? A rising rental-DOM trend means longer vacancies and softer asking-rent achievability than the comps imply.
- What's the recent tenant-quality profile in this submarket — average credit score on applications, eviction rate, late-payment / NSF rate, and stable-employment percentage? A property-management company in the area should have these aggregated.
- How much new apartment / multifamily construction is in the pipeline within 1–3 miles? Heavy new supply (>2% of stock underway) typically softens rents 12–24 months out; light construction supports rent growth.
Investment metrics
- 1% rule
- 2.18% ✓
- Cap rate
- 17.82%
- Cash-on-cash
- 41.18%
- DSCR
- 2.83
- GRM
- 3.8
CMA / ARV
No comps found within radius.
Projected returns pro-forma
-3.0% appreciation · 8.0% rent growth · sell at horizon
- IRR
- 43.5%
- Equity multiple
- 3.02×
- Total profit
- $47,515
- Equity at exit
- $12,525
- IRR
- 51.9%
- Equity multiple
- 7.45×
- Total profit
- $151,787
- Equity at exit
- $7,263
Cash invested: $23,520 (down + closing). Projections, not guarantees.
Landlord ↔ Tenant lean methodology
- Overall (STATE)
- 90 Strongly Landlord-Friendly
- State Georgia
- 90 Strongly Landlord-Friendly · R+3
- County
- — inherits STATE
- City
- — inherits STATE
ZIP-level market 31707
- Rents YoY
- 9.4%
- Active inventory
- 184
- Price-to-rent
- 7.7×
Monthly cashflow live
- Estimated rent
- $1,828 medium interval (Pro) →
- Mortgage (P&I)
- −$441
- Tax from tax record
- −$162 /mo · $1,938/yr
- Insurance
- −$35
- HOA
- −$0
- Vacancy / Maint / Mgmt
- −$384
- Net cashflow
- $807
Break-even live
2-unit breakdown (identical units grouped — click to expand)
| Units | Beds | Baths | Est. rent |
|---|---|---|---|
| 2× units | 2 | 2 | $1,828 |
| #1 | 2 | 2 | $914 |
| #2 | 2 | 2 | $914 |
| Total (2 units) | $1,828 | ||
UW: 25.0% down · 7.5% · 30yr · 1.5% tax · 5.0% vac · 8.0% maint · 8.0% mgmt
Financing live
Cash to close
- Down payment
- $21,000
- Closing costs
- $2,520
- Reserves months
- —
- Total cash needed
- —
Loan-product check · same deal, 3 products live
Conventional
25% down · 7.5% · 30yr
- Down + closing
- —
- Monthly P&I
- —
- Monthly cashflow
- —
- DSCR
- —
- Eligible?
- —
Personal DTI + credit; lowest rate.
DSCR
20% down · 8.5% · 30yr
- Down + closing
- —
- Monthly P&I
- —
- Monthly cashflow
- —
- DSCR
- —
- Eligible?
- —
No personal income docs; deal must DSCR.
Hard money
10% down · 12.0% · 12mo
- Down + closing
- —
- Monthly P&I
- —
- Monthly cashflow
- —
- DSCR
- —
- Eligible?
- —
Short-term bridge; refi at stabilization.
Rent comps 11 comps
| Address | Beds | Baths | Sqft | Rent | $/sqft | DOM | Units | Dist |
|---|---|---|---|---|---|---|---|---|
| 3315 Sylvester Rd Unit 63 Albany, GA | 3.0 | 2.0 | 1024 | $900 | $0.88 | 21d | 1 | 0.18mi |
| 1905 Elkhorn Ln Unit B Albany, GA | 2.0 | 1.5 | 1100 | $1,000 | $0.91 | 21d | 1 | 0.27mi |
| 2510 Barnesdale Way Unit 4 Albany, GA | 2.0 | 2.0 | 1081 | $1,175 | $1.09 | 21d | 1 | 0.31mi |
| 1900 Buck Ln Albany, GA | 3.0 | 2.5 | 1280 | $1,195 | $0.93 | 21d | 1 | 0.32mi |
| 2502 Redwood Ct Albany, GA | 2.0 | 1.5 | 1120 | $900 | $0.80 | 21d | 1 | 0.59mi |
| 2001 Dawson Rd Albany, GA | 1.0–3.0 | 1.0–1.5 | 952 | $888 | $0.93 | 21d | 7 | 0.87mi |
| 2415 Dawson Rd Albany, GA | 1.0–3.0 | 1.0–2.0 | 987 | $858 | $0.87 | 21d | 1 | 0.89mi |
| 1314 9th Ave Albany, GA | 3.0 | 1.0 | 1090 | $1,000 | $0.92 | 21d | 1 | 1.22mi |
| 914 20th Ave Albany, GA | 2.0 | 1.0 | 988 | $815 | $0.82 | 43d | 1 | 1.29mi |
| 2607 Cardinal St Albany, GA | 2.0 | 1.0 | 900 | $850 | $0.94 | 21d | 1 | 1.33mi |
| 1906 Robinhood Rd Albany, GA | 3.0 | 2.0 | 1845 | $1,600 | $0.87 | 21d | 1 | 1.41mi |
Listing history 14 events
-
2026-06-19days on market $84,000 Active 17 DOM
-
2026-06-18days on market $84,000 Active 16 DOM
-
2026-06-17days on market $84,000 Active 15 DOM
-
2026-06-16days on market $84,000 Active 14 DOM
-
2026-06-15days on market $84,000 Active 13 DOM
-
2026-06-14days on market $84,000 Active 11 DOM
-
2026-06-13days on market $84,000 Active 10 DOM
-
2026-06-10days on market $84,000 Active 8 DOM
-
2026-06-09days on market $84,000 Active 7 DOM
-
2026-06-08days on market $84,000 Active 6 DOM
-
2026-06-07days on market $84,000 Active 5 DOM
-
2026-06-05days on market $84,000 Active 2 DOM
-
2026-06-03remarks 222-char remark
-
2026-06-03$84,000 Active 1 DOM
ⓘ Source: listings_history table (triggers on properties + properties_extension) + one-shot
backfill from property_details.listing_events for pre-trigger history.
Tax reassessment forecast GA · Resets to sale price
- Current annual tax
- $1,938 · $162/mo
- Projected year-2 tax
- $1,938 · $162/mo
- Expected delta
- $0/yr ($0/mo · -0.0%)
ⓘ Screening estimate from a state-policy table — verify with the county assessor before closing.
Climate risk First Street
- Flood 1/10 Low FEMA zone D · 0% chance over 30 yrs
- Wildfire 2/10 Low
- Heat 8/10 Severe 7 d/yr ≥109°F today · 19 d/yr by 30 yrs out
- Wind 8/10 Severe 98% chance of damaging wind over 30 yrs
- Air quality 3/10 Moderate 4 unhealthy d/yr today · 4 by 30 yrs out
Nearby sold comps map
Loading sold comps map…
Walkable amenities ~0.75 mi
Loading nearby amenities…
Taxation est. · year 1
- Rental income
- $21,936
- − Mortgage interest
- −$4,705
- − Property taxes
- −$1,938
- − Insurance
- −$420
- − Repairs & maintenance
- −$1,755
- − Management
- −$1,755
- − Depreciation
- −$2,444
- Taxable income
- $8,919
- Est. tax owed @ 24.0%
- −$2,141
- After-tax cash flow
- $7,544/yr
For passive investors: Depreciation is non-cash, so a rental often shows a tax loss while cash-flowing — sheltering income. Rental losses are passive: they offset passive income freely, and up to $25,000/yr can offset ordinary (W-2) income if you actively participate and your MAGI is under $100k (phasing out to $0 by $150k); unused losses carry forward. On sale, claimed depreciation is recaptured at up to 25%, and gains may owe capital-gains tax (a 1031 exchange can defer both). Figures are a year-1 estimate at your 24.0% rate — not tax advice; consult a CPA.
Schools (NCES district)
- District
- Dougherty County
- NCES district ID
- 1301830
- Math proficiency
- 12% ▼ -15.00%
- Reading proficiency
- 16% ▼ -9.00%
- Median HH income
- $33,105
- Composite
- 11.31/100
- National rank
- #9716
- State rank
- #163 of 174 in GA
Livability — Albany
- Score
- 60/100
- State rank
- #371
- US rank
- #18903
Category grades
Schools grade is shown separately in the Schools card above.
Census & demographics
- Census place
- Albany, GA
- County
- Dougherty County · 89,040 people
- City population
- 89,040
- Metro
- Albany, GA
- Population (ZIP)
- 22,679
- Household income
- $50,862
- Rent vs Own
- Severe rent burden
- 1572.0
Population outlook (Dougherty County) Hauer SSP2
- Today (2025)
- 84,551 people
- By 2030
- 80,637 · -4.6%
- By 2040
- 72,090 · -14.7%
- By 2050
- 64,056 · -24.2%
- By 2075
- 46,332 · -45.2%
- By 2100
- 33,127 · -60.8%
Race, ethnicity, and origin ACS 2023
- Neighborhood character
- Majority Black (63%)
- Race & ethnicity
- Black 63% White 31% Two or more races 3% Hispanic / Latino 3% Asian 1%
- Common ancestry
- Serbian 1% Iranian 1% Slovak 1%
- Foreign-born
- 2% · Canada
- Languages at home
- 96% English-only · Spanish 2% Other Indo-European 1%
Political lean MEDSL · Dougherty
- 2024 margin
- Solid D (+41.1) · D 70.4% · R 29.3%
- 2008→2024 swing
- +6.2pp toward D · 2008: 35.0pp · 2024: 41.1pp
- All cycles
- 2024: D+41.1 2020: D+40.0 2016: D+38.3 2012: D+39.0 2008: D+35.0
Not yet ingested
- Civics
- —
Market trends
- HPI YoY
- ▼ -130.86%
- Current HPI
- 173.4443
- Rent YoY
- ▲ 9.39%
- Metro
- Albany, GA
- State GDP YoY
- ▲ 2.66%
- F500 in state
- 28
Industry mix (Fortune 500 HQ in GA)
| Industry | F500 HQs | Revenue |
|---|---|---|
| Paper / Packaging | 2 | $29B |
|
||
| Retail | 1 | $160B |
|
||
| Transportation / Logistics | 1 | $91B |
|
||
| Airlines | 1 | $62B |
|
||
| Consumer Goods | 1 | $47B |
|
||
| Utilities | 1 | $25B |
|
||
Price history
-11.5% since first listed2 events — show timeline
- 2026-06-02 Listed $84,000 CABOR
- 2005-01-18 Sold (Public Records) $94,900 Public Records
Property tax history
+3.8%/yrLatest (2025): $1,938 · +6.1% YoY. Source: county tax records.
Cash-flow waterfall
monthlySold comps — $/sqft
last 12 mo · ≤1 miLoading sold comps…