108 Undercliff Rd · Ohioville, PA
Flood risk 1/10 · Minimal
- FEMA flood zone
- X (unshaded)
- Chance of flooding over 30 yrs
- 0.0%
- Est. flood insurance / yr
- $507 – $1,088
Fire risk 1/10 · Minimal
- Est. fire insurance / yr
- $511 – $949
Heat risk 3/10 · Minor
- Hot days now (above 96°F)
- 7 days/yr
- Hot days in 30 yrs
- 17 days/yr
Wind risk 2/10 · Minimal
- Chance of severe wind over 30 yrs
- —
Air-quality risk 4/10 · Minor
- Unhealthy air days now
- 3 days/yr
- Unhealthy air days in 30 yrs
- 6 days/yr
Risk factors via First Street. Map © Google.
Why this score? — see what drove the B+ grade
The composite is a weighted blend of 9 inputs, each scored 0–100. Each bar is that input's sub-score; the figure is the points it added to the 100-point composite (weight × sub-score).
- Cash flow +30.0/30.0
- 1% rule +10.0/10.0
- DSCR +10.0/10.0
- ARV discount +7.5/15.0
- Appreciation +7.1/10.0
- Schools +4.8/10.0
- Livability +3.6/5.0
- Rent growth +2.5/5.0
- Condition / age +2.5/5.0
$55,316
🖨 Deal sheet (PDF) 📄 Offer letter ✓ Due diligence
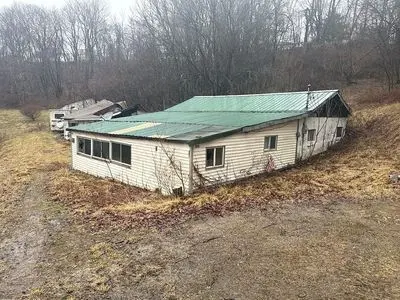
Listing remarks
Rare opportunity to own 6.38 acres overlooking the Ohio River valley. This property includes parcels at 108, 114, 117, and 123 Undercliff Rd and offers a unique blend of privacy, acreage, and development potential. The main home is a 2 bed, 1 bath (~1,024 sq ft) that will require a full renovation after being vacant since 2022. The property also includes a second burned-out structure that will need to be removed, but it already has an existing well and septic system in place. Approximately 2.11 acres of level land provides space for additional building opportunities, while the remaining acreage slopes toward the wooded river bluff for a secluded setting. With electric and city water availab
Key facts
- Built 1945
Neighborhood map
What this means for you Summary
Snapshot
- This is a 1-bed/1.0-bath single-family listed at $55k.
Deal economics
- At list price, monthly cash flow is $261 ($3k/yr) — positive.
- The deal already cash-flows at list — no discount required.
- Meets the 1% rule at list price ($832 rent vs $55k).
Location & tenants
- Location reads 71/100 on livability (#711 in PA) — a middle-class / working-renter tenant base. Strengths: crime A+, cost of living A+, housing A+; Watch: health & safety C-, schools D+, amenities F.
- Western Beaver County SD (rural): math 43% / reading 68% proficiency, ranked #108 of 539 in PA (top 20%) — acceptable for families but not a draw, mixed tenant base, ~2y average lease.
- Market conditions: 15 active listings in the ZIP; 10 comparable units currently listed for rent nearby; rentals leasing fast (median 12d on market — plan ~1-2 weeks tenant-placement turnaround); 272 units permitted in Beaver County in 2024 (80 in 5+ unit buildings).
- This rent is only 15% of the median local income ($66k/yr) — well below the 30% rent-burden line; pricing power to push rent on renewal without tenant pushback.
Forward outlook
- In year one you build about $3k of equity ($382 loan paydown + $2k appreciation (4.3% local appreciation)).
- Beaver County population projected at -14% by 2050 — secular population decline; favor cash flow + early exit over multi-decade hold.
- At projected returns (4.3% appreciation + 3.0% rent growth), your $15k cash investment doubles in ~3 years — after that, you're playing with house money.
Negotiation context
- Only 0 days on market — expect competitive offers; lowballing is unlikely to land.
Risks & watch-outs
- Watch-outs: built in 1945 — expect roof / HVAC / electrical / plumbing capex.
Questions for the listing agent
- Built in 1945 — when were the roof, HVAC, electrical panel, plumbing, and water heater last replaced?
- Is there a deadline driving the sale (1031 exchange, divorce, estate, relocation)? That informs how much negotiation room exists.
- Schools are D-rated, which usually means shorter tenancies and higher turnover. Who's the typical renter profile here, and what's been the actual vacancy rate?
- What's the average days-on-market for RENTAL listings here right now (not sales)? A rising rental-DOM trend means longer vacancies and softer asking-rent achievability than the comps imply.
- What's the recent tenant-quality profile in this submarket — average credit score on applications, eviction rate, late-payment / NSF rate, and stable-employment percentage? A property-management company in the area should have these aggregated.
- How much new for-sale + rental construction is in the pipeline within 1–3 miles? Heavy new supply typically softens prices + rents 12–24 months out; constrained supply supports both.
Investment metrics
- 1% rule
- 1.50% ✓
- Cap rate
- 11.95%
- Cash-on-cash
- 20.21%
- DSCR
- 1.90
- GRM
- 5.5
CMA / ARV
No comps found within radius.
Projected returns pro-forma
4.29% appreciation · 3.0% rent growth · sell at horizon
- IRR
- 29.1%
- Equity multiple
- 2.75×
- Total profit
- $27,162
- Equity at exit
- $28,979
- IRR
- 28.4%
- Equity multiple
- 5.45×
- Total profit
- $68,938
- Equity at exit
- $48,156
Cash invested: $15,488 (down + closing). Projections, not guarantees.
Landlord ↔ Tenant lean methodology
- Overall (STATE)
- 62 Landlord-Friendly
- State Pennsylvania
- 62 Landlord-Friendly · EVEN
- County
- — inherits STATE
- City
- — inherits STATE
ZIP-level market 15059
- Home prices YoY
- 1.8%
- Active inventory
- 15
- Price-to-rent
- 5.5×
Monthly cashflow live
- Estimated rent
- $832 high interval (Pro) →
- Mortgage (P&I)
- −$290
- Tax from tax record
- −$83 /mo · $999/yr
- Insurance
- −$23
- HOA
- −$0
- Vacancy / Maint / Mgmt
- −$175
- Net cashflow
- $261
Break-even live
Sensitivity live
| Price | -10% $292 | -5% $277 | +0% $261 | +5% $245 | +10% $230 |
|---|---|---|---|---|---|
| Rent | -10% $195 | -5% $228 | +0% $261 | +5% $294 | +10% $327 |
| Rate | -1.0pp $289 | -0.5pp $275 | base $261 | +0.5pp $247 | +1.0pp $232 |
UW: 25.0% down · 7.5% · 30yr · 1.5% tax · 5.0% vac · 8.0% maint · 8.0% mgmt
Financing live
Cash to close
- Down payment
- $13,829
- Closing costs
- $1,659
- Reserves months
- —
- Total cash needed
- —
Loan-product check · same deal, 3 products live
Conventional
25% down · 7.5% · 30yr
- Down + closing
- —
- Monthly P&I
- —
- Monthly cashflow
- —
- DSCR
- —
- Eligible?
- —
Personal DTI + credit; lowest rate.
DSCR
20% down · 8.5% · 30yr
- Down + closing
- —
- Monthly P&I
- —
- Monthly cashflow
- —
- DSCR
- —
- Eligible?
- —
No personal income docs; deal must DSCR.
Hard money
10% down · 12.0% · 12mo
- Down + closing
- —
- Monthly P&I
- —
- Monthly cashflow
- —
- DSCR
- —
- Eligible?
- —
Short-term bridge; refi at stabilization.
Rent comps 10 comps
| Address | Beds | Baths | Sqft | Rent | $/sqft | DOM | Units | Dist |
|---|---|---|---|---|---|---|---|---|
| 66 Midland Heights Cir Unit MHH-66B Midland, PA | 2.0 | 1.0 | 715 | $895 | $1.25 | 44d | 1 | 0.21mi |
| 03 Midland Heights Cir Unit MHH-03F Midland, PA | 2.0 | 1.0 | 715 | $795 | $1.11 | 22d | 1 | 0.30mi |
| 5 Midland Heights Cir Unit MHH-05B Midland, PA | 2.0 | 1.0 | 715 | $695 | $0.97 | 20d | 1 | 0.32mi |
| 5 Midland Heights Cir Unit MHH-05A Midland, PA | 2.0 | 1.0 | 715 | $795 | $1.11 | 22d | 1 | 0.32mi |
| 38 Midland Heights Cir Unit MHH-38C Midland, PA | 2.0 | 1.0 | 715 | $895 | $1.25 | 2d | 1 | 0.37mi |
| 13 Midland Heights Cir Unit MHH-13D Midland, PA | 2.0 | 1.0 | 715 | $895 | $1.25 | 11d | 1 | 0.38mi |
| 22 Midland Heights Cir Unit MHH-22A Midland, PA | 2.0 | 1.0 | 715 | $895 | $1.25 | 2d | 1 | 0.38mi |
| 50 Midland Heights Cir Unit MHH-50B Midland, PA | 2.0 | 1.0 | 715 | $895 | $1.25 | 8d | 1 | 0.39mi |
| 51 Midland Heights Cir Unit MHH-51C Midland, PA | 2.0 | 1.0 | 715 | $795 | $1.11 | 11d | 1 | 0.43mi |
| 100 Midland Heights Cir Midland, PA | 2.0–4.0 | 1.0 | 945 | $795 | $0.84 | 2d | 9 | 0.52mi |
Listing history 1 events
-
2026-05-26$55,316
ⓘ Source: listings_history table (triggers on properties + properties_extension) + one-shot
backfill from property_details.listing_events for pre-trigger history.
Tax reassessment forecast PA · Partial reset (capped growth)
- Current annual tax
- $999 · $83/mo
- Projected year-2 tax
- $999 · $83/mo
- Expected delta
- $0/yr ($0/mo · 0.0%)
ⓘ Screening estimate from a state-policy table — verify with the county assessor before closing.
Climate risk First Street
- Flood 1/10 Low FEMA zone X (unshaded) · 0% chance over 30 yrs
- Wildfire 1/10 Low
- Heat 3/10 Moderate 7 d/yr ≥96°F today · 17 d/yr by 30 yrs out
- Wind 2/10 Low
- Air quality 4/10 Moderate 3 unhealthy d/yr today · 6 by 30 yrs out
Nearby sold comps map
Loading sold comps map…
Walkable amenities ~0.75 mi
Loading nearby amenities…
Taxation est. · year 1
- Rental income
- $9,984
- − Mortgage interest
- −$3,099
- − Property taxes
- −$999
- − Insurance
- −$277
- − Repairs & maintenance
- −$799
- − Management
- −$799
- − Depreciation
- −$1,609
- Taxable income
- $2,403
- Est. tax owed @ 24.0%
- −$577
- After-tax cash flow
- $2,554/yr
For passive investors: Depreciation is non-cash, so a rental often shows a tax loss while cash-flowing — sheltering income. Rental losses are passive: they offset passive income freely, and up to $25,000/yr can offset ordinary (W-2) income if you actively participate and your MAGI is under $100k (phasing out to $0 by $150k); unused losses carry forward. On sale, claimed depreciation is recaptured at up to 25%, and gains may owe capital-gains tax (a 1031 exchange can defer both). Figures are a year-1 estimate at your 24.0% rate — not tax advice; consult a CPA.
Schools (NCES district)
- District
- Western Beaver County SD
- NCES district ID
- 4226040
- Math proficiency
- 43% ▼ -7.00%
- Reading proficiency
- 68% ▼ -3.00%
- Median HH income
- $54,026
- Composite
- 47.63/100
- National rank
- #2253
- State rank
- #108 of 539 in PA
Livability — Ohioville
- Score
- 71/100
- State rank
- #711
- US rank
- #7040
Category grades
Schools grade is shown separately in the Schools card above.
Census & demographics
- Census place
- Ohioville, PA
- County
- Beaver County · 116,001 people
- City population
- 4,186
- Metro
- Pittsburgh, PA
- Population (ZIP)
- 4,070
- Household income
- $66,231
- Rent vs Own
- Severe rent burden
- 43.0
Population outlook (Beaver County) Hauer SSP2
- Today (2025)
- 164,976 people
- By 2030
- 161,449 · -2.1%
- By 2040
- 151,752 · -8.0%
- By 2050
- 141,155 · -14.4%
- By 2075
- 118,142 · -28.4%
- By 2100
- 91,740 · -44.4%
Race, ethnicity, and origin ACS 2023
- Neighborhood character
- Predominantly White (88%)
- Race & ethnicity
- White 88% Black 6% Two or more races 4% Hispanic / Latino 1%
- Common ancestry
- Romanian 4% Serbian 2% Iranian 1%
- Foreign-born
- 1%
- Languages at home
- 99% English-only · Russian/Polish/Slavic 1%
Political lean MEDSL · Beaver
- 2024 margin
- Strong R (+20.7) · D 39.2% · R 59.9%
- 2008→2024 swing
- -17.9pp toward R · 2008: -2.8pp · 2024: -20.7pp
- All cycles
- 2024: R+20.7 2020: R+17.7 2016: R+20.1 2012: R+6.6 2008: R+2.8
Not yet ingested
- Civics
- —
Market trends
- HPI YoY
- ▲ 4.29%
- Current HPI
- 243.9961
- Rent YoY
- —
- Metro
- Pittsburgh, PA
- State GDP YoY
- ▲ 1.68%
- F500 in state
- 34
Industry mix (Fortune 500 HQ in PA)
| Industry | F500 HQs | Revenue |
|---|---|---|
| Healthcare | 2 | $309B |
|
||
| Insurance | 2 | $27B |
|
||
| Telecommunications / Media | 1 | $124B |
|
||
| Industrial Distribution | 1 | $22B |
|
||
| Financial Services | 1 | $20B |
|
||
| Chemicals / Materials | 1 | $18B |
|
||
Price history
1 event — show timeline
- 2026-05-26 Listed $55,316 FSBO.com
Property tax history
+2.8%/yrLatest (2026): $999 · +4.2% YoY. Source: county tax records.
Cash-flow waterfall
monthlySold comps — $/sqft
last 12 mo · ≤1 miLoading sold comps…