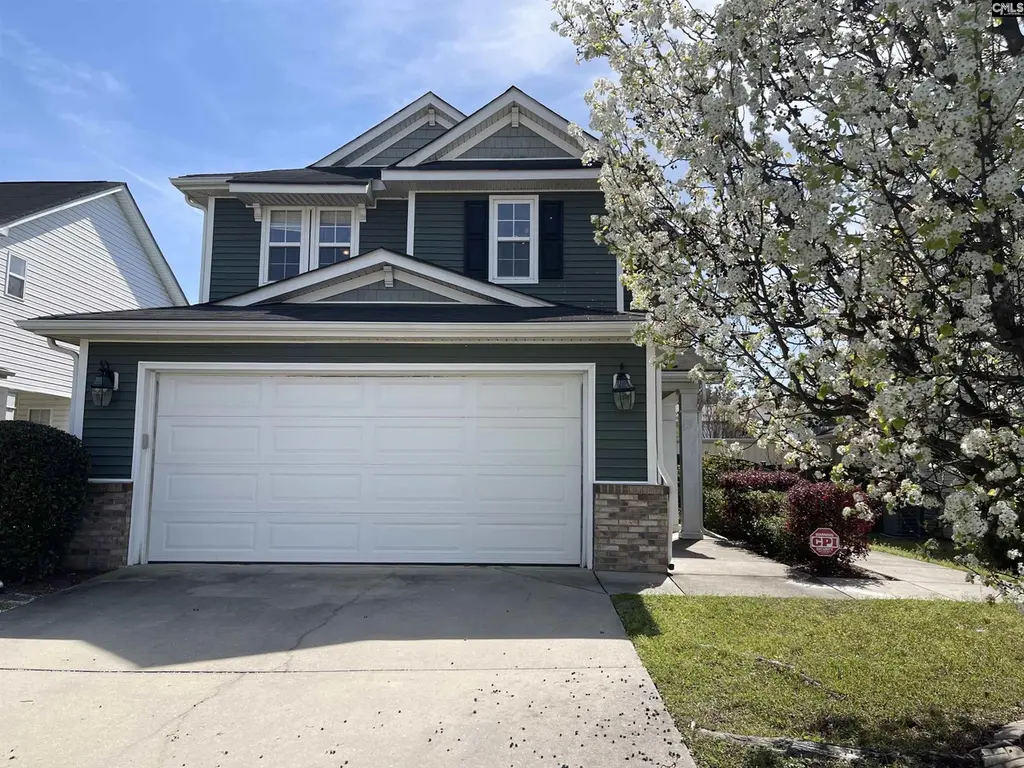
319 Charter Oak Ct · Lexington, SC
Flood risk 1/10 · Minimal
- FEMA flood zone
- X (unshaded)
- Chance of flooding over 30 yrs
- 0.0%
- Est. flood insurance / yr
- $507 – $1,088
Fire risk 4/10 · Minor
- Est. fire insurance / yr
- $783 – $1,453
Heat risk 6/10 · Moderate
- Hot days now (above 108°F)
- 7 days/yr
- Hot days in 30 yrs
- 16 days/yr
Wind risk 6/10 · Moderate
- Chance of severe wind over 30 yrs
- 65.0%
Air-quality risk 3/10 · Minor
- Unhealthy air days now
- 2 days/yr
- Unhealthy air days in 30 yrs
- 2 days/yr
Risk factors via First Street. Map © Google.
Why this score? — see what drove the D grade
The composite is a weighted blend of 9 inputs, each scored 0–100. Each bar is that input's sub-score; the figure is the points it added to the 100-point composite (weight × sub-score).
- Cash flow +13.9/30.0
- ARV discount +7.5/15.0
- DSCR +4.2/10.0
- Schools +4.2/10.0
- Livability +4.0/5.0
- Rent growth +3.3/5.0
- 1% rule +2.8/10.0
- Condition / age +2.5/5.0
- Appreciation +0.0/10.0
$249,000
🖨 Deal sheet (PDF) 📄 Offer letter ✓ Due diligence
Listing remarks
* * Beautiful Charter Oak Home in Lexington, SC – Move-In Ready! * * Welcome to * * Charter Oak * * in Lexington, SC 29072—where style, comfort, and thoughtful design come together in this stunning * * 3-bedroom, 2.5-bath Alexander floor plan * * home!Tucked back from the road for added privacy, this home makes a lasting impression from the moment you arrive. A unique side-entry front door welcomes you into a spacious and inviting family room—perfect for gathering with friends and family. The heart of the home is the beautifully appointed kitchen, featuring * * granite countertops, rich cherry cabinetry, crown molding, recessed lighting, and a large island * *
Key facts
- Large island
- Cherry cabinetry
- Recessed lighting
Tags
Property features AI
Finance
- Other: Paved road access; Lot size approximately 0.11 acres
- HOA & community: Has association; Association covers common area maintenance
Exterior
- Parking: Attached garage with 2 garage spaces; Total of 2 parking spaces
- Utilities: Public water; Public sewer
- Home design: Two-story property
- Construction: Slab foundation
- Exterior features: Vinyl exterior finish; Wood rear-only fence
Interior
- Kitchen: Island; Pantry; Granite countertops; Painted cabinets; Luxury vinyl plank flooring in kitchen; Dishwasher; Disposal; Refrigerator; Microwave above stove; Free-standing range
- Bedrooms: Master bedroom on second floor with private bath and tub/shower; Two additional bedrooms on second floor with shared bath
- Flooring: Engineered hardwood in bedrooms; Hardwood in living room; Luxury vinyl plank in kitchen
- Bathrooms: Two full bathrooms; One half bathroom; Second full baths indicated (total counts reflect multiple full baths)
- Heating & cooling: Central air conditioning; Electric heating; Heat pump on first level; Heat pump on second level
- Interior features: Ceiling fans in living room and master bedroom; Hardwood floors in living room; Engineered hardwood flooring in bedrooms; Florida room
- Laundry & utility: Washer/dryer not specifically listed
Neighborhood map
What this means for you Summary
Snapshot
- This is a 3-bed/2.5-bath single-family listed at $249k.
Deal economics
- At list price, monthly cash flow is $26 ($309/yr) — positive.
- The deal already cash-flows at list — no discount required.
- To meet the 1% rule (rent ≥ 1% of price), the offer needs to be $194k (22.1% below list).
- Recommended offer: $194k (22.1% below list) — sets the bar for 1% rule.
Location & tenants
- Location reads 81/100 on livability (#8 in SC, #1,502 nationally) — a professional / high-income tenant draw. Strengths: housing A+, health & safety A+, employment A; Watch: commute F.
- Lexington 01 (suburban): math 42% / reading 53% proficiency, ranked #11 of 80 in SC (top 14%) — families likely to look elsewhere, expect single-tenant / working-renter base with shorter leases.
- Zoned schools: Lake Murray Elementary (math 73% / reading 70%, grade A-, #32 of 597 statewide, top 5%, 901 students, 12% FRL); Pleasant Hill Middle (math 50% / reading 58%, grade B-, #27 of 229 statewide, top 12%, 748 students, 21% FRL); Lexington High (math 69% / reading 92%, grade A, #23 of 196 statewide, top 11%, 2,410 students, 17% FRL).
- Zoned-school proficiency averages 69% at this address vs 48% district-wide (+21 pts) — the actual schools serving this property are materially stronger than the Lexington 01 average implies; a family-tenant draw the district grade alone would hide.
- Market conditions: Rents rising (+3.2%/yr); 714 active listings in the ZIP; 3 comparable units currently listed for rent nearby; rentals at typical pace (median 16d on market — plan ~3-4 weeks tenant-placement turnaround); solid renter incomes; 1,712 units permitted in Lexington County in 2024 (0 in 5+ unit buildings).
Forward outlook
- Local home prices are declining (-3.0%/yr); year-one equity from $2k of loan paydown is wiped out by about $7k of value loss. Plan a longer hold.
- Lexington County population projected at +26% by 2050 — long-run rental-demand tailwind backs the buy-and-hold thesis.
Negotiation context
- It's been on market 75 days — a 6% lower offer ($234k) is reasonable based on typical stale-listing flexibility.
Risks & watch-outs
- Climate carrying-cost: major wind risk, 65% chance of damaging wind over 30y; extreme-heat days projected 7→16/yr by 2055 (HVAC capex compounding) — expect insurance premiums to compound above CPI over the hold.
Questions for the listing agent
- It's been on market 75 days. Have you received any prior offers? Is the seller open to a 22% concession, seller financing, or rate buy-down credit?
- What does the HOA fee cover, when was the last increase, and are there any pending special assessments or reserve-fund shortfalls?
- Why hasn't it sold? Are there any deal-killer items the seller is aware of (foundation, flood, title, zoning, code violations)?
- Is there a deadline driving the sale (1031 exchange, divorce, estate, relocation)? That informs how much negotiation room exists.
- Schools are B-rated — typically a magnet for longer-tenancy family renters. What's the average tenant stay here, and is there a school-zone premium baked into asking?
- The area grade is low — what's the realistic commute time and amenity access for the typical tenant pool here? Any planned neighborhood developments (good or bad) we should know about?
- What's the average days-on-market for RENTAL listings here right now (not sales)? A rising rental-DOM trend means longer vacancies and softer asking-rent achievability than the comps imply.
- What's the recent tenant-quality profile in this submarket — average credit score on applications, eviction rate, late-payment / NSF rate, and stable-employment percentage? A property-management company in the area should have these aggregated.
- How much new for-sale + rental construction is in the pipeline within 1–3 miles? Heavy new supply typically softens prices + rents 12–24 months out; constrained supply supports both.
Investment metrics
- 1% rule
- 0.78% ✗
- Cap rate
- 6.42%
- Cash-on-cash
- 0.44%
- DSCR
- 1.02
- GRM
- 10.7
CMA / ARV
No comps found within radius.
Projected returns pro-forma
-3.0% appreciation · 3.23% rent growth · sell at horizon
- IRR
- -15.4%
- Equity multiple
- 0.45×
- Total profit
- $-38,359
- Equity at exit
- $37,127
- IRR
- -6.6%
- Equity multiple
- 0.57×
- Total profit
- $-29,851
- Equity at exit
- $21,529
Cash invested: $69,720 (down + closing). Projections, not guarantees.
Landlord ↔ Tenant lean methodology
- Overall (STATE)
- 90 Strongly Landlord-Friendly
- State South Carolina
- 90 Strongly Landlord-Friendly · R+6
- County
- — inherits STATE
- City
- — inherits STATE
ZIP-level market 29072
- Rents YoY
- 3.2%
- Active inventory
- 714
- Price-to-rent
- 10.7×
Monthly cashflow live
- Estimated rent
- $1,939 medium interval (Pro) →
- Mortgage (P&I)
- −$1,306
- Tax from tax record
- −$77 /mo · $929/yr
- Insurance
- −$104
- HOA
- −$19
- Vacancy / Maint / Mgmt
- −$407
- Net cashflow
- $26
Break-even live
Sensitivity live
| Price | -10% $167 | -5% $96 | +0% $26 | +5% $-45 | +10% $-115 |
|---|---|---|---|---|---|
| Rent | -10% $-127 | -5% $-51 | +0% $26 | +5% $102 | +10% $179 |
| Rate | -1.0pp $151 | -0.5pp $89 | base $26 | +0.5pp $-39 | +1.0pp $-104 |
UW: 25.0% down · 7.5% · 30yr · 1.5% tax · 5.0% vac · 8.0% maint · 8.0% mgmt
Financing live
Cash to close
- Down payment
- $62,250
- Closing costs
- $7,470
- Reserves months
- —
- Total cash needed
- —
Loan-product check · same deal, 3 products live
Conventional
25% down · 7.5% · 30yr
- Down + closing
- —
- Monthly P&I
- —
- Monthly cashflow
- —
- DSCR
- —
- Eligible?
- —
Personal DTI + credit; lowest rate.
DSCR
20% down · 8.5% · 30yr
- Down + closing
- —
- Monthly P&I
- —
- Monthly cashflow
- —
- DSCR
- —
- Eligible?
- —
No personal income docs; deal must DSCR.
Hard money
10% down · 12.0% · 12mo
- Down + closing
- —
- Monthly P&I
- —
- Monthly cashflow
- —
- DSCR
- —
- Eligible?
- —
Short-term bridge; refi at stabilization.
Rent comps 3 comps
| Address | Beds | Baths | Sqft | Rent | $/sqft | DOM | Units | Dist |
|---|---|---|---|---|---|---|---|---|
| 759 Dawsons Park Way Lexington, SC | 3.0 | 2.5 | 1468 | $1,869 | $1.27 | 23d | 1 | 0.73mi |
| 926 Dawsons Park Way Lexington, SC | 3.0 | 2.5 | 1468 | $1,879 | $1.28 | 16d | 1 | 0.77mi |
| 333 Canary Grass Ct Lexington, SC | 3.0 | 2.5 | 1672 | $1,950 | $1.17 | 16d | 1 | 0.96mi |
HOA detail
- Monthly dues
- $19 · $228/yr
Listing history 10 events
-
2026-06-22days on market $249,000 Active 75 DOM
-
2026-06-18days on market $249,000 Active 72 DOM
-
2026-06-17days on market $249,000 Active 71 DOM
-
2026-06-16days on market $249,000 Active 70 DOM
-
2026-06-15days on market $249,000 Active 69 DOM
-
2026-06-14statusdays on market $249,000 Active 67 DOM
-
2026-05-22status Pending
-
2026-05-10price $249,000
-
2026-04-11price $254,900
-
2026-03-18$259,900 Active
ⓘ Source: listings_history table (triggers on properties + properties_extension) + one-shot
backfill from property_details.listing_events for pre-trigger history.
Tax reassessment forecast SC · Resets to sale price
- Current annual tax
- $929 · $77/mo
- Projected year-2 tax
- $1,419 · $118/mo
- Expected delta
- +$491/yr (+$41/mo · 52.8%)
ⓘ Screening estimate from a state-policy table — verify with the county assessor before closing.
Climate risk First Street
- Flood 1/10 Low FEMA zone X (unshaded) · 0% chance over 30 yrs
- Wildfire 4/10 Moderate
- Heat 6/10 Major 7 d/yr ≥108°F today · 16 d/yr by 30 yrs out
- Wind 6/10 Major 65% chance of damaging wind over 30 yrs
- Air quality 3/10 Moderate 2 unhealthy d/yr today · 2 by 30 yrs out
Nearby sold comps map
Loading sold comps map…
Walkable amenities ~0.75 mi
Loading nearby amenities…
Taxation est. · year 1
- Rental income
- $23,267
- − Mortgage interest
- −$13,948
- − Property taxes
- −$929
- − Insurance
- −$1,245
- − Repairs & maintenance
- −$1,861
- − Management
- −$1,861
- − HOA
- −$228
- − Depreciation
- −$7,244
- Taxable loss
- −$4,049
- Est. tax savings @ 24.0%
- +$972
- After-tax cash flow
- $1,281/yr
For passive investors: Depreciation is non-cash, so a rental often shows a tax loss while cash-flowing — sheltering income. Rental losses are passive: they offset passive income freely, and up to $25,000/yr can offset ordinary (W-2) income if you actively participate and your MAGI is under $100k (phasing out to $0 by $150k); unused losses carry forward. On sale, claimed depreciation is recaptured at up to 25%, and gains may owe capital-gains tax (a 1031 exchange can defer both). Figures are a year-1 estimate at your 24.0% rate — not tax advice; consult a CPA.
Schools (NCES district)
- District
- Lexington 01
- NCES district ID
- 4502700
- Math proficiency
- 42% ▼ -12.00%
- Reading proficiency
- 53% ▼ -2.00%
- Median HH income
- $61,298
- Composite
- 41.75/100
- National rank
- #3399
- State rank
- #11 of 80 in SC
Livability — Lexington
- Score
- 81/100
- State rank
- #8
- US rank
- #1502
Category grades
Schools grade is shown separately in the Schools card above.
Census & demographics
- County
- Lexington County · 232,571 people
- City population
- 122,563
- Metro
- Columbia, SC
- Population (ZIP)
- 69,407
- Household income
- $106,382
- Rent vs Own
- Severe rent burden
- 858.0
Population outlook (Lexington County) Hauer SSP2
- Today (2025)
- 322,999 people
- By 2030
- 342,356 · +6.0%
- By 2040
- 377,715 · +16.9%
- By 2050
- 406,984 · +26.0%
- By 2075
- 465,447 · +44.1%
- By 2100
- 485,674 · +50.4%
Race, ethnicity, and origin ACS 2023
- Neighborhood character
- Predominantly White (80%)
- Race & ethnicity
- White 80% Black 7% Hispanic / Latino 5% Two or more races 5% Asian 4%
- Hispanic origin (detail)
- Mexican 1%
- Common ancestry
- Italian 4% Serbian 3% Romanian 3%
- Foreign-born
- 7% · Canada, Jamaica, China
- Languages at home
- 91% English-only · Spanish 4% Other Indo-European 1% Other Asian/Pacific 1%
Political lean MEDSL · Lexington
- 2024 margin
- Solid R (+33.5) · D 32.5% · R 66.0% · Other 1.4%
- 2008→2024 swing
- +4.6pp toward D · 2008: -38.0pp · 2024: -33.5pp
- All cycles
- 2024: R+33.5 2020: R+30.1 2016: R+36.7 2012: R+37.8 2008: R+38.0
Not yet ingested
- Civics
- —
Market trends
- HPI YoY
- ▼ -197.53%
- Current HPI
- 212.3235
- Rent YoY
- ▲ 3.23%
- Metro
- Columbia, SC
- State GDP YoY
- ▲ 4.51%
- F500 in state
- 2
Industry mix (Fortune 500 HQ in SC)
| Industry | F500 HQs | Revenue |
|---|---|---|
| Packaging | 1 | $7B |
|
||
Price history
-4.2% since first listed4 events — show timeline
- 2026-05-22 Pending — Consolidated MLS
- 2026-05-10 Price Changed $249,000 Consolidated MLS
- 2026-04-11 Price Changed $254,900 Consolidated MLS
- 2026-03-18 Listed $259,900 Consolidated MLS
Property tax history
-11.0%/yrLatest (2024): $929 · +4.4% YoY. Source: county tax records.
Cash-flow waterfall
monthlySold comps — $/sqft
last 12 mo · ≤1 miLoading sold comps…